Akamai Cloud Monitor

The Sumo Logic App for Akamai Cloud Monitor allows you to analyze and correlate Akamai data with origin data in order to improve availability and performance of applications, improve end-user experience, gain deeper user insights, and enforce rigorous security controls. The app uses predefined searches and Dashboards that provide visibility into your environment for real-time analysis of overall usage.
Log types
The Sumo Logic App for Akamai Cloud Monitor assumes Akamai formatted logs, which provide one log message for each request.
For information about Akamai Cloud Monitor log formats, contact Akamai Support and request the document “Akamai Log Delivery User Guide.” Refer to “Appendix A: Log Formats and Examples."
Sample log messages
{
        "type": "cloud_monitor",
        "format": "default",
        "version": "1.0",
        "id": "dce9bc83ff6820435e6633e",
        "start": "1379543560.807",
        "cp": "180370",
        "message": {
            "proto": "http",
            "protoVer": "1.0",
            "status": "200",
            "cliIP": "109.31.186.162",
            "reqPort": "80",
            "reqHost": "www2.acmeco.com",
            "reqMethod": "GET",
            "reqPath": "/cart?display=full",
            "respCT": "",
            "respLen": "",
            "bytes": "",
            "UA": "Chrome/35.0.1916.153",
            "fwdHost": ""
    },
    "reqHdr": {
            "accEnc": "gzip",
            "conn": "Keep-Alive"
},
"respHdr": {
        "accRange": "bytes",
        "conn": "keep-alive",
        "contEnc": "gzip",
        "date": "2016-09-23 23:04:45.697 +0000",
        "eTag": "\"\"",
        "lastMod": "Mon,%2023%20Jan%202012%2001:44:17%20GMT",
        "server": "Apache/2.2.14%20(Ubuntu)",
        "cookie": "987597820765"
},
"netPerf": {
        "downloadTime": "1594",
        "netOriginLatency": "40",
        "originName": "down",
        "originIP": "",
        "originInitIP": "10.10.10.10",
        "originRetry": "0",
        "lastMileRTT": "43",
        "cacheStatus": "1",
        "firstByte": "1",
        "lastByte": "1",
        "asnum": "4812",
        "edgeIP": ""
},
"geo": {
        "country": "us",
        "region": "",
        "city": ""
},
"waf": {
        "logVer": ""
},
"ipRules": "",
"warnRules": "",
"denyRules": ""
}
Sample queries
_sourceCategory=akamai 50?
| parse "\"reqPath\":\"*\"" as path, "\"status\":\"*\"" as status
| urldecode(path) as path
| where status > 499
| where status < 600
| count as errors by path
| sort by errors
_sourceCategory=akamai cacheStatus
| parse "\"cacheStatus\":\"*\"" as status
| where !(status="")
| if(status="0", "0 - Non cacheable", if(status="1" OR status="2", "1/2 - Cache Hit", if(status="3", "3 - Cache Miss", ""))) as cachestatus
| count bycachestatus
_sourceCategory=akamai waf denyRules reqHost
| parse "\"denyRules\":\"*\"" as deny, "\"reqHost\":\"*\"" as host
| where deny != ""
| timeslice 1m
| count by host, _timeslice
| transpose row _timeslice column host
Collect Logs for Akamai Cloud Monitor
This procedure explains how to collect logs from Akamai Cloud Monitor and ingest them into Sumo Logic.
Enable Akamai Cloud Monitor
Akamai Cloud Monitor is the service that generates transactional information for your Akamai CDN. To enable Cloud Monitor in your Akamai environment, use the instructions at: https://techdocs.akamai.com/property-mgr/docs/cloud-monitor-instrumentation
Configure a Collector
In Sumo Logic, create a new Hosted Collector.
Configure a Source
- Configure an HTTP Source.
- Configure the Source Fields as follows:
- Name. Required. For example, use Akamai.
- Source Category. Required. For example, use akamai_cloud_monitor. (The Source Category metadata field is a fundamental building block to organize and label Sources. For details, see Best Practices.)
- Configure the Advanced section:
- Check Extract timestamp information from log file entries.
- Timezone. Use time zone from log file. If none is present, use UTC.
- Timestamp Format. Auto-Detected
- Encoding Type. UTF-8
- Enable Multiline Processing.
- Detect Messages Spanning Multiple Lines. False
- Multi Line Boundary. NA
- Click Save.
Save the URL endpoint that is generated for your HTTP Source. You will use it to configure Akamai.
Configure Akamai
- In Akamai, open the Luna Control center and navigate to the property you’d like to work with.
- Create a new version for the property and select it.
- Scroll down to the Property Manager Configuration section.
- Select Add Rule and choose Cloud Management.
- Add Cloud Monitor Instrumentation.
- Add the path from your Sumo Logic URL endpoint, generated from the HTTP Source, in the Delivery URL Path section. It should start with
/receiver/v1/http/<your unique endpoint>. - Return to the screen where you can see your main property and add a new property.
- Make sure to apply your TLS certificate so it can handle HTTPS traffic.
- Set the origin server as the server from your Sumo Logic URL endpoint.
- Set the HTTPS port to
443.
Field Extraction Rules
Field Extraction Rules (FERs) tell Sumo Logic which fields to parse out automatically. For instructions, see Create a Field Extraction Rule.
- Classic UI. In the main Sumo Logic menu, select Manage Data > Logs > Field Extraction Rules.
New UI. In the top menu select Configuration, and then under Logs select Field Extraction Rules. You can also click the Go To... menu at the top of the screen and select Field Extraction Rules. - Click Add.
- Configure the following fields:
- Rule Name. Required (for example, Akamai Cloud Monitor).
- Scope. Use the Source Category you created for your HTTP Source (for example, akamai_cloud_monitor).
- Parse Expression. Select the template Akamai Cloud Monitor and click Use Template. The full parse statement is below.
- Click Add.
parse "\"reqMethod\":\"*\"" as method, "\"status\":\"*\"" as status, "\"fwdHost\":\"*\"" as origin
| parse "\"bytes\":\"*\"" as bytes, "\"edgeIP\":\"*\"" as edgeip, "\"country\":\"*\"" as country, "\"cookie\":\"*\"" as cookie
Installing the Akamai Cloud Monitor app
Now that you have configured Akamai logs, install the Sumo Logic App for Akamai Cloud Monitor to take advantage of the pre-configured searches and dashboards to analyze your Akamai data.
To install the app, do the following:
Next-Gen App: To install or update the app, you must be an account administrator or a user with Manage Apps, Manage Monitors, Manage Fields, Manage Metric Rules, and Manage Collectors capabilities depending upon the different content types part of the app.
- Select App Catalog.
- In the 🔎 Search Apps field, run a search for your desired app, then select it.
- Click Install App.
note
Sometimes this button says Add Integration.
- Click Next in the Setup Data section.
- In the Configure section of your respective app, complete the following fields.
- Field Name. If you already have collectors and sources set up, select the configured metadata field name (eg _sourcecategory) or specify other custom metadata (eg: _collector) along with its metadata Field Value.
- Click Next. You will be redirected to the Preview & Done section.
Post-installation
Once your app is installed, it will appear in your Installed Apps folder, and dashboard panels will start to fill automatically.
Each panel slowly fills with data matching the time range query received since the panel was created. Results will not immediately be available but will be updated with full graphs and charts over time.
Viewing Akamai Cloud Monitor dashboards
All dashboards have a set of filters that you can apply to the entire dashboard. Use these filters to drill down and examine the data to a granular level.
- You can change the time range for a dashboard or panel by selecting a predefined interval from a drop-down list, choosing a recently used time range, or specifying custom dates and times. Learn more.
- You can use template variables to drill down and examine the data on a granular level. For more information, see Filtering Dashboards with Template Variables.
- Most Next-Gen apps allow you to provide the scope at the installation time and are comprised of a key (
_sourceCategoryby default) and a default value for this key. Based on your input, the app dashboards will be parameterized with a dashboard variable, allowing you to change the dataset queried by all panels. This eliminates the need to create multiple copies of the same dashboard with different queries.
Overview

Map (Unique Visitors). Performs a geo lookup operation and displays the number of visitors to your site and their locations on a map of the world by IP address over the last 15 minutes.
Download Performance Hotspots - Average Download Above 300 by Country. Uses a geo lookup operation to display performance download time hotspots on a map of the world by IP addresses, which allows you to see a count of hits per location for the last hour.
Countries. Displays the originating country of visitors to your site by IP address over the last three hours in a pie chart. Hover over a section of the pie chart to display more details.
Top 404-Causing URLs. Displays the top 25 URLs that have produced a 404 error in the last 15 minutes and counts the errors in a bar chart.
Top Error-Causing URLs. Displays the URLs that have produced the most errors in the last 15 minutes and counts the errors in a bar chart.
Origin Performance
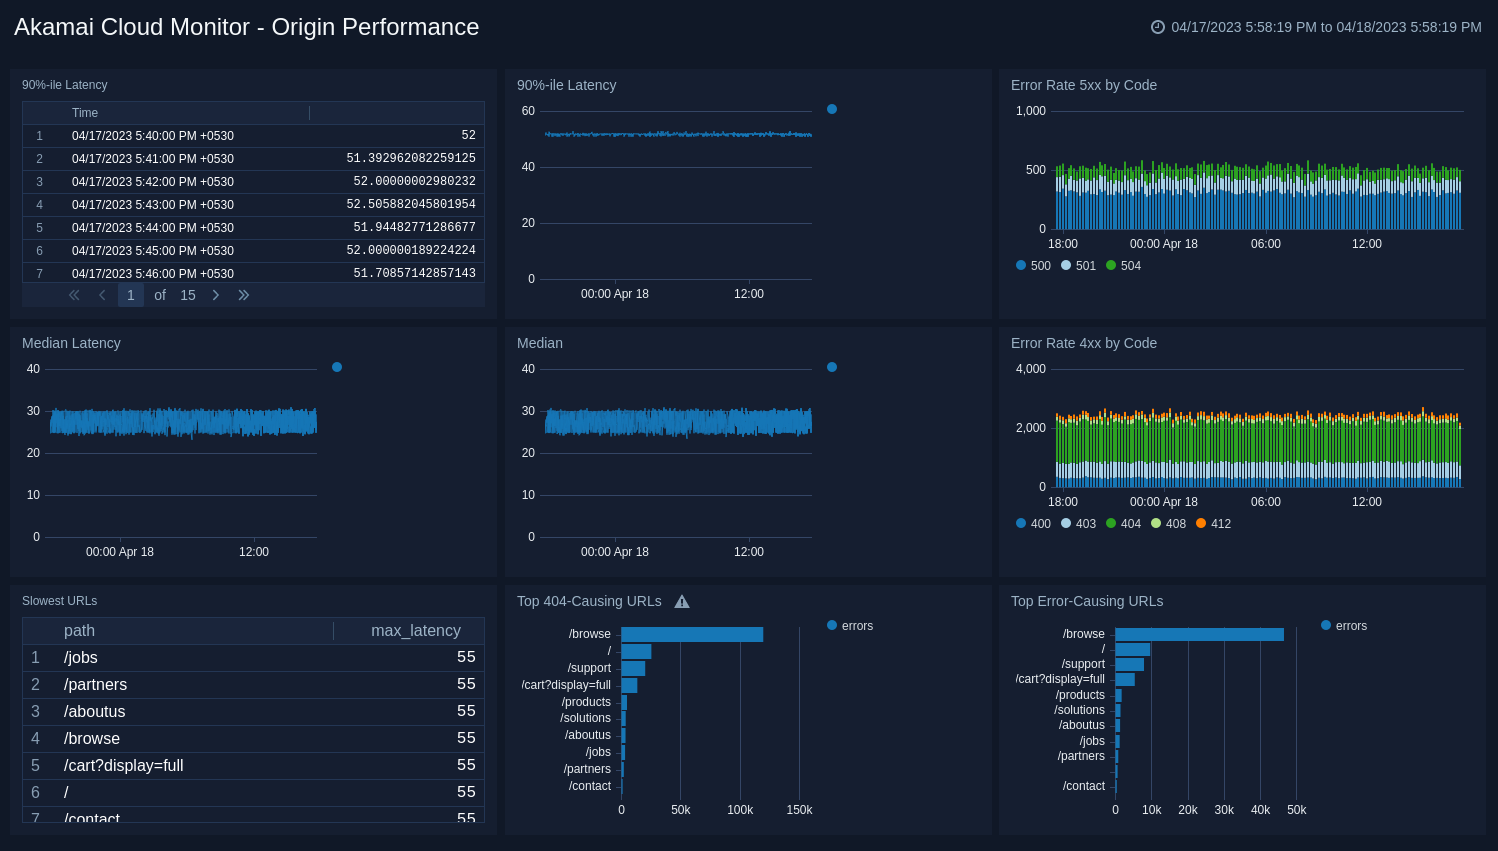
90%-ile Latency. Displays the 90th percentile of the origin response time latency as an aggregation table for the last hour.
Median Latency. Shows the median of the origin response time latency as a line chart on a timeline for the last 3 hours, using timeslices of one minute.
Slowest URLs. Lists the top 10 slowest URLs, including the path and the maximum latency metric for the last 3 hours, in a line chart.
90%-ile Latency. Displays the 90th percentile of the data center response time latency as a line chart on a timeline for the last hour, using timeslices of one minute.
Median. Shows the median of the data center response time latency as a line chart on a timeline for the last hour, using timeslices of one minute.
Top 404-Causing URLs. Displays the top 25 URLs that have produced a 404 error in the last 15 minutes and counts the errors in a bar chart.
Error Rate 5xx by Code. Shows the number of 5xx error events by code in a stacked column chart on a timeline using timeslices of 10 minutes for the past 24 hours.
Error Rate 4xx by Code. Displays the number of 4xx error events by code in a stacked column chart on a timeline using timeslices of 10 minutes for the past 24 hours.
Top Error-Causing URLs. Displays the URLs that have produced the most errors in the last 15 minutes and counts the errors in a bar chart.
Quality of Service
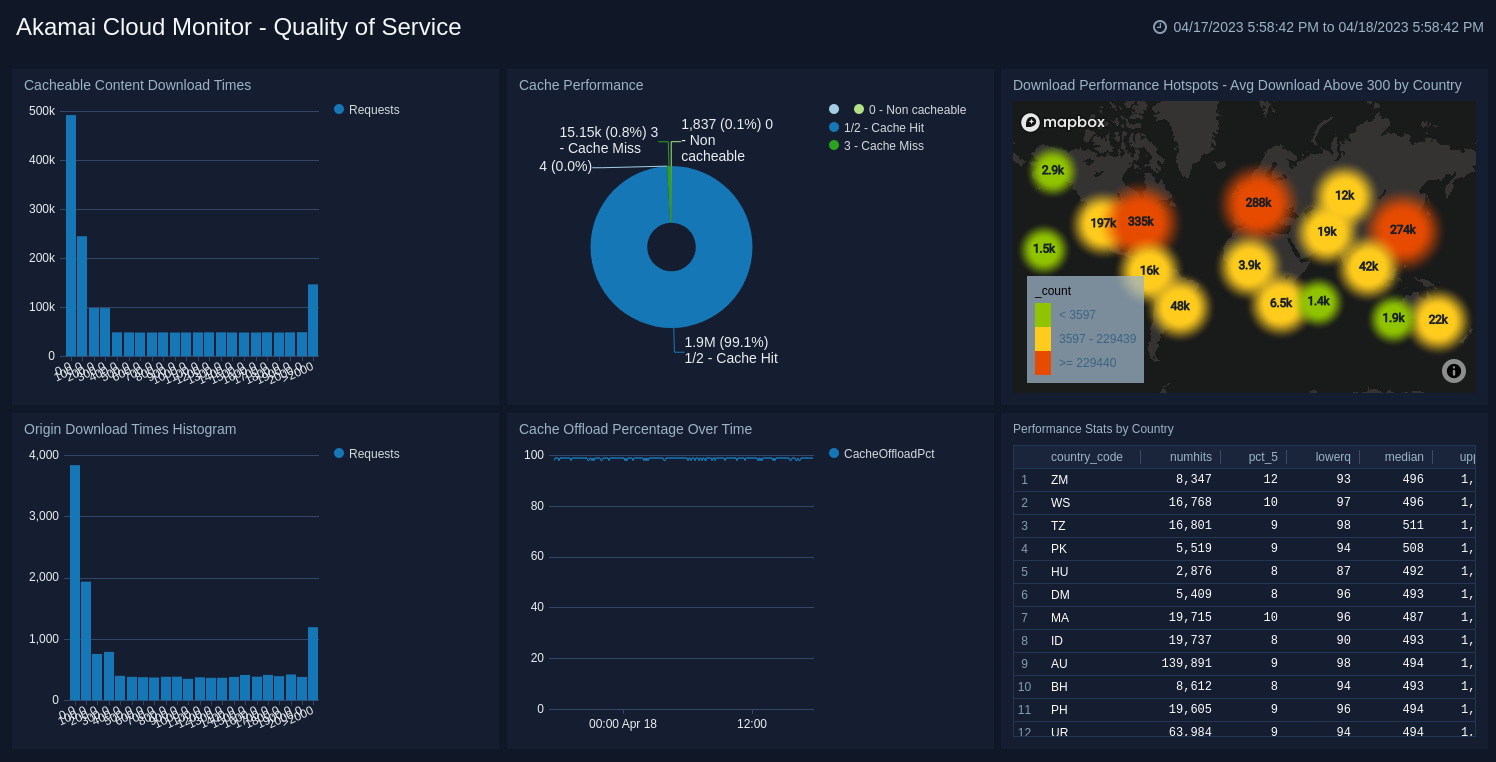
Cached Content Download Times. Shows download times for cached content for the number of requests and the response time in a column chart for the last hour.
Origin Download Times Histogram. Displays download times for origin content for the number of requests and the response time in a column chart for the last hour.
Cache Performance. Provides the cache performance by status as a pie chart for the last hour.
Cache Offload Percentage Overtime. Displays the cache offload percentage overtime in a line chart on a timeline for the last hour.
Download Performance Hotspots - Average Download Above 300 by Country. Uses a geo lookup operation to display performance download time hotspots on a map of the world by IP addresses, which allows you to see a count of hits per location for the last hour.
Performance Stats by Country. Provides an aggregation table of performance statistics by IP address per country code for the last hour.
Security
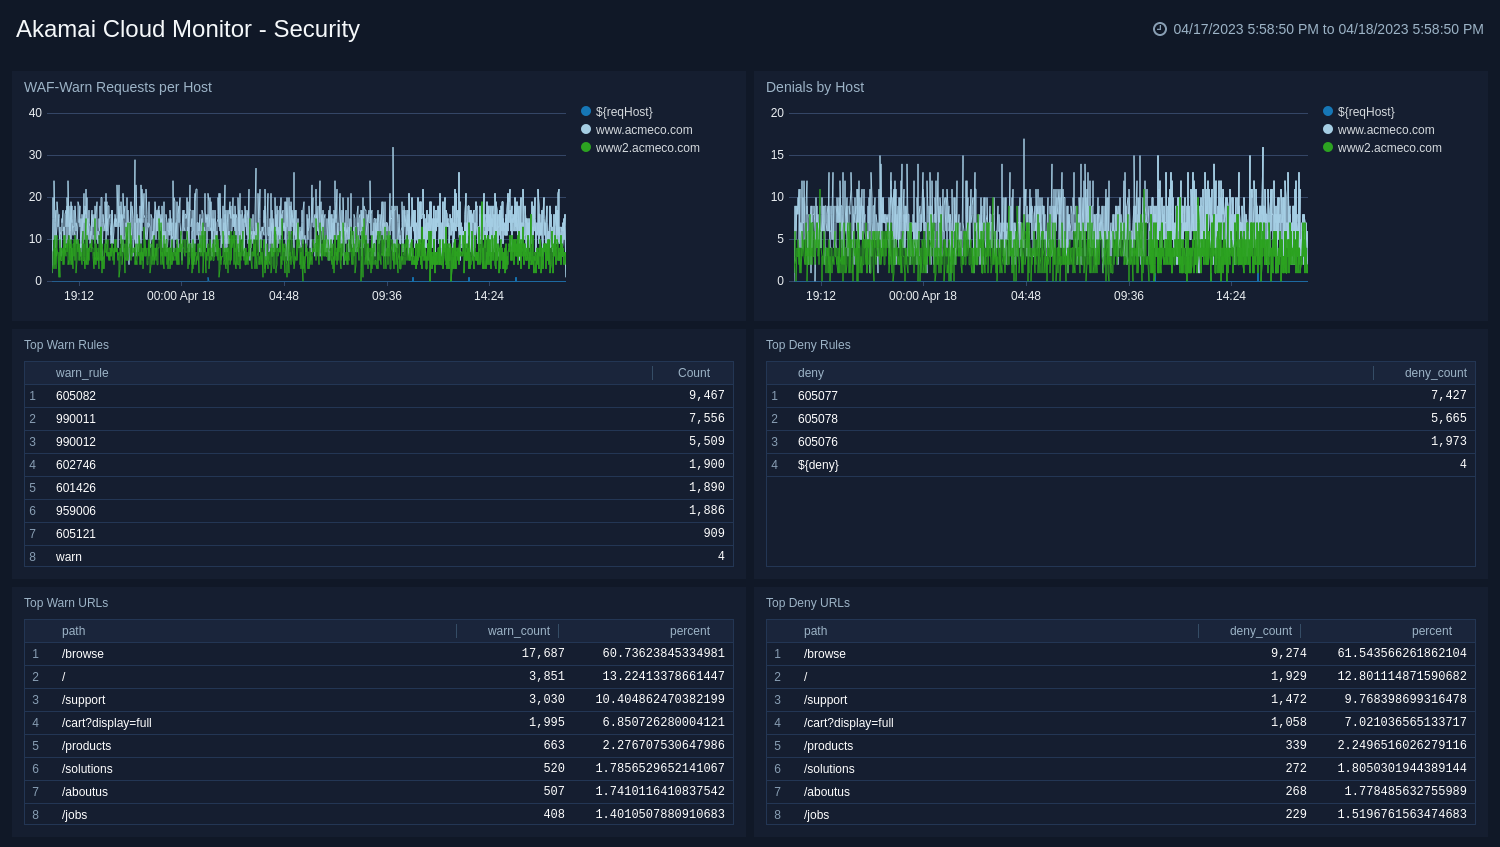
WAF-Warn Requests per Host. Displays a count of WAF warning requests per host in a stacked column chart on a timeline using timeslices of one minute for the last hour.
Top Warn Rules. Lists the top warning rules in an aggregation table by rule and count for the last hour.
Top Warn URLs. Lists the top 10 URLs with the most warnings in an aggregation table by path, count, and percentage for the last hour.
Denials by Host. Displays WAF denials by host in a line chart on a timeline using timeslices of one minute for the last hour.
Top Deny Rules. Lists the top denial rules in an aggregation table by rule and count for the last hour.
Top Deny URLs. Lists the top 10 URLs with the most denials in an aggregation table by path, count, and percentage for the last hour.
Visitors
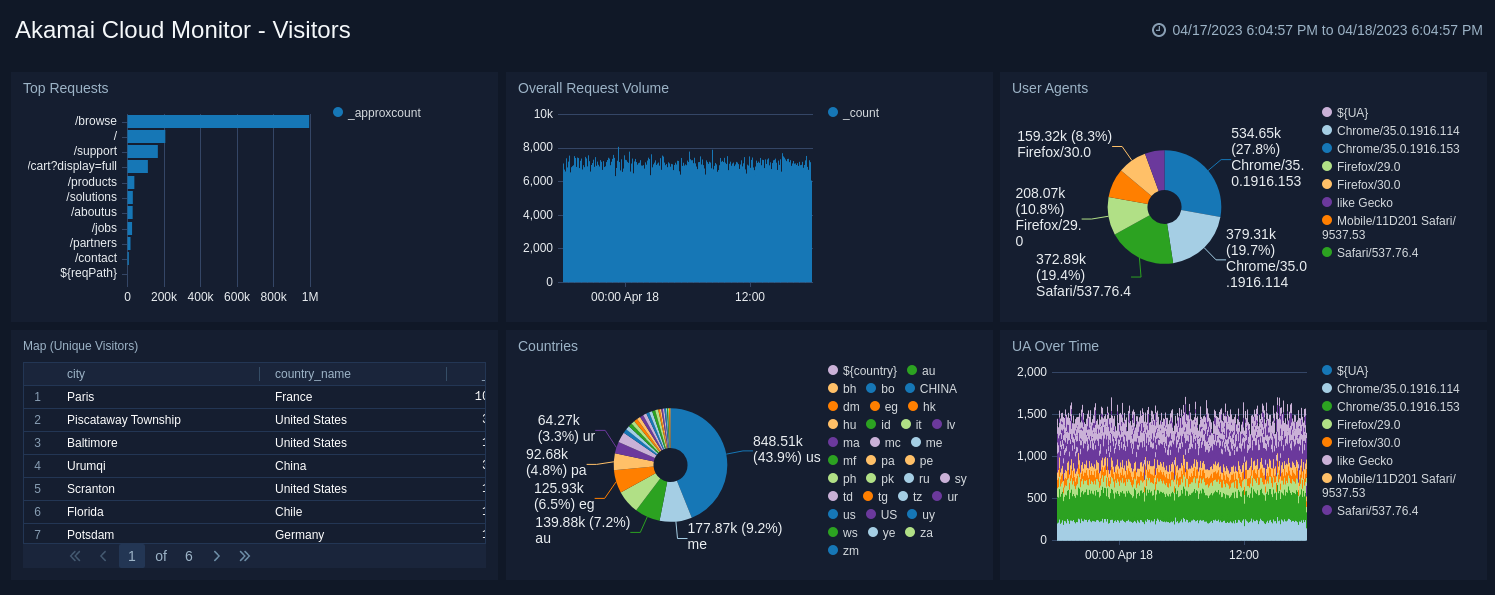
Top Requests. Displays the top requests by path and count in a bar chart for the last hour.
Map (Unique Visitors). Performs a geo lookup operation and displays the number of visitors to your site and their locations on a map of the world by IP address over the last 15 minutes.
Overall Request Volume. Shows the number of requests made in a column chart on a timeline using timeslices of five minutes over the last three hours.
Countries. Displays the originating country of visitors to your site by IP address over the last three hours in a pie chart. Hover over a section of the pie chart to display more details.
User Agents. Show the agents used by visitors to your site as a pie chart for the past 15 minutes.
UA Over Time. Displays user agents used by visitors as a stacked column chart over a timeline using timeslices of one minute for the last 15 minutes.
Web Application Firewall - Attacks
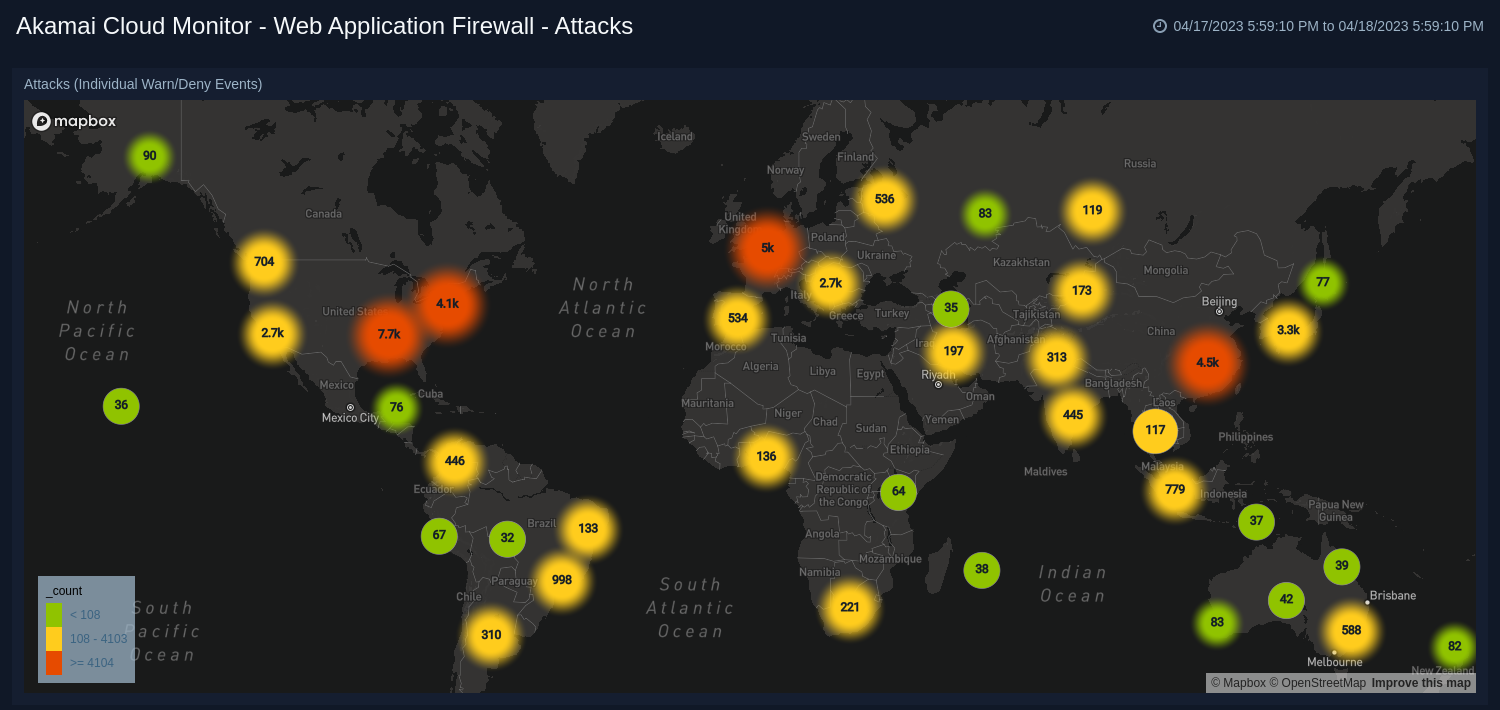
Attacks (Individual Warn/Deny Events). Uses a geo lookup operator to provide information on individual warn and deny events by IP address for the last hour and displays them on a map of the world.
Upgrade/Downgrade the Akamai Cloud Monitor app (Optional)
To update the app, do the following:
Next-Gen App: To install or update the app, you must be an account administrator or a user with Manage Apps, Manage Monitors, Manage Fields, Manage Metric Rules, and Manage Collectors capabilities depending upon the different content types part of the app.
- Select App Catalog.
- In the Search Apps field, search for and then select your app.
Optionally, you can identify apps that can be upgraded in the Upgrade available section. - To upgrade the app, select Upgrade from the Manage dropdown.
- If the upgrade does not have any configuration or property changes, you will be redirected to the Preview & Done section.
- If the upgrade has any configuration or property changes, you will be redirected to the Setup Data page.
- In the Configure section of your respective app, complete the following fields.
- Field Name. If you already have collectors and sources set up, select the configured metadata field name (eg _sourcecategory) or specify other custom metadata (eg: _collector) along with its metadata Field Value.
- Click Next. You will be redirected to the Preview & Done section.
Post-update
Your upgraded app will be installed in the Installed Apps folder and dashboard panels will start to fill automatically.
See our Release Notes changelog for new updates in the app.
To revert the app to a previous version, do the following:
- Select App Catalog.
- In the Search Apps field, search for and then select your app.
- To version down the app, select Revert to < previous version of your app > from the Manage dropdown.
Uninstalling the Akamai Cloud Monitor app (Optional)
To uninstall the app, do the following:
- Select App Catalog.
- In the 🔎 Search Apps field, run a search for your desired app, then select it.
- Click Uninstall.