Akamai DataStream

The Sumo Logic App for Akamai DataStream is designed to monitor and analyze the performance of your Akamai Edge server, and request handling pipeline. It helps to identify any issues that may be impacting your users' experience. This app is tailored to work with the logs generated by Akamai DataStream 2, which include valuable information about each request, such as the request path, status code, response time, and more.
Akamai DataStream app provides pre-built queries that allow you to analyze your logs by various parameters, including response time, status code, request path, and more. In addition, this app includes dashboards that allow you to visualize your log data to easily understand the trends and patterns. You can also use these dashboards to monitor key metrics, such as request volume, response time, and error rate, which assists you in identifying any anomalies or issues.
Log types
This App uses Akamai Source to collect DataStream 2 Logs for Akamai DataStream.
Sample log messages
{
  "version": 1,
  "streamId": "12345",
  "cp": "123456",
  "reqId": "1239f220",
  "reqTimeSec": "1573840000",
  "bytes": "4995",
  "cliIP": "128.147.28.68",
  "statusCode": "206",
  "proto": "HTTPS",
  "reqHost": "test.hostname.net",
  "reqMethod": "GET",
  "reqPath": "/path1/path2/file.ext",
  "reqPort": "443",
  "rspContentLen": "5000",
  "rspContentType": "text/html",
  "UA": "Mozilla%2F5.0+%28Macintosh%3B+Intel+Mac+OS+X+10_14_3%29",
  "tlsOverheadTimeMSec": "0",
  "tlsVersion": "TLSv1",
  "objSize": "484",
  "uncompressedSize": "484",
  "overheadBytes": "232",
  "totalBytes": "0",
  "queryStr": "param=value",
  "breadcrumbs": "//BC/%5Ba=23.33.41.20,c=g,k=0,l=1%5D",
  "accLang": "en-US",
  "cookie": "cookie-content",
  "range": "37334-42356",
  "referer": "https%3A%2F%2Ftest.referrer.net%2Fen-US%2Fdocs%2FWeb%2Ftest",
  "xForwardedFor": "8.47.28.38",
  "maxAgeSec": "3600",
  "reqEndTimeMSec": "3",
  "errorCode": "ERR_ACCESS_DENIED|fwd_acl",
  "turnAroundTimeMSec": "11",
  "transferTimeMSec": "125",
  "dnsLookupTimeMSec": "50",
  "lastByte": "1",
  "edgeIP": "23.50.51.173",
  "country": "IN",
  "state": "Virginia",
  "city": "HERNDON",
  "serverCountry": "SG",
  "billingRegion": "8",
  "cacheStatus": "1",
  "securityRules": "ULnR_28976|3900000:3900001:3900005:3900006:BOT-ANOMALY-HEADER|",
  "ewUsageInfo": "//4380/4.0/1/-/0/4/#1,2\\//4380/4.0/4/-/0/4/#0,0\\//4380/4.0/5/-/1/1/#0,0",
  "ewExecutionInfo": "c:4380:7:161:162:161:n:::12473:200|C:4380:3:0:4:0:n:::6967:200|R:4380:20:99:99:1:n:::35982:200",
  "customField": "any-custom-value"
}
Sample queries
_sourceCategory="akamai"
| json "version", "streamId", "cp", "reqId", "reqTimeSec", "bytes", "cliIP", "statusCode", "proto", "reqHost", "reqMethod", "reqPath", "reqPort", "rspContentLen", "rspContentType", "UA", "tlsOverheadTimeMSec", "tlsVersion", "objSize", "uncompressedSize", "overheadBytes", "totalBytes", "queryStr", "breadcrumbs", "accLang", "cookie", "range", "referer", "xForwardedFor", "maxAgeSec", "reqEndTimeMSec", "errorCode", "turnAroundTimeMSec", "transferTimeMSec", "dnsLookupTimeMSec", "lastByte", "edgeIP", "country", "state", "city", "serverCountry", "billingRegion", "cacheStatus", "securityRules", "ewUsageInfo", "ewExecutionInfo", "customField" as  version, streamId, cp, reqId, reqTimeSec, bytes, cliIP, statusCode, proto, reqHost, reqMethod, reqPath, reqPort, rspContentLen, rspContentType, UA, tlsOverheadTimeMSec, tlsVersion, objSize, uncompressedSize, overheadBytes, totalBytes, queryStr, breadcrumbs, accLang, cookie, range, referer, xForwardedFor, maxAgeSec, reqEndTimeMSec, errorCode, turnAroundTimeMSec, transferTimeMSec, dnsLookupTimeMSec, lastByte, edgeIP, country, state, city, serverCountry, billingRegion, cacheStatus, securityRules, ewUsageInfo, ewExecutionInfo, customField
Setup Collection
Follow the instructions for setting up Integration for Akamai DataStream 2 source and use the same source category while installing the app.
Installing the Akamai DataStream app
Now that you have configured Akamai DataStream 2 logs, install the Sumo Logic App for Akamai DataStream to take advantage of the pre-configured searches and dashboards.
To install the app, do the following:
Next-Gen App: To install or update the app, you must be an account administrator or a user with Manage Apps, Manage Monitors, Manage Fields, Manage Metric Rules, and Manage Collectors capabilities depending upon the different content types part of the app.
- Select App Catalog.
- In the 🔎 Search Apps field, run a search for your desired app, then select it.
- Click Install App.
note
Sometimes this button says Add Integration.
- Click Next in the Setup Data section.
- In the Configure section of your respective app, complete the following fields.
- Field Name. If you already have collectors and sources set up, select the configured metadata field name (eg _sourcecategory) or specify other custom metadata (eg: _collector) along with its metadata Field Value.
- Click Next. You will be redirected to the Preview & Done section.
Post-installation
Once your app is installed, it will appear in your Installed Apps folder, and dashboard panels will start to fill automatically.
Each panel slowly fills with data matching the time range query received since the panel was created. Results will not immediately be available but will be updated with full graphs and charts over time.
Viewing Akamai DataStream dashboards
All dashboards have a set of filters that you can apply to the entire dashboard. Use these filters to drill down and examine the data to a granular level.
- You can change the time range for a dashboard or panel by selecting a predefined interval from a drop-down list, choosing a recently used time range, or specifying custom dates and times. Learn more.
- You can use template variables to drill down and examine the data on a granular level. For more information, see Filtering Dashboards with Template Variables.
- Most Next-Gen apps allow you to provide the scope at the installation time and are comprised of a key (
_sourceCategoryby default) and a default value for this key. Based on your input, the app dashboards will be parameterized with a dashboard variable, allowing you to change the dataset queried by all panels. This eliminates the need to create multiple copies of the same dashboard with different queries.
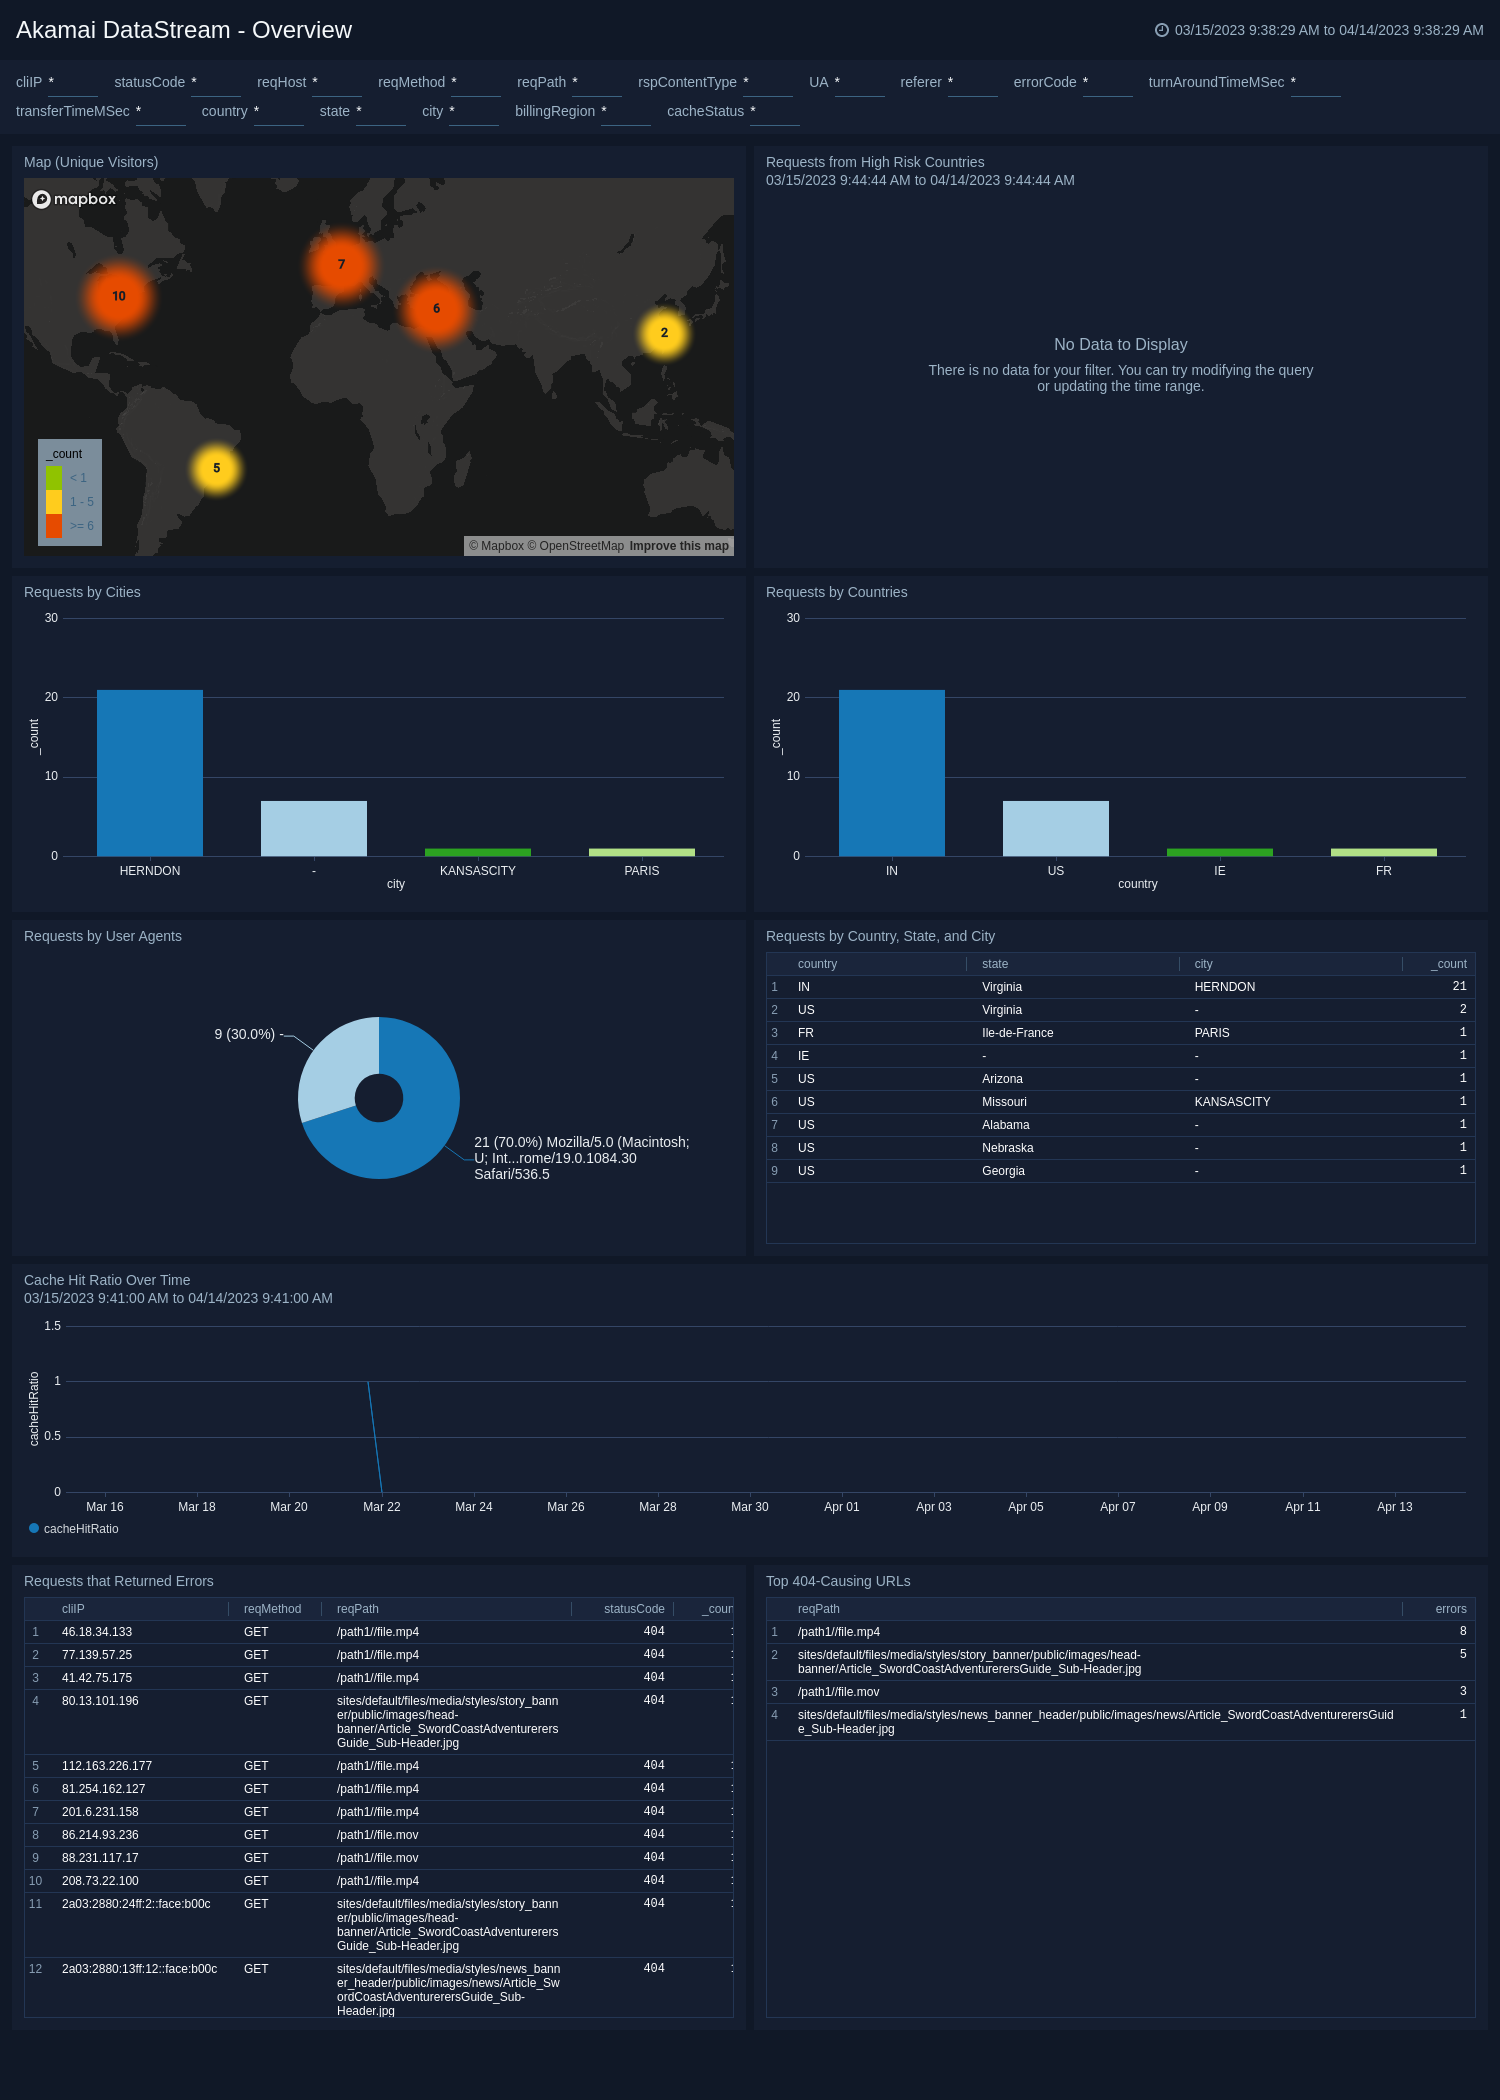
Overview
The Akamai DataStream - Overview dashboard displays the geo location of requests, requests from risky locations, cache hit ratio trend, URLs causing issues, and user agent breakdown.
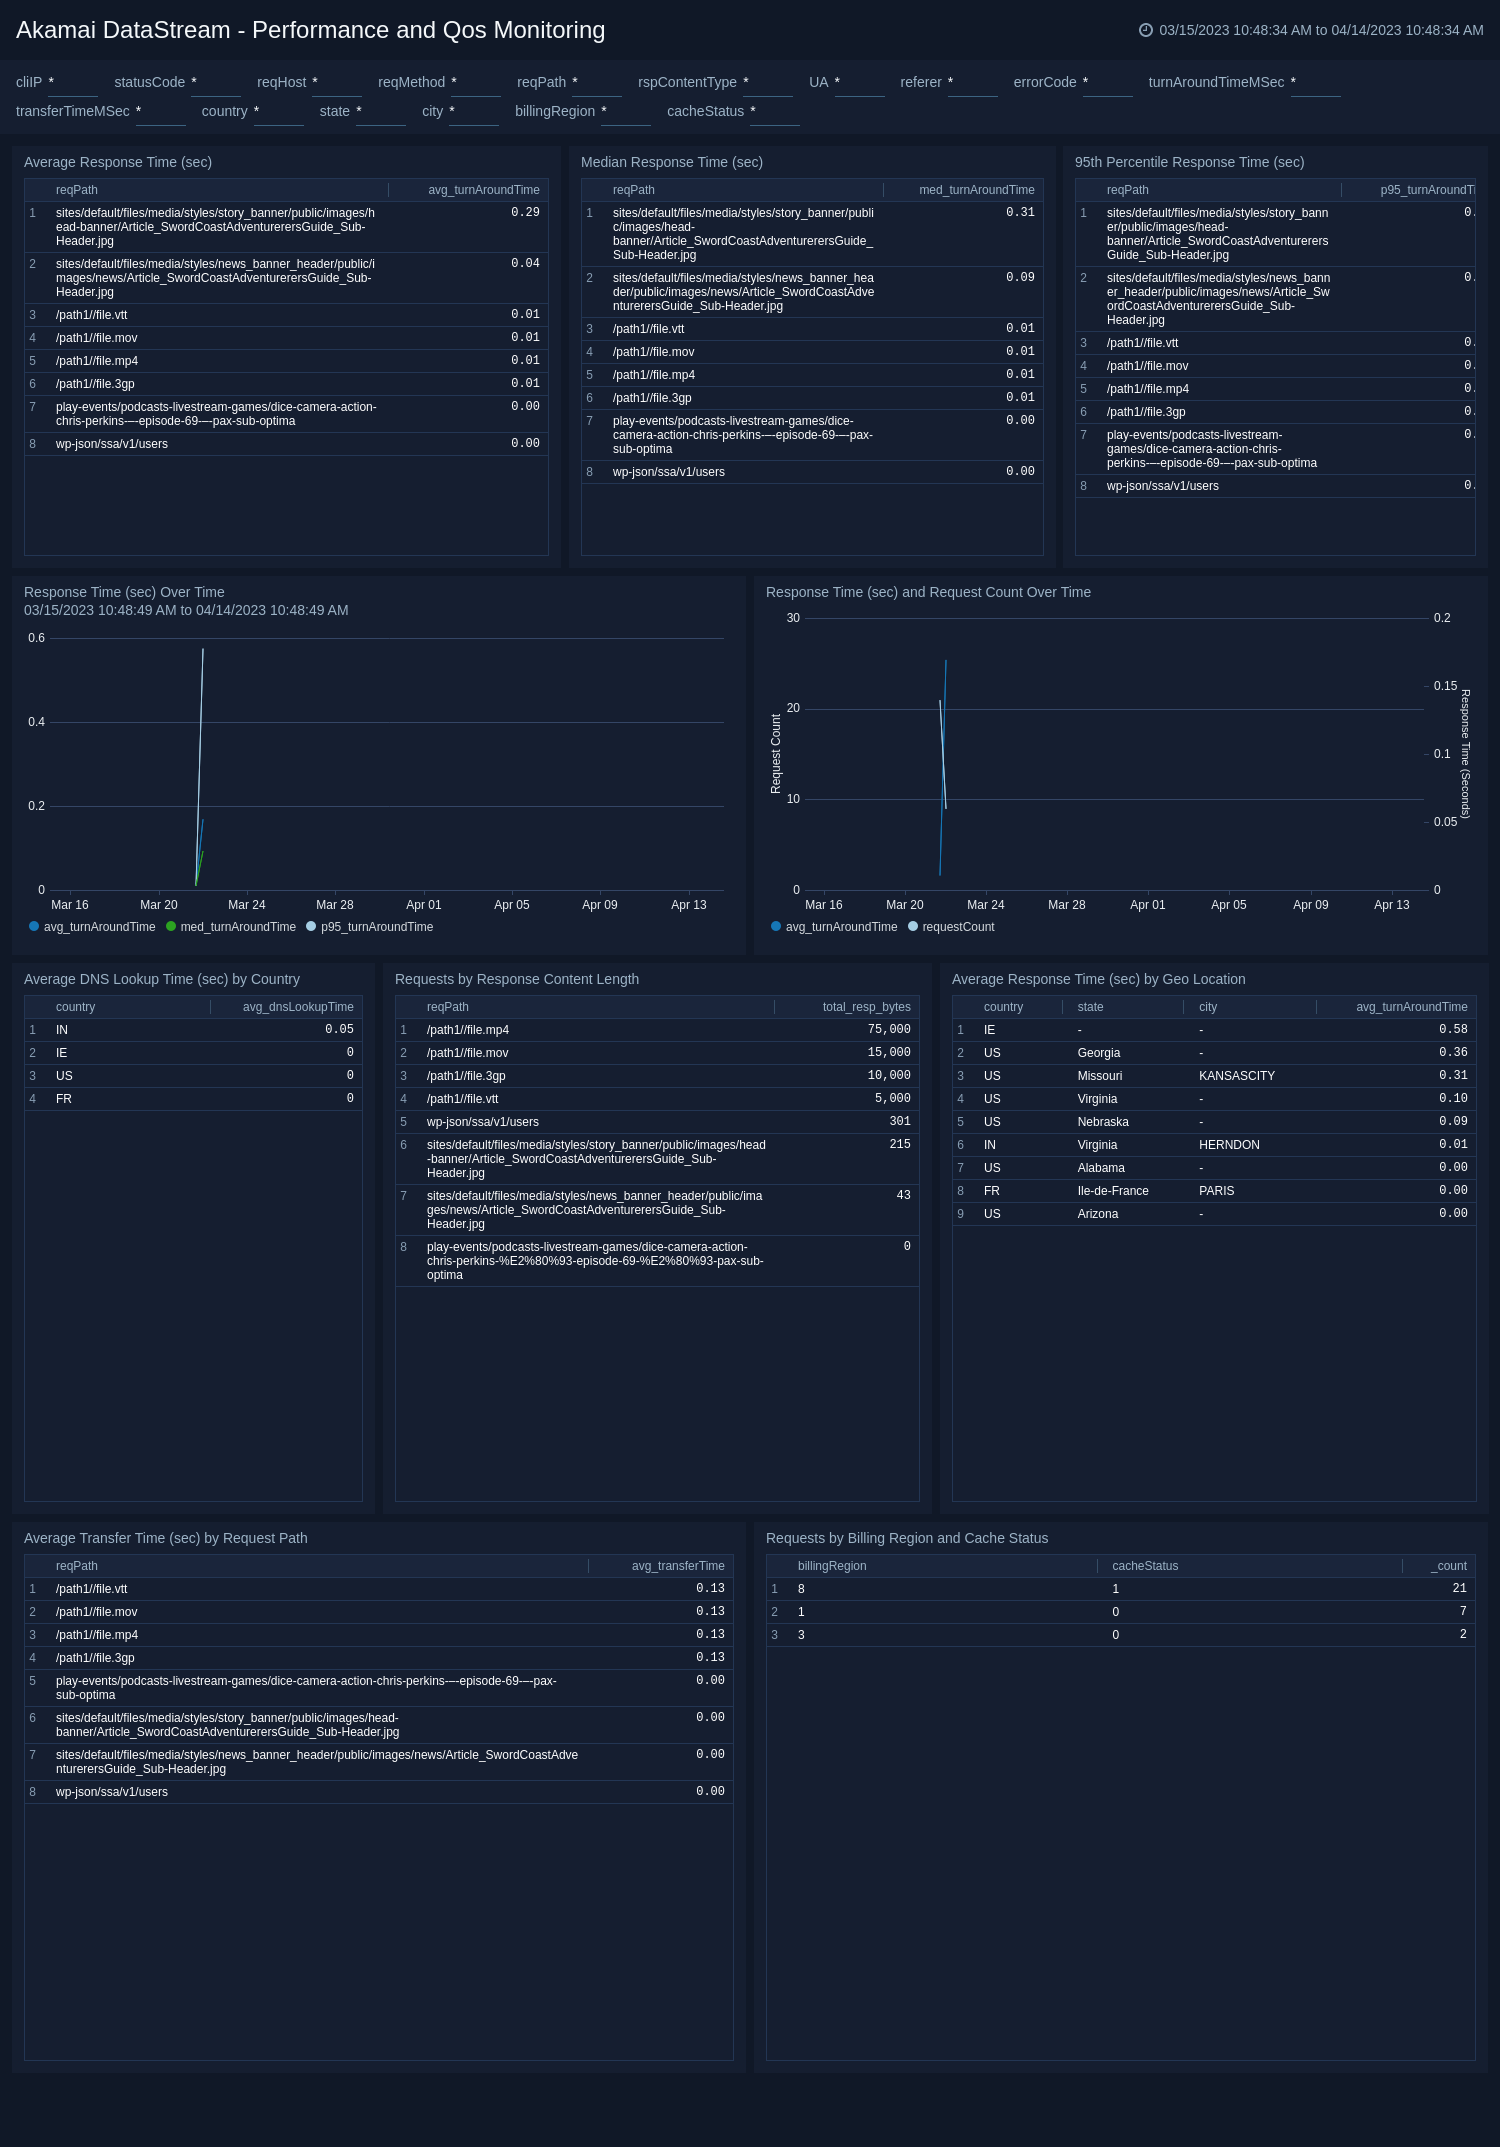
Performance and Qos Monitoring
The Akamai DataStream - Performance and Qos Monitoring dashboard analyze response time and provides analysis between response time and requests, DNS lookup delay by geolocations, and shows transfer time by the requested path.
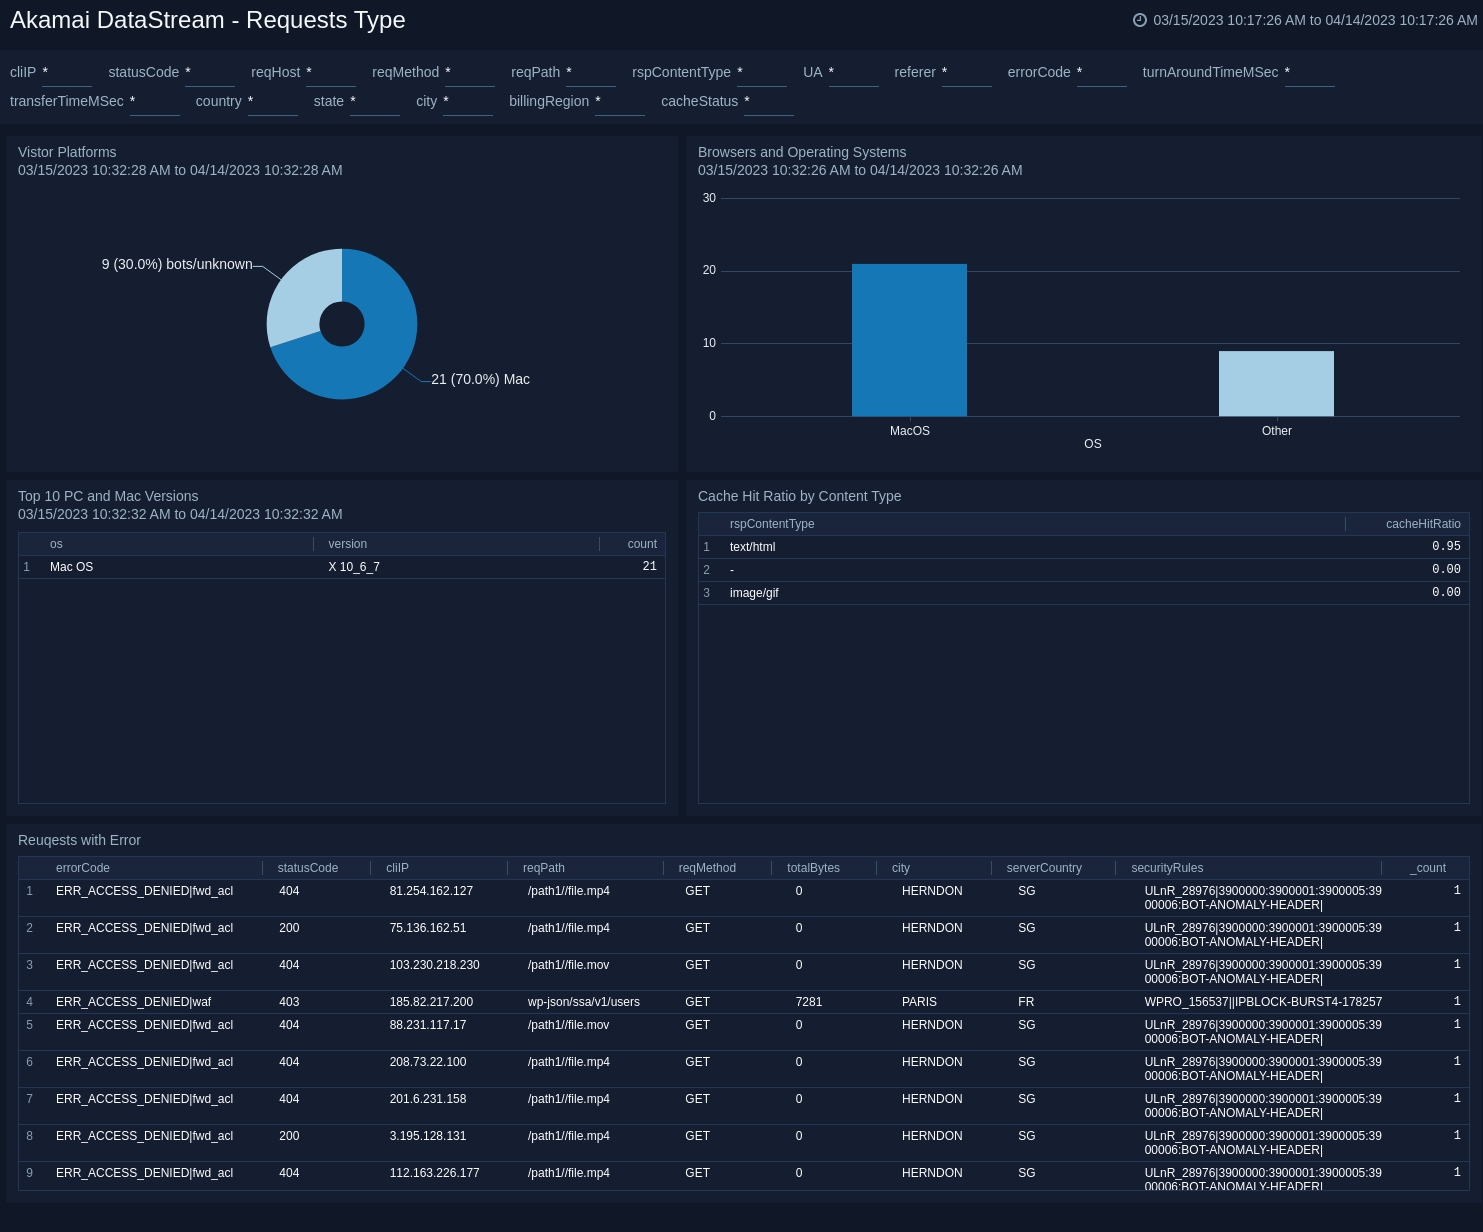
Requests Type
The Akamai DataStream - Requests Type dashboard provides details about visitor platforms, breakdown of browsers and OS, cache hit ratio by content type, and requests with errors.
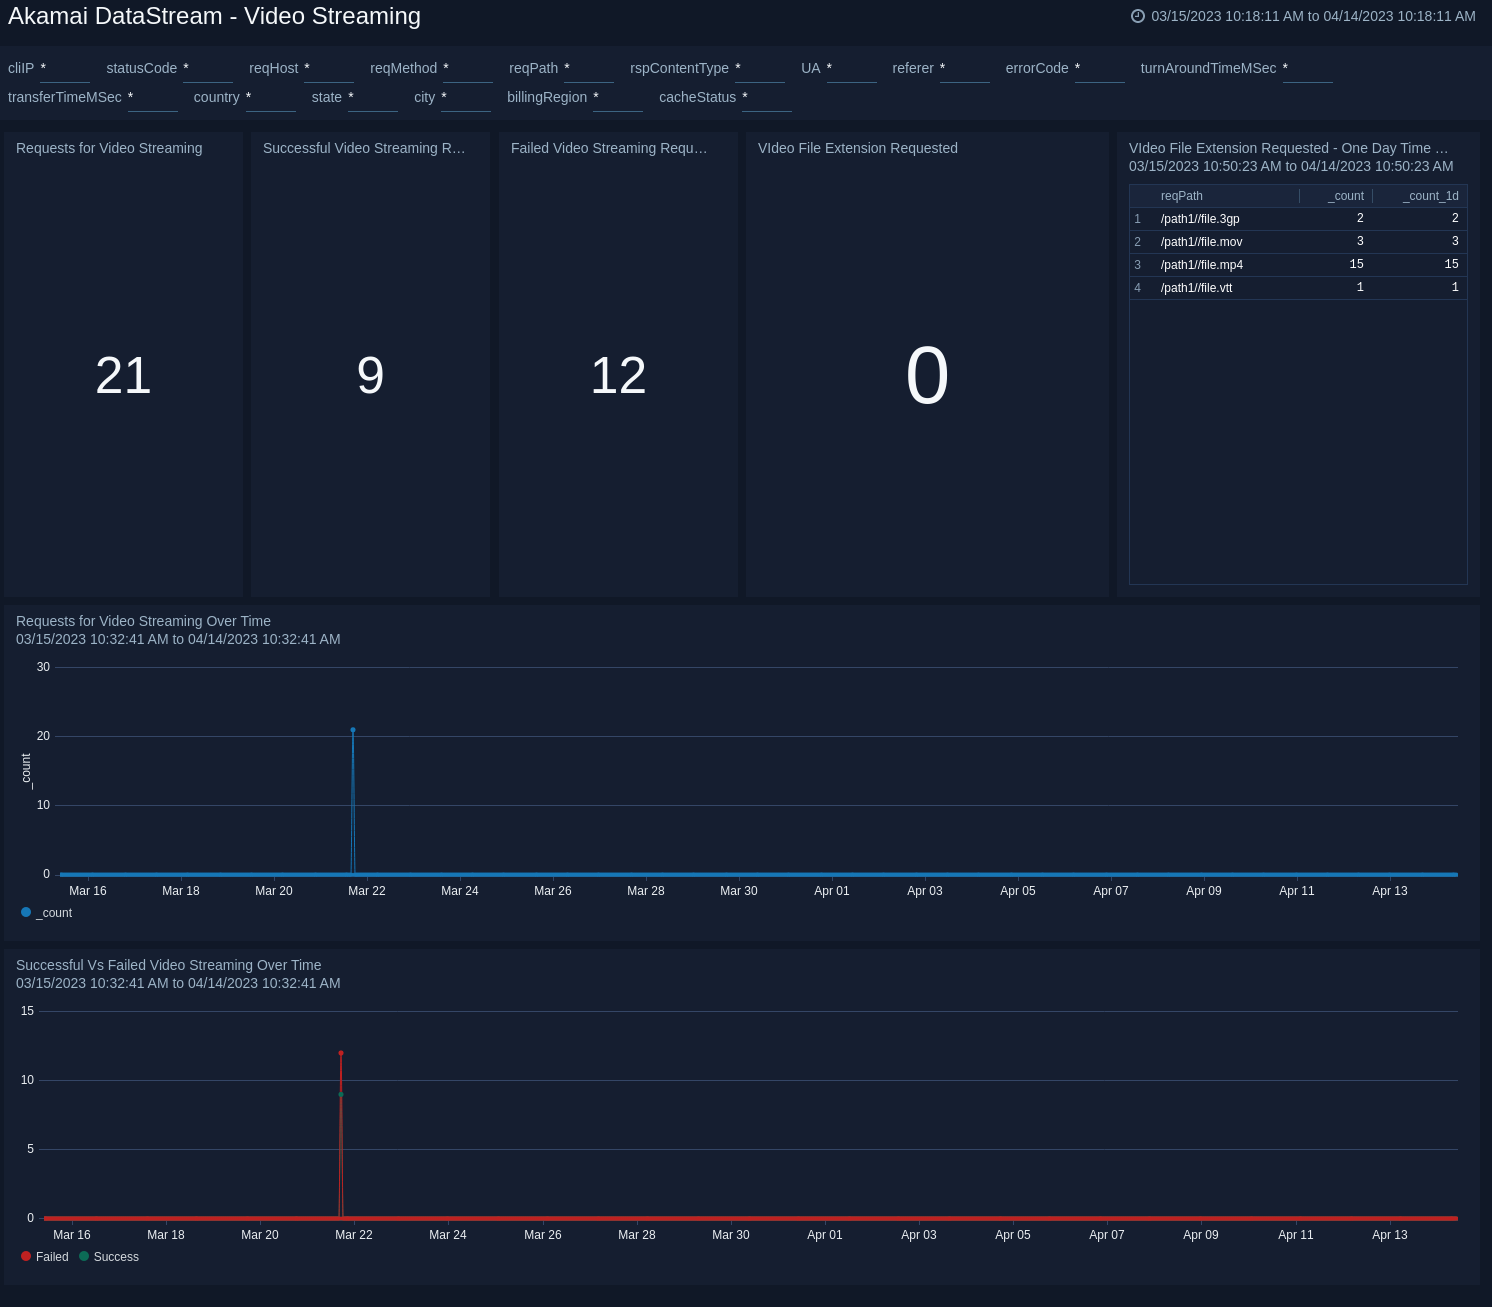
Akamai DataStream - Video Streaming
The Akamai DataStream - Video Streaming dashboard displays details related to video streaming requests, and analyzes failed vs successful video streaming requests over time.
Upgrade/Downgrade the Akamai DataStream app (Optional)
To update the app, do the following:
Next-Gen App: To install or update the app, you must be an account administrator or a user with Manage Apps, Manage Monitors, Manage Fields, Manage Metric Rules, and Manage Collectors capabilities depending upon the different content types part of the app.
- Select App Catalog.
- In the Search Apps field, search for and then select your app.
Optionally, you can identify apps that can be upgraded in the Upgrade available section. - To upgrade the app, select Upgrade from the Manage dropdown.
- If the upgrade does not have any configuration or property changes, you will be redirected to the Preview & Done section.
- If the upgrade has any configuration or property changes, you will be redirected to the Setup Data page.
- In the Configure section of your respective app, complete the following fields.
- Field Name. If you already have collectors and sources set up, select the configured metadata field name (eg _sourcecategory) or specify other custom metadata (eg: _collector) along with its metadata Field Value.
- Click Next. You will be redirected to the Preview & Done section.
Post-update
Your upgraded app will be installed in the Installed Apps folder and dashboard panels will start to fill automatically.
See our Release Notes changelog for new updates in the app.
To revert the app to a previous version, do the following:
- Select App Catalog.
- In the Search Apps field, search for and then select your app.
- To version down the app, select Revert to < previous version of your app > from the Manage dropdown.
Uninstalling the Akamai DataStream app (Optional)
To uninstall the app, do the following:
- Select App Catalog.
- In the 🔎 Search Apps field, run a search for your desired app, then select it.
- Click Uninstall.