Armis
The Sumo Logic App for Armis offers enhanced visibility into both alerts and device data, making it easier to monitor and manage your device security. The app features dashboards that analyze alerts by severity, status, and type, providing a clear picture of the trend of alerts over time. Additionally, the app allows you to monitor devices by risk level, type, and category, and provides a table view of the latest devices with key information to keep your IT infrastructure secure.
Log types
The Sumo Logic App for Armis gathers log information from the following two sources.
Alerts. These are notifications or warnings generated when a potential security threat is detected. The alerts provide information about the type of threat, its severity, and other relevant details.
| Path | Type | Description |
|---|---|---|
activityIds | Number | The activity IDs of the alert. |
activityUUIDs | String | The activity UUIDs of the alert. |
alertId | Number | The ID of the alert. |
connectionIds | Number | The connection IDs of the alert. |
description | String | A text description of the alert. |
deviceIds | Number | The device IDs of the alert. |
severity | String | The severity of the alert. |
status | String | The status of the alert. |
time | Date | The date and time the alert occurred. |
title | String | The title of the alert. |
type | String | The type of the alert. |
Device. These logs are generated by the devices being managed by Armis and contain information about device activity, configuration changes, and other relevant details. The device logs help in understanding device behavior and assist in troubleshooting.
| Path | Type | Description |
|---|---|---|
accessSwitch | String | The access switch of the device. |
category | String | The category of the device. |
firstSeen | Date | The first time the device was seen. |
id | Number | The ID of the device. |
ipaddress | String | The IP address of the device. |
ipv6 | String | The IPv6 address of the device. |
lastSeen | Date | The last time the device was seen. |
macAddress | String | The MAC address of the device. |
manufacturer | String | The manufacturer of the device. |
model | String | The model of the device. |
name | String | The name of the device. |
operatingSystem | String | The operating system of the device. |
operatingSystemVersion | String | The operating system version of the device. |
purdueLevel | String | The purdue level of the device. |
riskLevel | String | The risk level of the device. |
sensor | String | The sensor of the device. |
site | String | The site of the device. |
Sample log messages
This section contains log messages for both Alerts and Device sources. It helps in monitoring activity and resolving issues.
{
 "data": {
   "count": 10,
   "next": 10,
   "prev": null,
   "results": [
     {
       "activityUUIDs": [
         "zXBTUoUBAAAAAF_2V6Ae"
       ],
       "alertId": 124,
       "connectionIds": [

       ],
       "description": "The Armis security platform has detected a violation of a policy and generated an alert.",
       "deviceIds": [
         83
       ],
       "severity": "Medium",
       "status": "Unhandled",
       "time": "2022-12-27T06:44:31.638892+00:00",
       "title": "Test Alerts - New Device",
       "type": "System Policy Violation"
     }
   ],
   "total": 125
 },
 "success": true
}
{
   "data": {
     "count": 83,
     "next": null,
     "prev": null,
     "results": [
       {
         "accessSwitch": null,
         "boundaries": "N/A",
         "businessImpact": "Unassigned",
         "category": "Handhelds",
         "customProperties": {

         },
         "dataSources": [
           {
             "firstSeen": "2021-07-27T15:15:53+00:00",
             "lastSeen": "2021-07-27T15:15:53+00:00",
             "name": "API",
             "types": [
               "Data Upload"
             ]
           },
           {
             "firstSeen": "2022-10-18T13:10:50.171951+00:00",
             "lastSeen": "2022-10-28T11:02:59.289138+00:00",
             "name": "User",
             "types": [
               "Data Upload"
             ]
           }
         ],
         "firstSeen": "2021-07-27T15:15:53+00:00",
         "id": 2,
         "ipAddress": "10.100.100.111",
         "ipv6": "fe82:3::1ff:fe23:4567:890e",
         "lastSeen": "2022-10-18T13:07:46.713618+00:00",
         "macAddress": "BC:BC:BC:BC:AC:AB",
         "manufacturer": "Apple",
         "model": "iPhone 6SP",
         "name": "test_device alt1",
         "operatingSystem": "iOS",
         "operatingSystemVersion": "16.0",
         "riskLevel": 9,
         "sensor": {
           "name": "API",
           "type": "API"
         },
         "site": {
           "location": "No location",
           "name": null
         },
         "tags": [

         ],
         "type": "Mobile Phones",
         "userIds": [

         ],
         "visibility": "Full"
       }
     ],
     "total": 83
   },
   "success": true
 }
Sample queries
This section contains the sample queries of both the Alerts and Device.
_sourceCategory=ArmisDashboards alertId
| json "alertId","activityUUIDs","connectionIds","description","deviceIds","severity","status","time","title","type" as alertId,activityUUIDs,connectionIds,description,deviceIds,severity,status,time,title,type nodrop
| where severity matches"{{Severity}}" and  status matches"{{Status}}" and type matches"{{Type}}"
| extract field=deviceIds "(?<ids>\b\d+\b)" multi
| where "{{Site}}" = "*" or [subquery: (_sourceCategory=ArmisDashboards id)
  | json "id","site.name" as ids, site
  | where site matches "{{Site}}"
  | compose ids]
| count_distinct(alertId)
_sourceCategory=ArmisDashboards id
| json "id","name","manufacturer","model","riskLevel","sensor","site.name","type","category","operatingSystem" as id, name, manufacturer, model, riskLevel, sensor, site, type, category, operatingSystem nodrop
| where site matches "{{Site}}" and manufacturer matches "{{Manufacturer}}" and type matches "{{Type}}"
| count_distinct(id)
Collection configuration and app installation
Depending on the set up collection method, you can configure and install the app in three ways:
- Create a new collector and install the app. Create a new Sumo Logic Cloud-to-Cloud (C2C) source under a new Sumo Logic Collector and later install the app, or
- Use an existing collector and install the app. Create a new Sumo Logic Cloud-to-Cloud (C2C) source under an existing Sumo Logic Collector and later install the app, or
- Use existing source and install the app. Use your existing configured Sumo Logic Cloud-to-Cloud (C2C) source and install the app.
Use the Cloud-to-Cloud Integration for Armis to create the source and use the same source category while installing the app. By following these steps, you can ensure that your Armis app is properly integrated and configured to collect and analyze your Armis data.
Create a new collector and install the app
To set up collection and install the app, do the following:
Next-Gen App: To install or update the app, you must be an account administrator or a user with Manage Apps, Manage Monitors, Manage Fields, Manage Metric Rules, and Manage Collectors capabilities depending upon the different content types part of the app.
- Select App Catalog.
- In the 🔎 Search Apps field, run a search for your desired app, then select it.
- Click Install App.
note
Sometimes this button says Add Integration.
- In the Set Up Collection section of your respective app, select Create a new Collector.
- Collector Name. Enter a Name to display the Source in the Sumo Logic web application. The description is optional.
- Timezone. Set the default time zone when it is not extracted from the log timestamp. Time zone settings on Sources override a Collector time zone setting.
- (Optional) Metadata. Click the +Add Metadata link to add a custom log Metadata Fields. Define the fields you want to associate, each metadata field needs a name (key) and value.
 A green circle with a checkmark is shown when the field exists and is enabled in the Fields table schema.
 An orange triangle with an exclamation point is shown when the field doesn't exist, or is disabled, in the Fields table schema. In this case, an option to automatically add or enable the nonexistent fields to the Fields table schema is provided. If a field is sent to Sumo that does not exist in the Fields schema or is disabled it is ignored, known as dropped.
- Click Next.
- Configure the source as specified in the
Infobox above, ensuring all required fields are included. - In the Configure section of your respective app, complete the following fields.
- Field Name. If you already have collectors and sources set up, select the configured metadata field name (eg _sourcecategory) or specify other custom metadata (eg: _collector) along with its metadata Field Value.
- Click Next. You will be redirected to the Preview & Done section.
Post-installation
Once your app is installed, it will appear in your Installed Apps folder, and dashboard panels will start to fill automatically.
Each panel slowly fills with data matching the time range query received since the panel was created. Results will not immediately be available but will be updated with full graphs and charts over time.
Use an existing collector and install the app
To set up the source in the existing collector and install the app, do the following:
Next-Gen App: To install or update the app, you must be an account administrator or a user with Manage Apps, Manage Monitors, Manage Fields, Manage Metric Rules, and Manage Collectors capabilities depending upon the different content types part of the app.
- Select App Catalog.
- In the 🔎 Search Apps field, run a search for your desired app, then select it.
- Click Install App.
note
Sometimes this button says Add Integration.
- In the Set Up Collection section of your respective app, select Use an existing Collector.
- From the Select Collector dropdown, select the collector that you want to set up your source with and click Next.
- Configure the source as specified in the
Infobox above, ensuring all required fields are included. - In the Configure section of your respective app, complete the following fields.
- Field Name. If you already have collectors and sources set up, select the configured metadata field name (eg _sourcecategory) or specify other custom metadata (eg: _collector) along with its metadata Field Value.
- Click Next. You will be redirected to the Preview & Done section.
Post-installation
Once your app is installed, it will appear in your Installed Apps folder, and dashboard panels will start to fill automatically.
Each panel slowly fills with data matching the time range query received since the panel was created. Results will not immediately be available but will be updated with full graphs and charts over time.
Use an existing source and install the app
To skip collection and only install the app, do the following:
Next-Gen App: To install or update the app, you must be an account administrator or a user with Manage Apps, Manage Monitors, Manage Fields, Manage Metric Rules, and Manage Collectors capabilities depending upon the different content types part of the app.
- Select App Catalog.
- In the 🔎 Search Apps field, run a search for your desired app, then select it.
- Click Install App.
note
Sometimes this button says Add Integration.
- In the Set Up Collection section of your respective app, select Skip this step and use existing source and click Next.
- In the Configure section of your respective app, complete the following fields.
- Field Name. If you already have collectors and sources set up, select the configured metadata field name (eg _sourcecategory) or specify other custom metadata (eg: _collector) along with its metadata Field Value.
- Click Next. You will be redirected to the Preview & Done section.
Post-installation
Once your app is installed, it will appear in your Installed Apps folder, and dashboard panels will start to fill automatically.
Each panel slowly fills with data matching the time range query received since the panel was created. Results will not immediately be available but will be updated with full graphs and charts over time.
Viewing the Armis dashboards
All dashboards have a set of filters that you can apply to the entire dashboard. Use these filters to drill down and examine the data to a granular level.
- You can change the time range for a dashboard or panel by selecting a predefined interval from a drop-down list, choosing a recently used time range, or specifying custom dates and times. Learn more.
- You can use template variables to drill down and examine the data on a granular level. For more information, see Filtering Dashboards with Template Variables.
- Most Next-Gen apps allow you to provide the scope at the installation time and are comprised of a key (
_sourceCategoryby default) and a default value for this key. Based on your input, the app dashboards will be parameterized with a dashboard variable, allowing you to change the dataset queried by all panels. This eliminates the need to create multiple copies of the same dashboard with different queries.
Alerts Overview
Armis - Alerts Overview dashboard. The dashboard provides a comprehensive analysis of alerts, by categorizing them based on their severity, status, type, and presenting a trend of alerts over a specified period of time.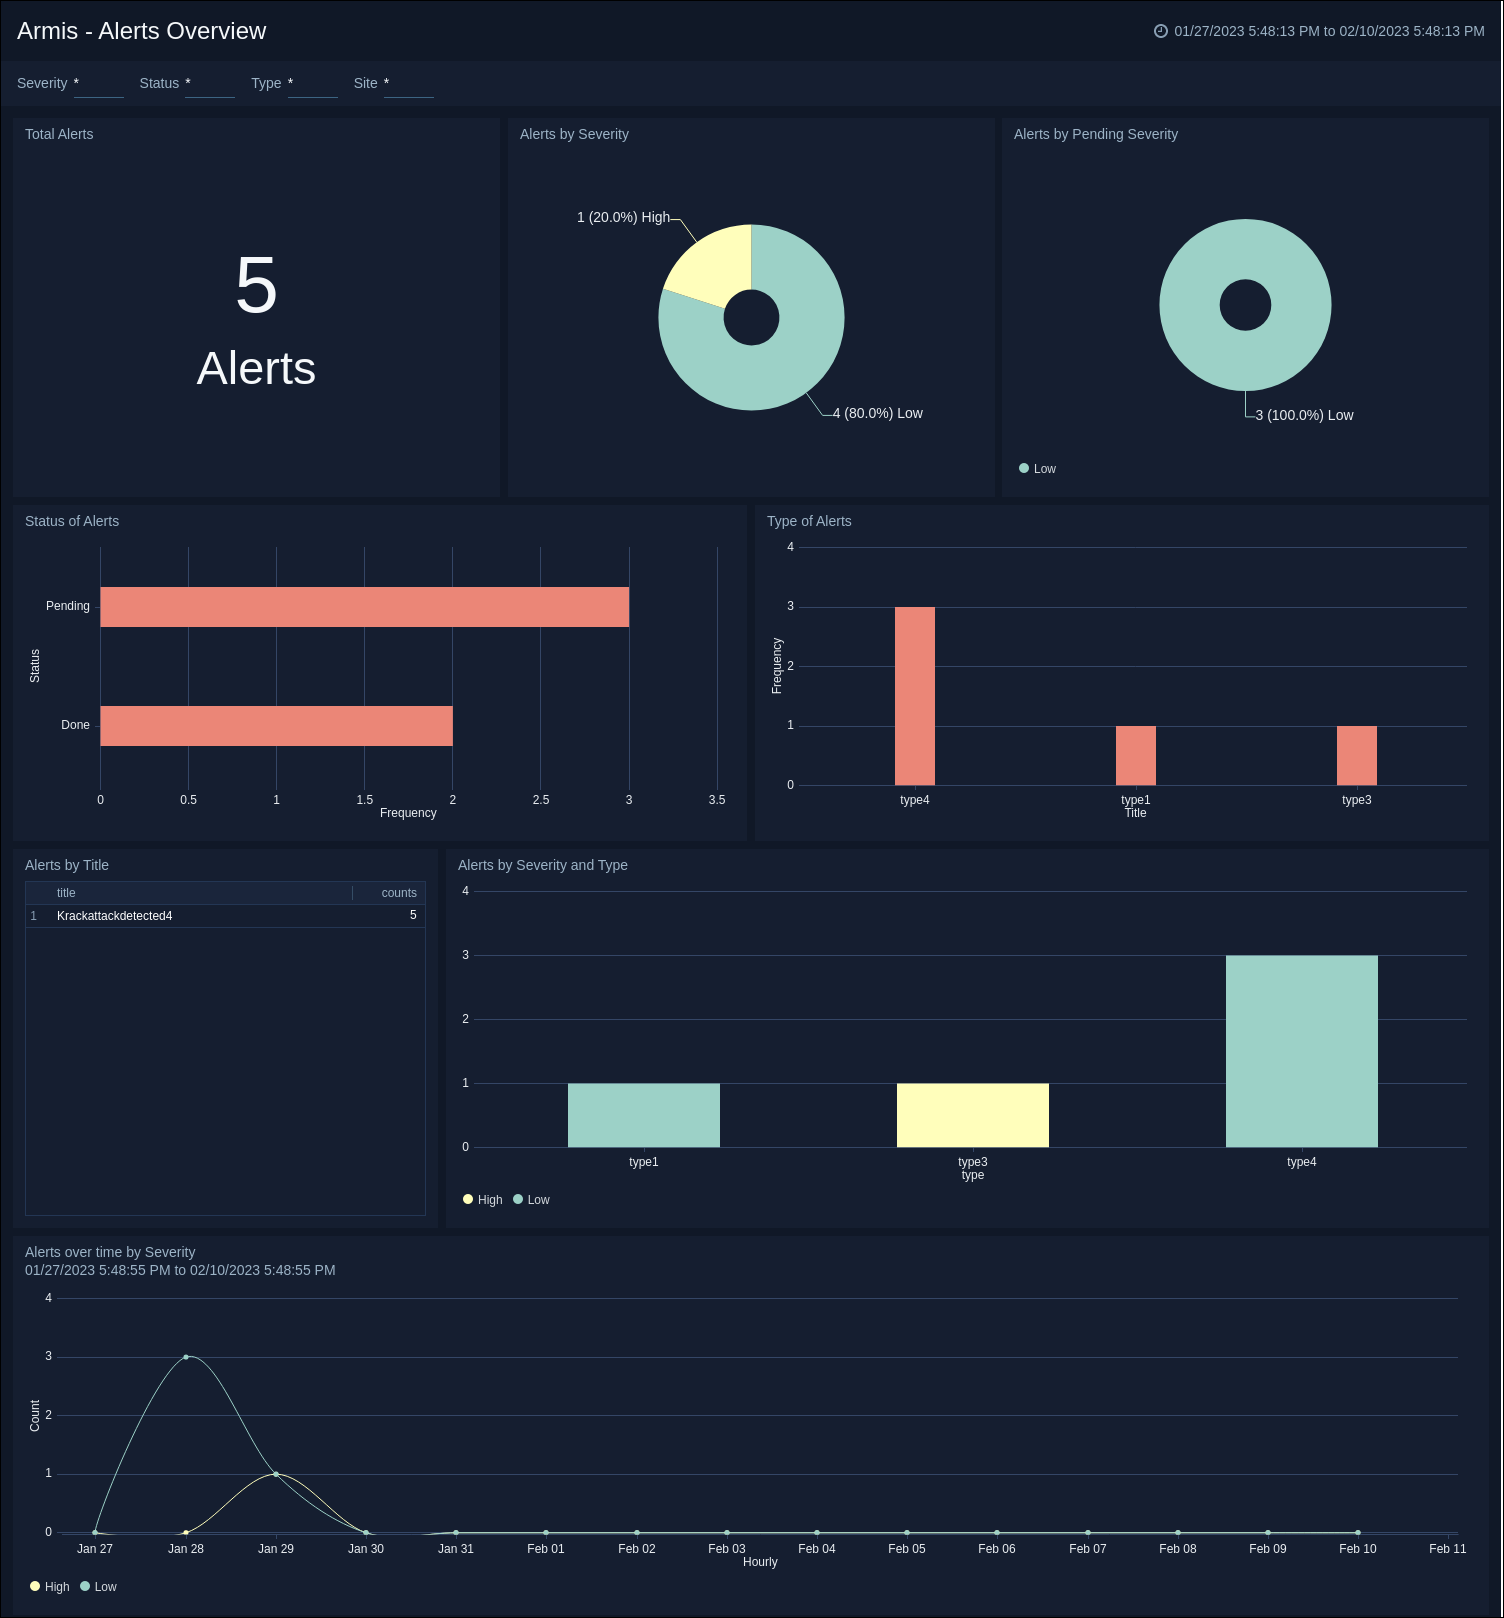
Device Overview
Armis - Device Overview dashboard. The dashboard provides a table view of last-seen devices with key information to protect your IT infrastructure and offers visibility into devices based on risk levels, types, and categories.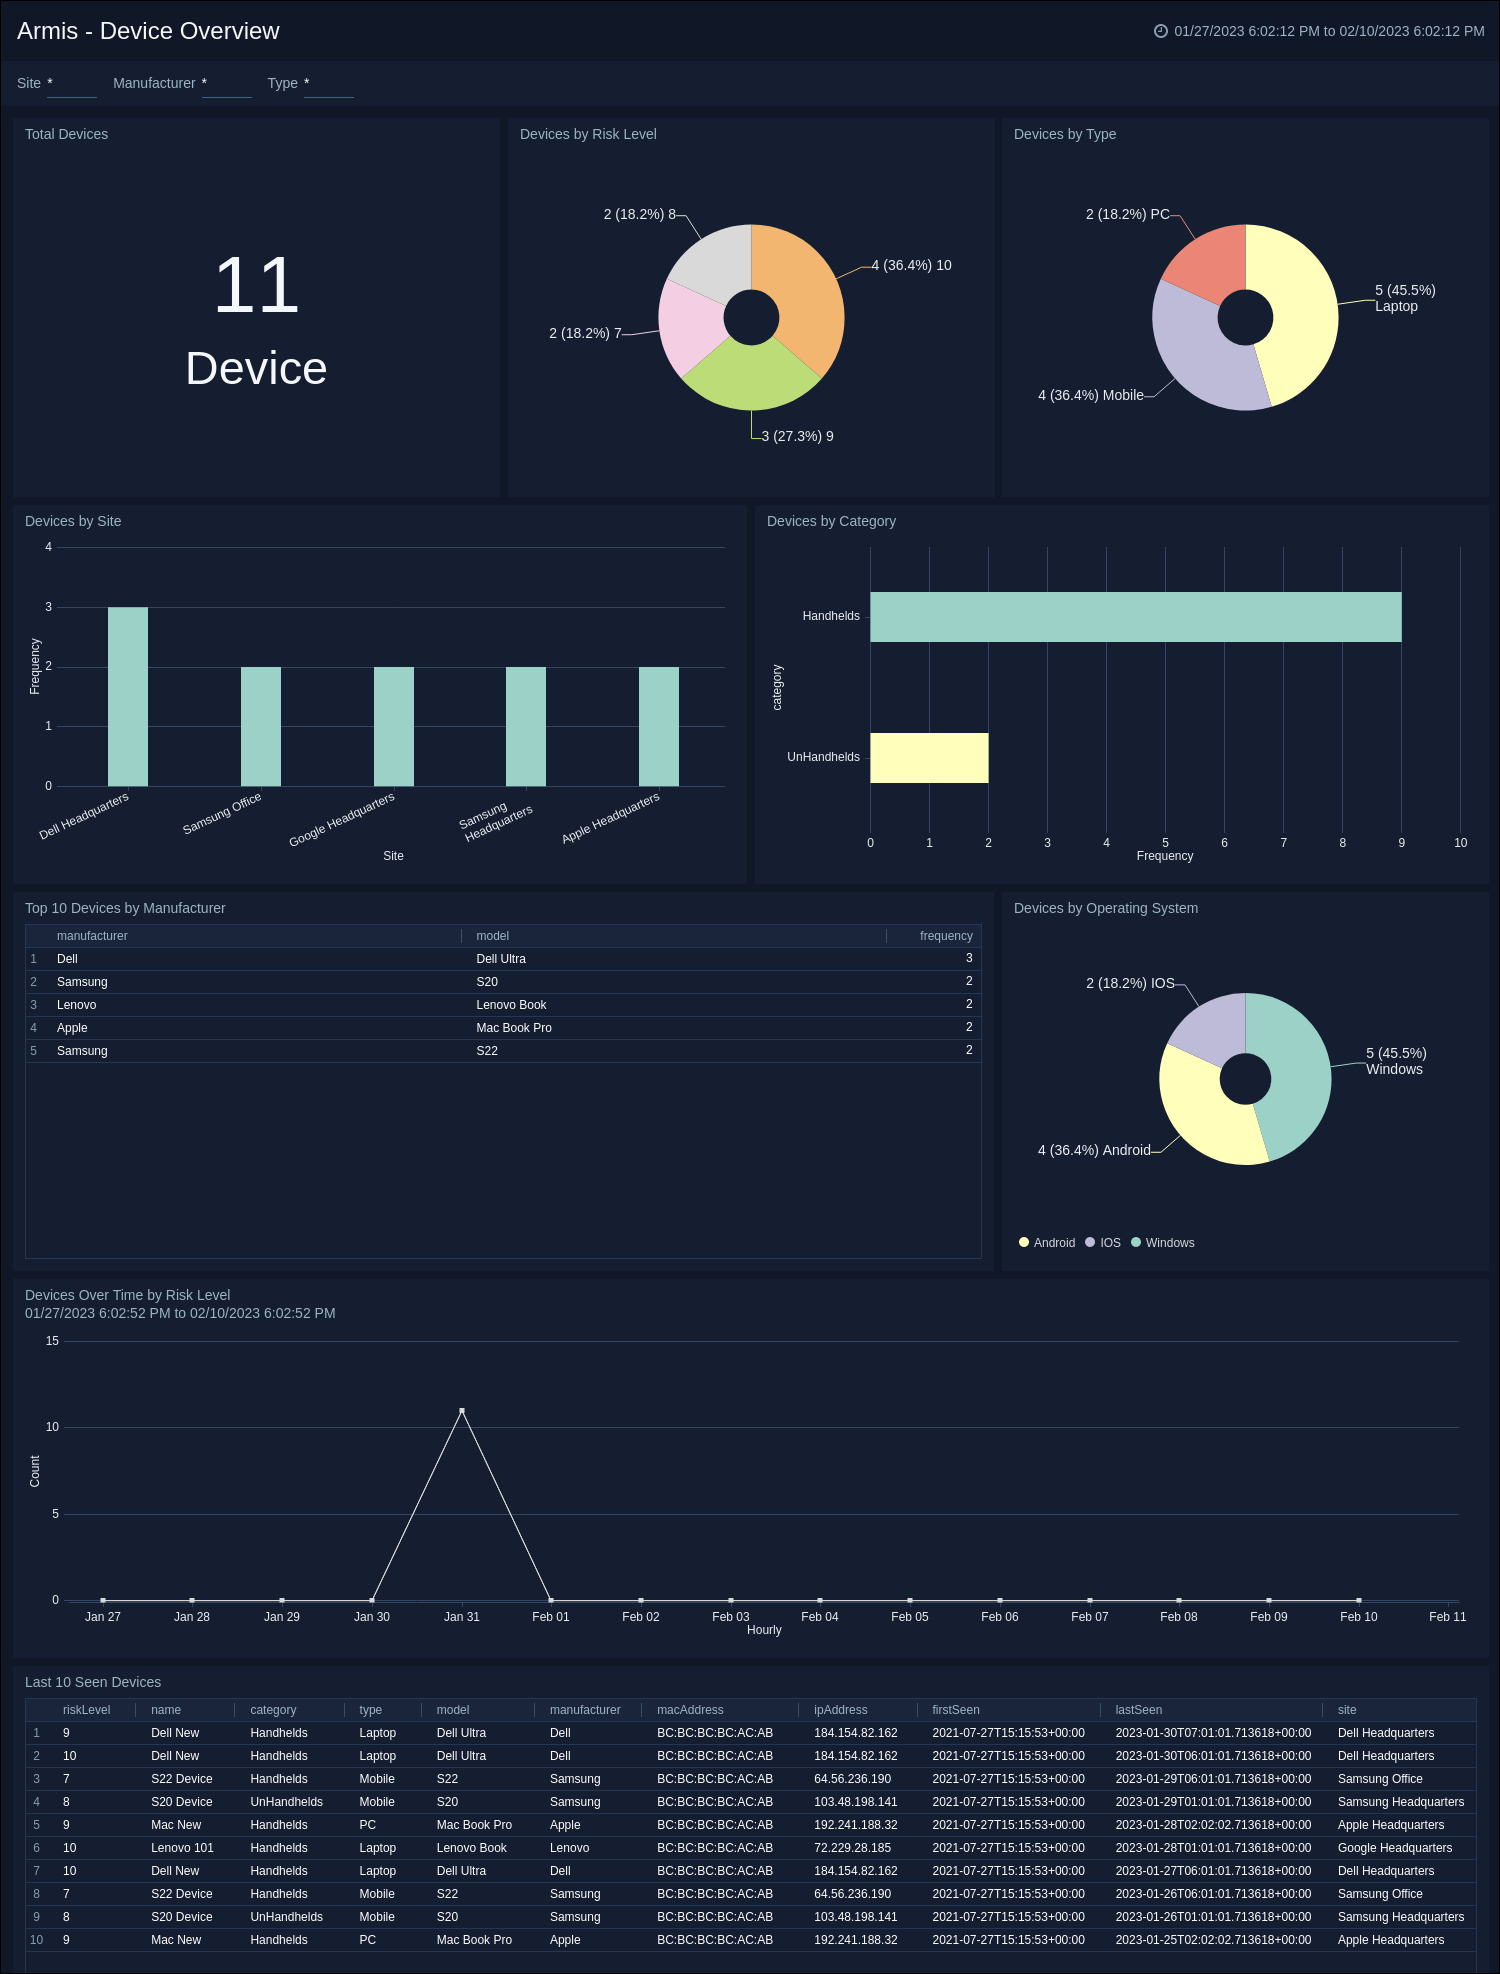
Upgrade/Downgrade the Armis app (Optional)
To update the app, do the following:
Next-Gen App: To install or update the app, you must be an account administrator or a user with Manage Apps, Manage Monitors, Manage Fields, Manage Metric Rules, and Manage Collectors capabilities depending upon the different content types part of the app.
- Select App Catalog.
- In the Search Apps field, search for and then select your app.
Optionally, you can identify apps that can be upgraded in the Upgrade available section. - To upgrade the app, select Upgrade from the Manage dropdown.
- If the upgrade does not have any configuration or property changes, you will be redirected to the Preview & Done section.
- If the upgrade has any configuration or property changes, you will be redirected to the Setup Data page.
- In the Configure section of your respective app, complete the following fields.
- Field Name. If you already have collectors and sources set up, select the configured metadata field name (eg _sourcecategory) or specify other custom metadata (eg: _collector) along with its metadata Field Value.
- Click Next. You will be redirected to the Preview & Done section.
Post-update
Your upgraded app will be installed in the Installed Apps folder and dashboard panels will start to fill automatically.
See our Release Notes changelog for new updates in the app.
To revert the app to a previous version, do the following:
- Select App Catalog.
- In the Search Apps field, search for and then select your app.
- To version down the app, select Revert to < previous version of your app > from the Manage dropdown.
Uninstalling the Armis app (Optional)
To uninstall the app, do the following:
- Select App Catalog.
- In the 🔎 Search Apps field, run a search for your desired app, then select it.
- Click Uninstall.