Fastly

Fastly is a content delivery network (CDN) that provides you control over how and where you serve content, access to real-time performance analytics, and the ability to cache unpredictably changing content at the edge.
Log types
The Fastly app uses the following log types:
- Fastly CDN logs
- Fastly WAF Request and Debug logs. For information about WAF logging, refer to the Fastly WAF logging.
Sample queries
_sourceCategory=fastly 50? | parse "\"reqPath\":\"*\"" as path, "\"status\":\"*\"" as status | urldecode(path) as path | where status > 499 | where status < 600 | count as errors by path | sort by errors
_sourceCategory=fastly cacheStatus | parse "\"cacheStatus\":\"*\"" as status | where !(status="") | if(status="0", "0 - Non cacheable", if(status="1" OR status="2", "1/2 - Cache Hit", if(status="3", "3 - Cache Miss", ""))) as cachestatus | count by cachestatus
_sourceCategory=fastly waf denyRules reqHost | parse "\"denyRules\":\"*\"" as deny, "\"reqHost\":\"*\"" as host | where deny != "" | timeslice 1m | count by host, _timeslice | transpose row _timeslice column host
Collecting logs for Fastly
This section has instructions for setting up log collection for the Fastly app.
Step 1: Configure collector and source
In this step, you configure a collector and source to receive Fastly logs.
- Add a Sumo Logic Hosted Collector to your Sumo Logic Org.
- Configure an HTTP Source for your Fastly request logs. Make sure to set the Source Category when configuring the HTTP source. For example,
fastly. Make a note of the Source Category you assign to the source. You will provide this Source Category value when you install the Fastly app.
Step 2. Configure Endpoint in Fastly for CDN Logs
In this step you add Sumo Logic as a logging endpoint for Fastly services, and configure it to receive CDN logs. The process is described in Adding Sumo Logic as a logging endpoint in Fastly help.
If you want to collect CDN and Request WAF logs, see Collect WAF Request logs below.
Ensure that the data is sent to Sumo Logic in Log format version 2. To check the format, see Determine which log file format you are using in Fastly help. Note, however, that all new logging endpoints use the version 2 custom log format by default.
When you configure the Sumo Logic endpoint in Fastly:
- Name. Enter a name for the connection. For example, “Prod Fastly”.
- Log format. Enter the Fastly log variables. Use this format string, which generates the necessary JSON output.
Click to expand snippet
{
  "service_id": "%{req.service_id}V",
  "service_version": "%{fastly_info.version}V",
  "time_start": "%{begin:%Y-%m-%dT%H:%M:%S%Z}t",
  "time_end": "%{end:%Y-%m-%dT%H:%M:%S%Z}t",
  "time_elapsed": "%{time.elapsed.usec}V",
  "client_ip": "%{req.http.Fastly-Client-IP}V",
  "request": "%{req.request}V",
  "protocol": "%{req.proto}V",
  "host": "%{req.http.Fastly-Orig-Host}V",
  "origin_host": "%{req.http.Host}V",
  "url": "%{json.escape(req.url)}V",
  "is_ipv6": "%{if(req.is_ipv6, \"true\", \"false\")}V",
  "is_tls": "%{if(req.is_ssl, \"true\", \"false\")}V",
  "tls_client_protocol": "%{json.escape(tls.client.protocol)}V",
  "tls_client_servername": "%{json.escape(tls.client.servername)}V",
  "tls_client_cipher": "%{json.escape(tls.client.cipher)}V",
  "tls_client_cipher_sha": "%{json.escape(tls.client.ciphers_sha)}V",
  "tls_client_tlsexts_sha": "%{json.escape(tls.client.tlsexts_sha)}V",
  "is_h2": "%{if(fastly_info.is_h2, \"true\", \"false\")}V",
  "is_h2_push": "%{if(fastly_info.h2.is_push, \"true\", \"false\")}V",
  "h2_stream_id": "%{fastly_info.h2.stream_id}V",
  "request_referer": "%{json.escape(req.http.Referer)}V",
  "request_user_agent": "%{json.escape(req.http.User-Agent)}V",
  "request_accept_content": "%{json.escape(req.http.Accept)}V",
  "request_accept_language": "%{json.escape(req.http.Accept-Language)}V",
  "request_accept_encoding": "%{json.escape(req.http.Accept-Encoding)}V",
  "request_accept_charset": "%{json.escape(req.http.Accept-Charset)}V",
  "request_connection": "%{json.escape(req.http.Connection)}V",
  "request_dnt": "%{json.escape(req.http.DNT)}V",
  "request_forwarded": "%{json.escape(req.http.Forwarded)}V",
  "request_via": "%{json.escape(req.http.Via)}V",
  "request_cache_control": "%{json.escape(req.http.Cache-Control)}V",
  "request_x_requested_with": "%{json.escape(req.http.X-Requested-With)}V",
  "request_x_forwarded_for": "%{json.escape(req.http.X-Forwarded-For)}V",
  "status": "%{resp.status}V",
  "content_type": "%{json.escape(resp.http.Content-Type)}V",
  "cache_status": "%{regsub(fastly_info.state, \"^(HIT-(SYNTH)|(HITPASS|HIT|MISS|PASS|ERROR|PIPE)).*\", \"\\2\\3\")}V",
  "is_cacheable": "%{if(fastly_info.state~\"^(HIT|MISS)$\", \"true\", \"false\")}V",
  "response_age": "%{json.escape(resp.http.Age)}V",
  "response_cache_control": "%{json.escape(resp.http.Cache-Control)}V",
  "response_expires": "%{json.escape(resp.http.Expires)}V",
  "response_last_modified": "%{json.escape(resp.http.Last-Modified)}V",
  "response_tsv": "%{json.escape(resp.http.TSV)}V",
  "geo_datacenter": "%{server.datacenter}V",
  "geo_city": "%{client.geo.city}V",
  "geo_country_code": "%{client.geo.country_code}V",
  "geo_continent_code": "%{client.geo.continent_code}V",
  "geo_region": "%{client.geo.region}V",
  "req_header_size": "%{req.header_bytes_read}V",
  "req_body_size": "%{req.body_bytes_read}V",
  "resp_header_size": "%{resp.header_bytes_written}V",
  "resp_body_size": "%{resp.body_bytes_written}V",
  "socket_cwnd": "%{client.socket.cwnd}V",
  "socket_nexthop": "%{client.socket.nexthop}V",
  "socket_tcpi_rcv_mss": "%{client.socket.tcpi_rcv_mss}V",
  "socket_tcpi_snd_mss": "%{client.socket.tcpi_snd_mss}V",
  "socket_tcpi_rtt": "%{client.socket.tcpi_rtt}V",
  "socket_tcpi_rttvar": "%{client.socket.tcpi_rttvar}V",
  "socket_tcpi_rcv_rtt": "%{client.socket.tcpi_rcv_rtt}V",
  "socket_tcpi_rcv_space": "%{client.socket.tcpi_rcv_space}V",
  "socket_tcpi_last_data_sent": "%{client.socket.tcpi_last_data_sent}V",
  "socket_tcpi_total_retrans": "%{client.socket.tcpi_total_retrans}V",
  "socket_tcpi_delta_retrans": "%{client.socket.tcpi_delta_retrans}V",
  "socket_ploss": "%{client.socket.ploss}V"
}
- Collector URL. Enter the URL for the HTTP source you created in Step 1 above.
- Click Advanced options.
- By default the log line format is set to Classic. Change it to Blank.
- Click the Create button to create the new logging endpoint.
- Click the Activate button to deploy your configuration.
Step 3: Collect WAF Request logs
If you have Fastly's Web Application Firewall (WAF), perform these steps to update the configuration of the endpoint you created in Step 2 above. You are updating the endpoint to receive WAF Request logs as well as CDN logs.
- Use the JSON object below into the Log format field instead of the one specified in Configure endpoint in Fastly for CDN logs.
Click to expand snippet
{
"service_id": "%{req.service_id}V",
"service_version": "%{fastly_info.version}V",
"time_start": "%{begin:%Y-%m-%dT%H:%M:%S%Z}t",
"time_end": "%{end:%Y-%m-%dT%H:%M:%S%Z}t",
"time_elapsed": "%{time.elapsed.usec}V",
"client_ip": "%{req.http.Fastly-Client-IP}V",
"request": "%{req.request}V",
"protocol": "%{req.proto}V",
"host": "%{req.http.Fastly-Orig-Host}V",
"origin_host": "%{req.http.Host}V",
"url": "%{json.escape(req.url)}V",
"is_ipv6": "%{if(req.is_ipv6, \"true\", \"false\")}V",
"is_tls": "%{if(req.is_ssl, \"true\", \"false\")}V",
"tls_client_protocol": "%{json.escape(tls.client.protocol)}V",
"tls_client_servername": "%{json.escape(tls.client.servername)}V",
"tls_client_cipher": "%{json.escape(tls.client.cipher)}V",
"tls_client_cipher_sha": "%{json.escape(tls.client.ciphers_sha)}V",
"tls_client_tlsexts_sha": "%{json.escape(tls.client.tlsexts_sha)}V",
"is_h2": "%{if(fastly_info.is_h2, \"true\", \"false\")}V",
"is_h2_push": "%{if(fastly_info.h2.is_push, \"true\", \"false\")}V",
"h2_stream_id": "%{fastly_info.h2.stream_id}V",
"request_referer": "%{json.escape(req.http.Referer)}V",
"request_user_agent": "%{json.escape(req.http.User-Agent)}V",
"request_accept_content": "%{json.escape(req.http.Accept)}V",
"request_accept_language": "%{json.escape(req.http.Accept-Language)}V",
"request_accept_encoding": "%{json.escape(req.http.Accept-Encoding)}V",
"request_accept_charset": "%{json.escape(req.http.Accept-Charset)}V",
"request_connection": "%{json.escape(req.http.Connection)}V",
"request_dnt": "%{json.escape(req.http.DNT)}V",
"request_forwarded": "%{json.escape(req.http.Forwarded)}V",
"request_via": "%{json.escape(req.http.Via)}V",
"request_cache_control": "%{json.escape(req.http.Cache-Control)}V",
"request_x_requested_with": "%{json.escape(req.http.X-Requested-With)}V",
"request_x_forwarded_for": "%{json.escape(req.http.X-Forwarded-For)}V",
"status": "%{resp.status}V",
"content_type": "%{json.escape(resp.http.Content-Type)}V",
"cache_status": "%{regsub(fastly_info.state, \"^(HIT-(SYNTH)|(HITPASS|HIT|MISS|PASS|ERROR|PIPE)).*\", \"\\2\\3\")}V",
"is_cacheable": "%{if(fastly_info.state~\"^(HIT|MISS)$\", \"true\", \"false\")}V",
"response_age": "%{json.escape(resp.http.Age)}V",
"response_cache_control": "%{json.escape(resp.http.Cache-Control)}V",
"response_expires": "%{json.escape(resp.http.Expires)}V",
"response_last_modified": "%{json.escape(resp.http.Last-Modified)}V",
"response_tsv": "%{json.escape(resp.http.TSV)}V",
"geo_datacenter": "%{server.datacenter}V",
"geo_city": "%{client.geo.city}V",
"geo_country_code": "%{client.geo.country_code}V",
"geo_continent_code": "%{client.geo.continent_code}V",
"geo_region": "%{client.geo.region}V",
"req_header_size": "%{req.header_bytes_read}V",
"req_body_size": "%{req.body_bytes_read}V",
"resp_header_size": "%{resp.header_bytes_written}V",
"resp_body_size": "%{resp.body_bytes_written}V",
"socket_cwnd": "%{client.socket.cwnd}V",
"socket_nexthop": "%{client.socket.nexthop}V",
"socket_tcpi_rcv_mss": "%{client.socket.tcpi_rcv_mss}V",
"socket_tcpi_snd_mss": "%{client.socket.tcpi_snd_mss}V",
"socket_tcpi_rtt": "%{client.socket.tcpi_rtt}V",
"socket_tcpi_rttvar": "%{client.socket.tcpi_rttvar}V",
"socket_tcpi_rcv_rtt": "%{client.socket.tcpi_rcv_rtt}V",
"socket_tcpi_rcv_space": "%{client.socket.tcpi_rcv_space}V",
"socket_tcpi_last_data_sent": "%{client.socket.tcpi_last_data_sent}V",
"socket_tcpi_total_retrans": "%{client.socket.tcpi_total_retrans}V",
"socket_tcpi_delta_retrans": "%{client.socket.tcpi_delta_retrans}V",
"socket_ploss": "%{client.socket.ploss}V",
"type": "request_logs",
"request_id": "%{req.http.x-request-id}V",
"waf_logged": "%{waf.logged}V",
"waf_block": "%{waf.blocked}V",
"waf_failures": "%{waf.failures}V",
"waf_rule_id": "%{waf.rule_id}V",
"waf_severity": "%{waf.severity}V",
"waf_passed": "%{waf.passed}V",
"waf_logdata": "%{json.escape(waf.logdata)}V",
"waf_executed": "%{waf.executed}V",
"waf_anomaly_score": "%{waf.anomaly_score}V",
"waf_sql_score": "%{waf.sql_injection_score}V",
"waf_rfi_score": "%{waf.rfi_score}V",
"waf_lfi_score": "%{waf.lfi_score}V",
"waf_xss_score": "%{waf.xss_score}V",
"waf_http_score": "%{waf.http_violation_score}V",
"waf_php_score": "%{waf.php_injection_score}V",
"waf_rce_score": "%{waf.rce_score}V",
"waf_session_fixation_score": "%{waf.session_fixation_score}V",
"waf_message": "%{json.escape(waf.message)}V"
} - Point the logging endpoint to the
waf_debug_logsubroutine using curl, as described in waf_debug_log in Fastly help. - Create a
request_idheader to track a single request.
Step 4: Collect WAF Debug Logs
If you have Fastly's Web Application Firewall (WAF), perform these steps to add a second logging endpoint in Fastly and configure it to send WAF request logs to Sumo Logic.
- Configure another HTTP Source for debug logs and set its source category. For example, fastly/debug. Make a note of the Source Category you assign to the source. You will provide this Source Category value when you install the Fastly app.
- Create another logging endpoint in Fastly following the instructions Step 2, but enter the JSON below in the Log format field.
Click to expand snippet
{
  "type": "debug_logs",
  "service_id": "%{req.service_id}V",
  "client_ip": "%{req.http.Fastly-Client-IP}V",
  "request": "%{req.request}V",
  "protocol": "%{req.proto}V",
  "origin_host": "%{req.http.Host}V",
  "url": "%{json.escape(req.url)}V",
  "request_referer": "%{json.escape(req.http.Referer)}V",
  "request_user_agent": "%{json.escape(req.http.User-Agent)}V",
  "request_accept_content": "%{json.escape(req.http.Accept)}V",
  "cache_status": "%{regsub(fastly_info.state, \"^(HIT-(SYNTH)|(HITPASS|HIT|MISS|PASS|ERROR|PIPE|NONE)).*\", \"\\2\\3\")}V",
  "geo_datacenter": "%{server.datacenter}V",
  "geo_city": "%{client.geo.city}V",
  "geo_country_code": "%{client.geo.country_code}V",
  "geo_continent_code": "%{client.geo.continent_code}V",
  "geo_region": "%{client.geo.region}V",
  "request_id": "%{req.http.x-request-id}V",
  "waf_logged": "%{waf.logged}V",
  "waf_block": "%{waf.blocked}V",
  "waf_failures": "%{waf.failures}V",
  "waf_rule_id": "%{waf.rule_id}V",
  "waf_severity": "%{waf.severity}V",
  "waf_passed": "%{waf.passed}V",
  "waf_logdata": "%{json.escape(waf.logdata)}V",
  "waf_executed": "%{waf.executed}V",
  "waf_anomaly_score": "%{waf.anomaly_score}V",
  "waf_sql_score": "%{waf.sql_injection_score}V",
  "waf_rfi_score": "%{waf.rfi_score}V",
  "waf_lfi_score": "%{waf.lfi_score}V",
  "waf_xss_score": "%{waf.xss_score}V",
  "waf_http_score": "%{waf.http_violation_score}V",
  "waf_php_score": "%{waf.php_injection_score}V",
  "waf_rce_score": "%{waf.rce_score}V",
  "waf_session_fixation_score": "%{waf.session_fixation_score}V",
  "waf_message": "%{json.escape(waf.message)}V"
}
Field Extraction Rule
This Field Extraction Rule (FER) is provided as an example to help you reduce your overall parsing time. Note that not all parse operators are supported in FERs. For more information, see Creating a Field Extraction Rule.
parse "\"reqMethod\":\"*\"" as method, "\"status\":\"*\"" as status, "\"fwdHost\":\"*\"" as origin| parse "\"bytes\":\"*\"" as bytes, "\"edgeIP\":\"*\"" as edgeip, "\"country\":\"*\"" as country, "\"cookie\":\"*\"" as cookie
There is a 200 field name limit for Field Extraction Rules (FER) and once a field is persisted using a FER, it can’t be removed. You can assign different targets to the name, but do not create overlapping messages and source categories.
Installing the Fastly app
To install the app, do the following:
Next-Gen App: To install or update the app, you must be an account administrator or a user with Manage Apps, Manage Monitors, Manage Fields, Manage Metric Rules, and Manage Collectors capabilities depending upon the different content types part of the app.
- Select App Catalog.
- In the 🔎 Search Apps field, run a search for your desired app, then select it.
- Click Install App.
note
Sometimes this button says Add Integration.
- Click Next in the Setup Data section.
- In the Configure section of your respective app, complete the following fields.
- Field Name. If you already have collectors and sources set up, select the configured metadata field name (eg _sourcecategory) or specify other custom metadata (eg: _collector) along with its metadata Field Value.
- Click Next. You will be redirected to the Preview & Done section.
Post-installation
Once your app is installed, it will appear in your Installed Apps folder, and dashboard panels will start to fill automatically.
Each panel slowly fills with data matching the time range query received since the panel was created. Results will not immediately be available but will be updated with full graphs and charts over time.
Viewing the Fastly dashboards
All dashboards have a set of filters that you can apply to the entire dashboard. Use these filters to drill down and examine the data to a granular level.
- You can change the time range for a dashboard or panel by selecting a predefined interval from a drop-down list, choosing a recently used time range, or specifying custom dates and times. Learn more.
- You can use template variables to drill down and examine the data on a granular level. For more information, see Filtering Dashboards with Template Variables.
- Most Next-Gen apps allow you to provide the scope at the installation time and are comprised of a key (
_sourceCategoryby default) and a default value for this key. Based on your input, the app dashboards will be parameterized with a dashboard variable, allowing you to change the dataset queried by all panels. This eliminates the need to create multiple copies of the same dashboard with different queries.
CDN - Overview
The overview dashboard provides a high-level view of your Fastly traffic and identifies potential problems within the service.
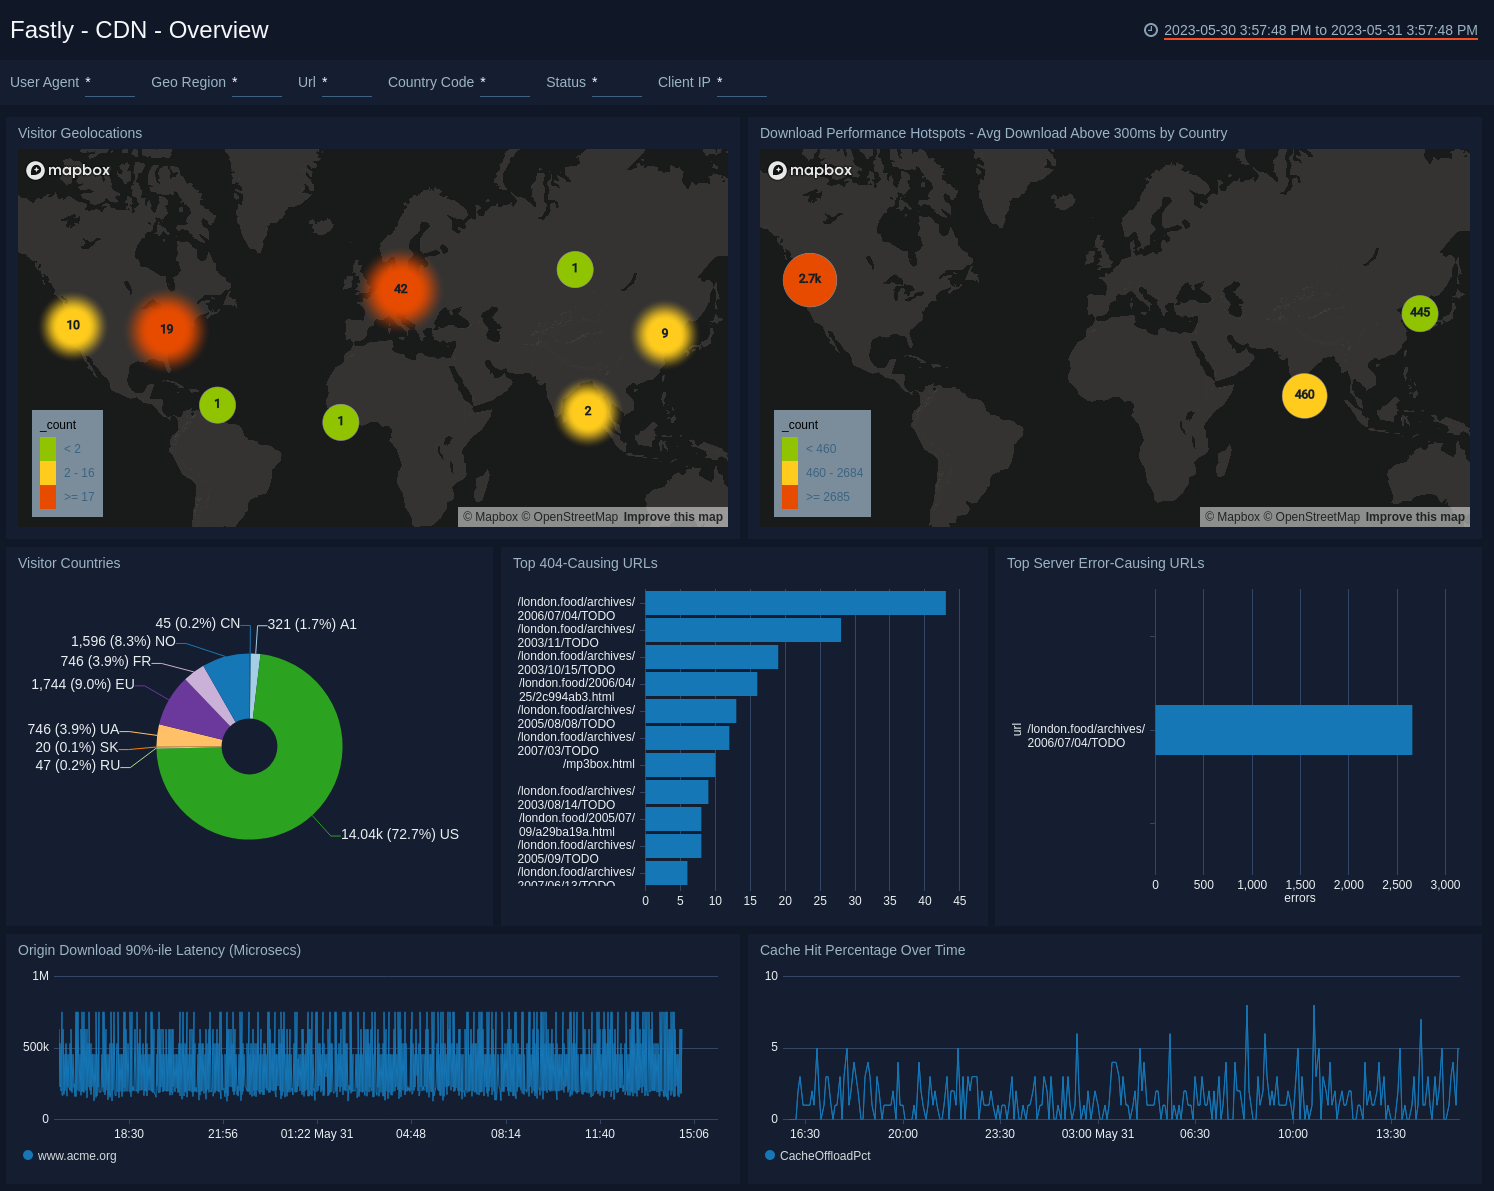
- Visitor Geolocations. Uses geolocation to display visitors by country using their IP addresses.
- Download Performance Hotspots - Avg Download Above 300ms by Country. Uses a geolocation operation to display performance download time hotspots on a map of the world by IP addresses, lets you see a count of hits per location over the last 60 minutes.
- Visitor Countries. Displays the originating country of visitors to your site by IP address over the last three hours in a pie chart. Hover over a section of the pie chart to display more details.
- Top 404-Causing URLs. Displays the top 25 URLs that have produced a 404 error in the last 60 minutes and counts the errors in a bar chart.
- Top Server Error-Causing URLs. Lists the servers with error-causing URLs for the last 60 minutes.
- Origin Download 90%-ile Latency (Microsecs). Line chart of the number of origin downloads with 90th percentile latency over the last 60 minutes.
- Cache Hit Percentage Over Time. Line chart of the cache hit percentage over the last 60 minutes.
CDN - Origin Performance
Focus in on Origin Host performance to check latencies, slow URLs, and error-causing URLs.
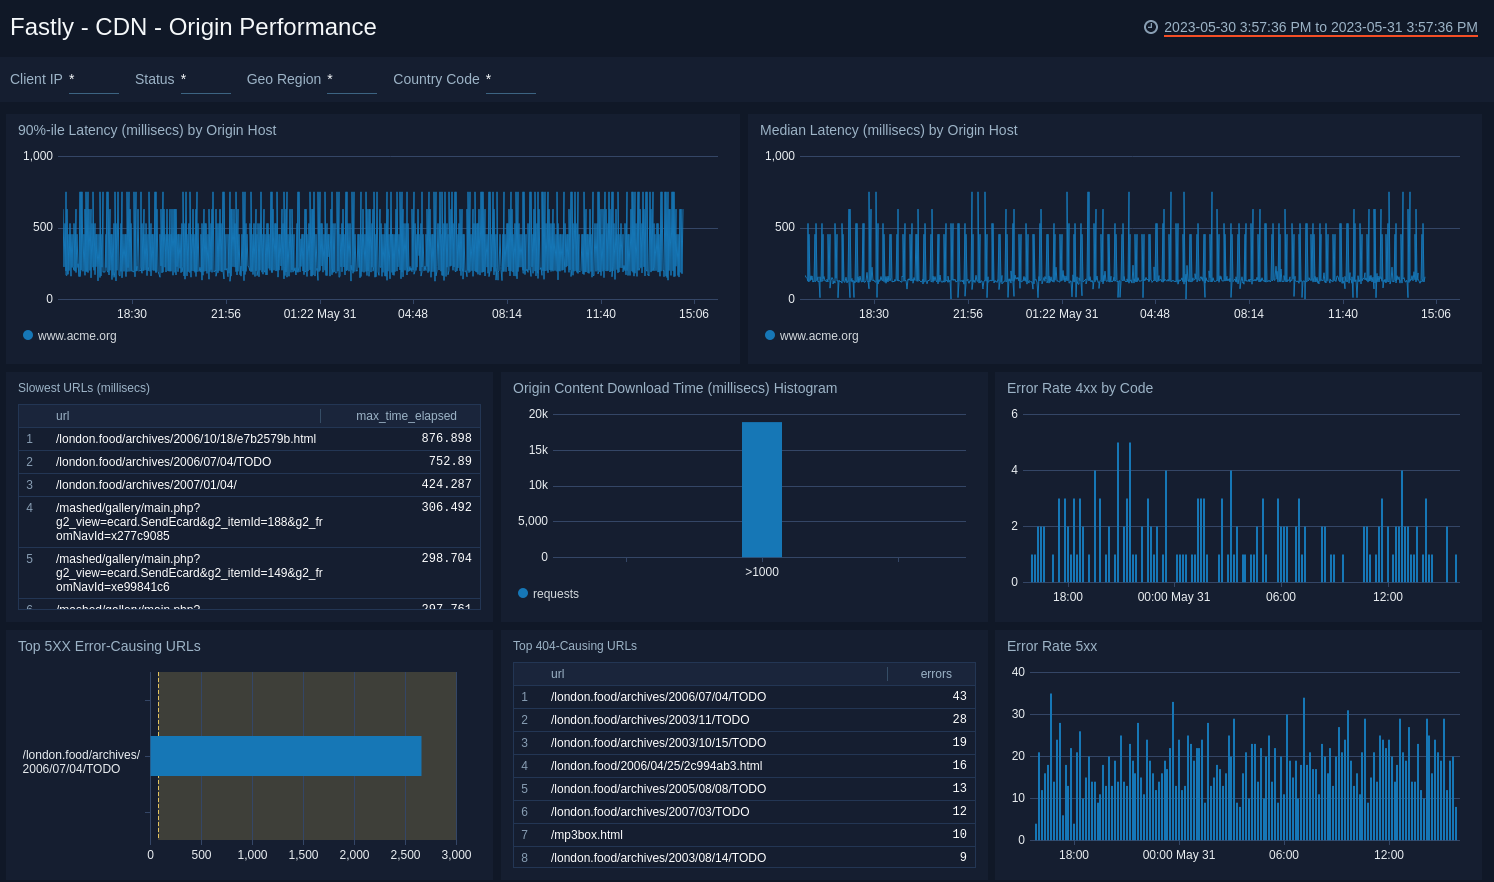
- 90%-ile Latency (millisecs) by Origin Host. Displays the 90th percentile of the data center response time latency as a line chart on a timeline for the last hour, using timeslices of one minute.
- Median Latency (millisecs) by Origin Host. Displays the median latency time as a line chart for the past hour.
- Slowest URLs (millisecs) Lists the top 10 slowest URLs, including the path and the maximum latency metric for the last hour, in an aggregation table.
- Origin Content Download Time (millisecs) Histogram. Displays download times for origin content for the number of requests and the response time in a column chart for the last hour.
- Error Rate 4xx by Code. Displays the number of 4xx error events by code in a stacked column chart on a timeline using timeslices of 10 minutes for the past 24 hours.
- Top 5xx Error-Causing URLs. Displays the URLs that have produced the most errors in the last 15 minutes and counts the errors in a bar chart.
- Top 404-Causing URLs. Displays the top 25 URLs that have produced a 404 error in the last 15 minutes and counts the errors in a bar chart.
- Error Rate 5xx. Shows the number of 5xx error events by code in a stacked column chart on a timeline using timeslices of 10 minutes for the past 24 hours.
CDN - Quality of Service
See where quality of service is below minimum thresholds such as download times, cache performance, and data center performance.
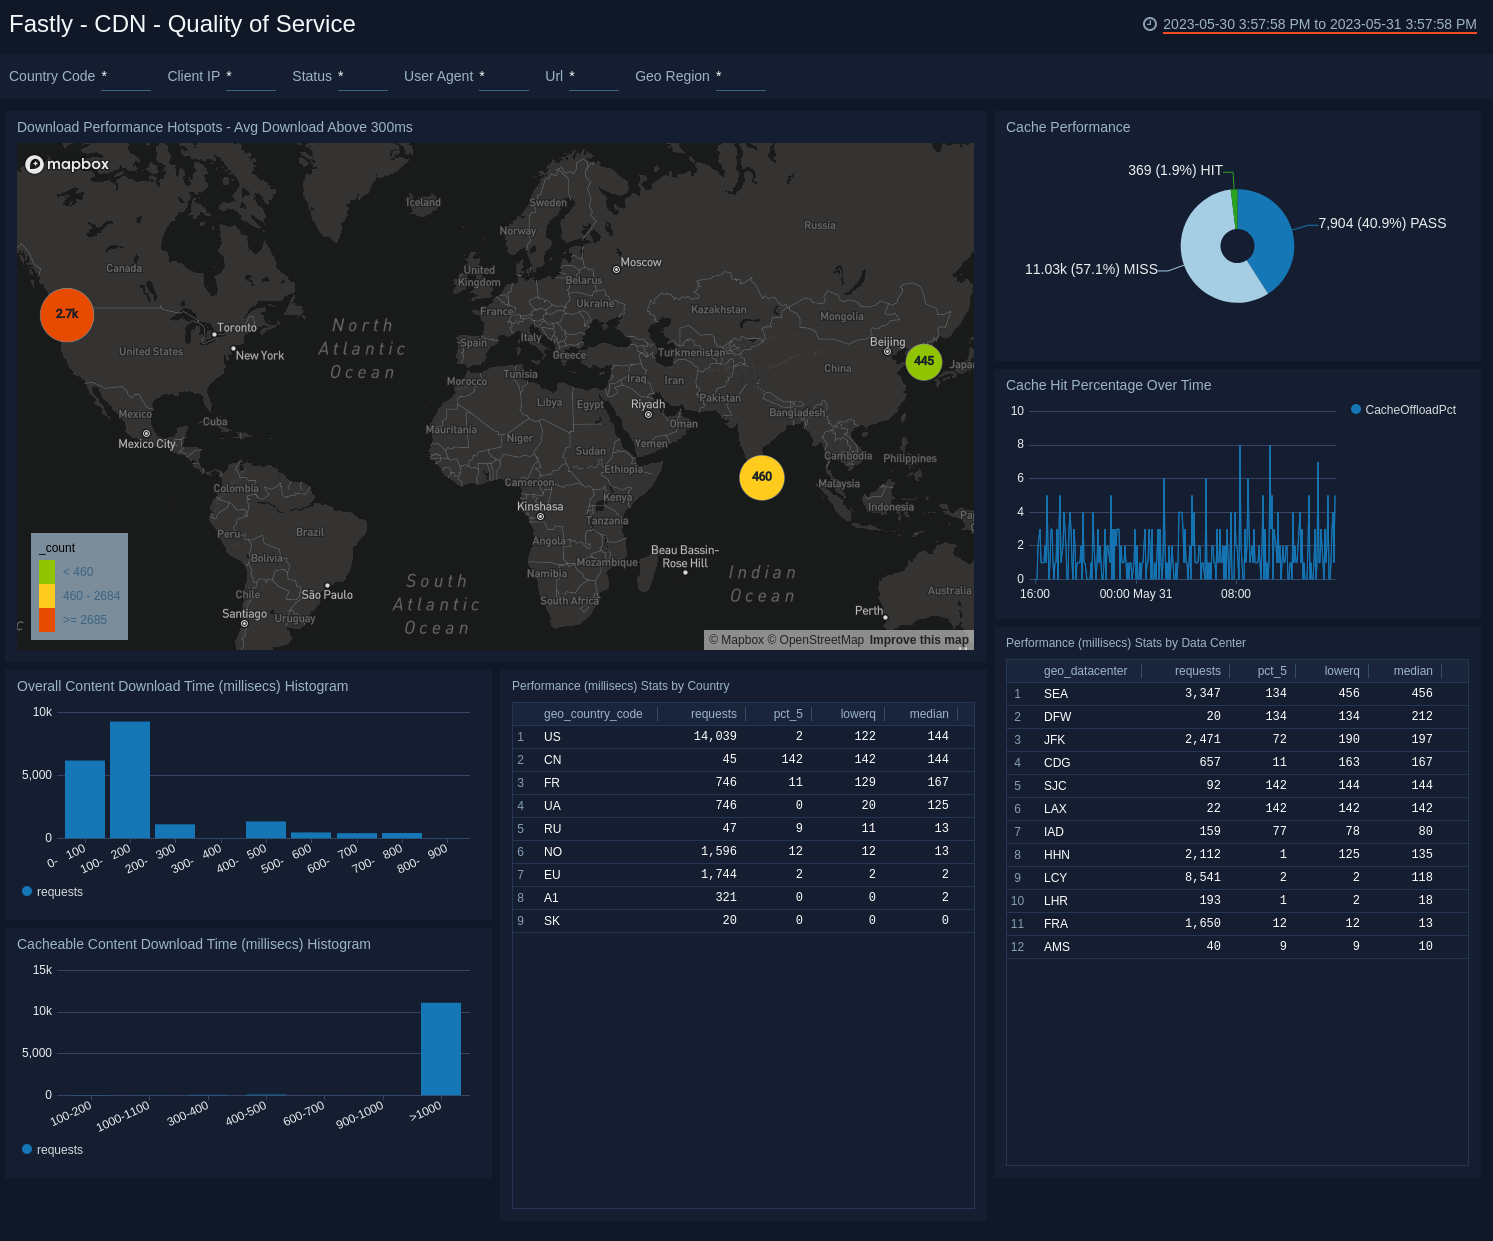
- Download Performance Hotspots - Avg Download Above 300ms. Uses a geolocation operation to display performance download time hotspots on a map of the world by IP addresses, lets you see a count of hits per location for the last hour.
- Cache Performance. The number of Hits, Passes, and Misses as a percentage over a period of time.
- Cache Hit Percentage Over Time. Line graph of the percentage of cache hits over the last 60 minutes.
- Overall Content Download Time (millisecs) Histogram. Bar chart of response time to requests over the last hour.
- Cacheable Content Download Time (millisecs) Histogram. Shows download times for cached content for the number of requests and the response time in a column chart for the last hour.
- Performance (millisecs) Stats by Country. Provides an aggregation table of performance statistics by IP address per country code for the last hour.
- Performance (millisecs) Stats by Data Center. Provides an aggregation table of performance statistics by IP address per data center for the last hour.
CDN - Visitors
See where you're getting the most traffic and from where.
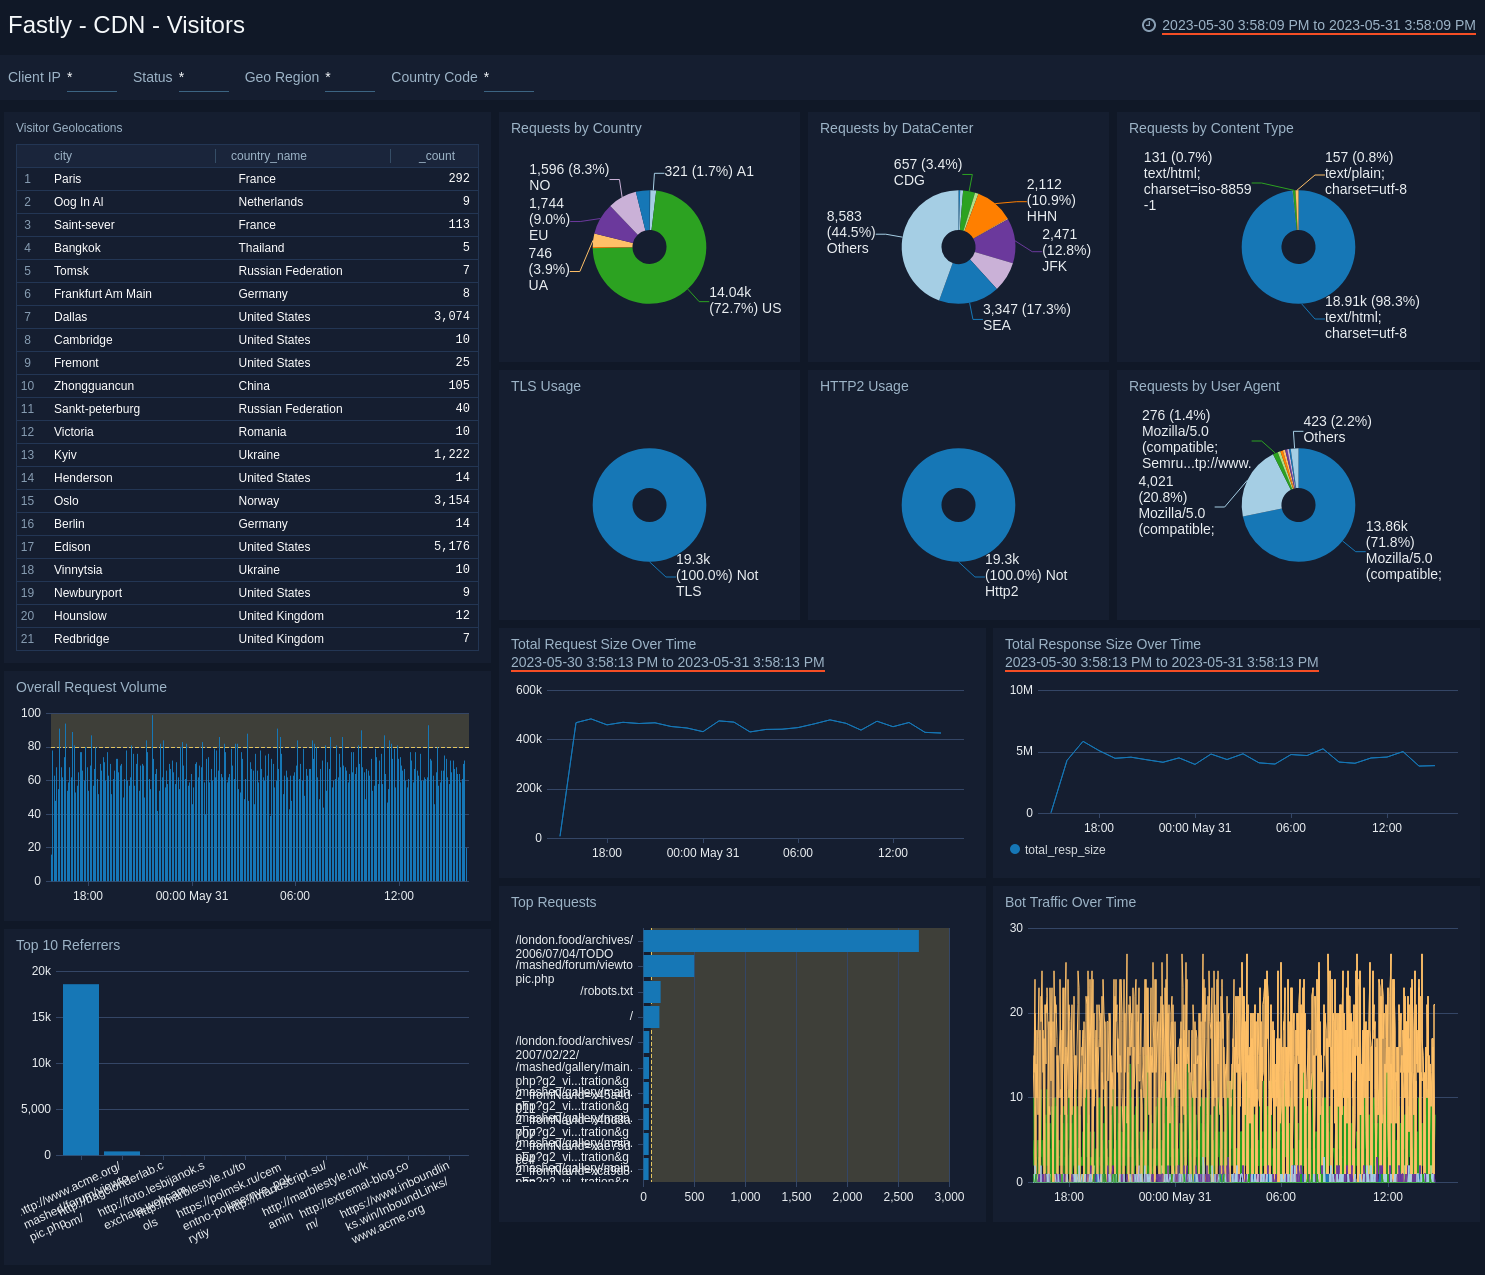
- Visitor Geolocations. See where your visitors originate with a map that provides the geolocation of visitor IP addresses.
- Requests by Country. Percentage of requests by country to help you find the origin of traffic to Fastly.
- Requests by DataCenter. Percentage of requests by datacenter, see the percentage of requests in a pie chart.
- Requests by Content Type. Pie chart displaying the percentage of requests by content type.
- TLS Usage. Binary view of the percentage of users connecting using TLS versus non-TLS to track use of the protocol.
- HTTP2 Usage. Binary view of the percentage of users connecting using HTTP2 versus non-HTTP2 to track use of the protocol.
- Requests by User Agent. Pie chart of the percentage of requests by user agent for the last 60 minutes.
- Overall Request Volume. Shows the number of requests made in a column chart on a timeline using timeslices of five minutes over the last three hours.
- Total Request Size Over Time. Line chart of request sizes for the last day.
- Total Response Size over time. Line chart of response sizes for the last day.
- Top 10 Referrers. Displays top ten referrer requests as a bar chart for the last hour.
- Top Requests. Displays the top requests by path and count in a bar chart for the last hour.
- Bot Traffic Over Time. Displays bot traffic by volume for the last hour as a line chart.
WAF - Overview
See the overview of Fastly WAF including the states, hits, and threat intel on warning and blocked events.
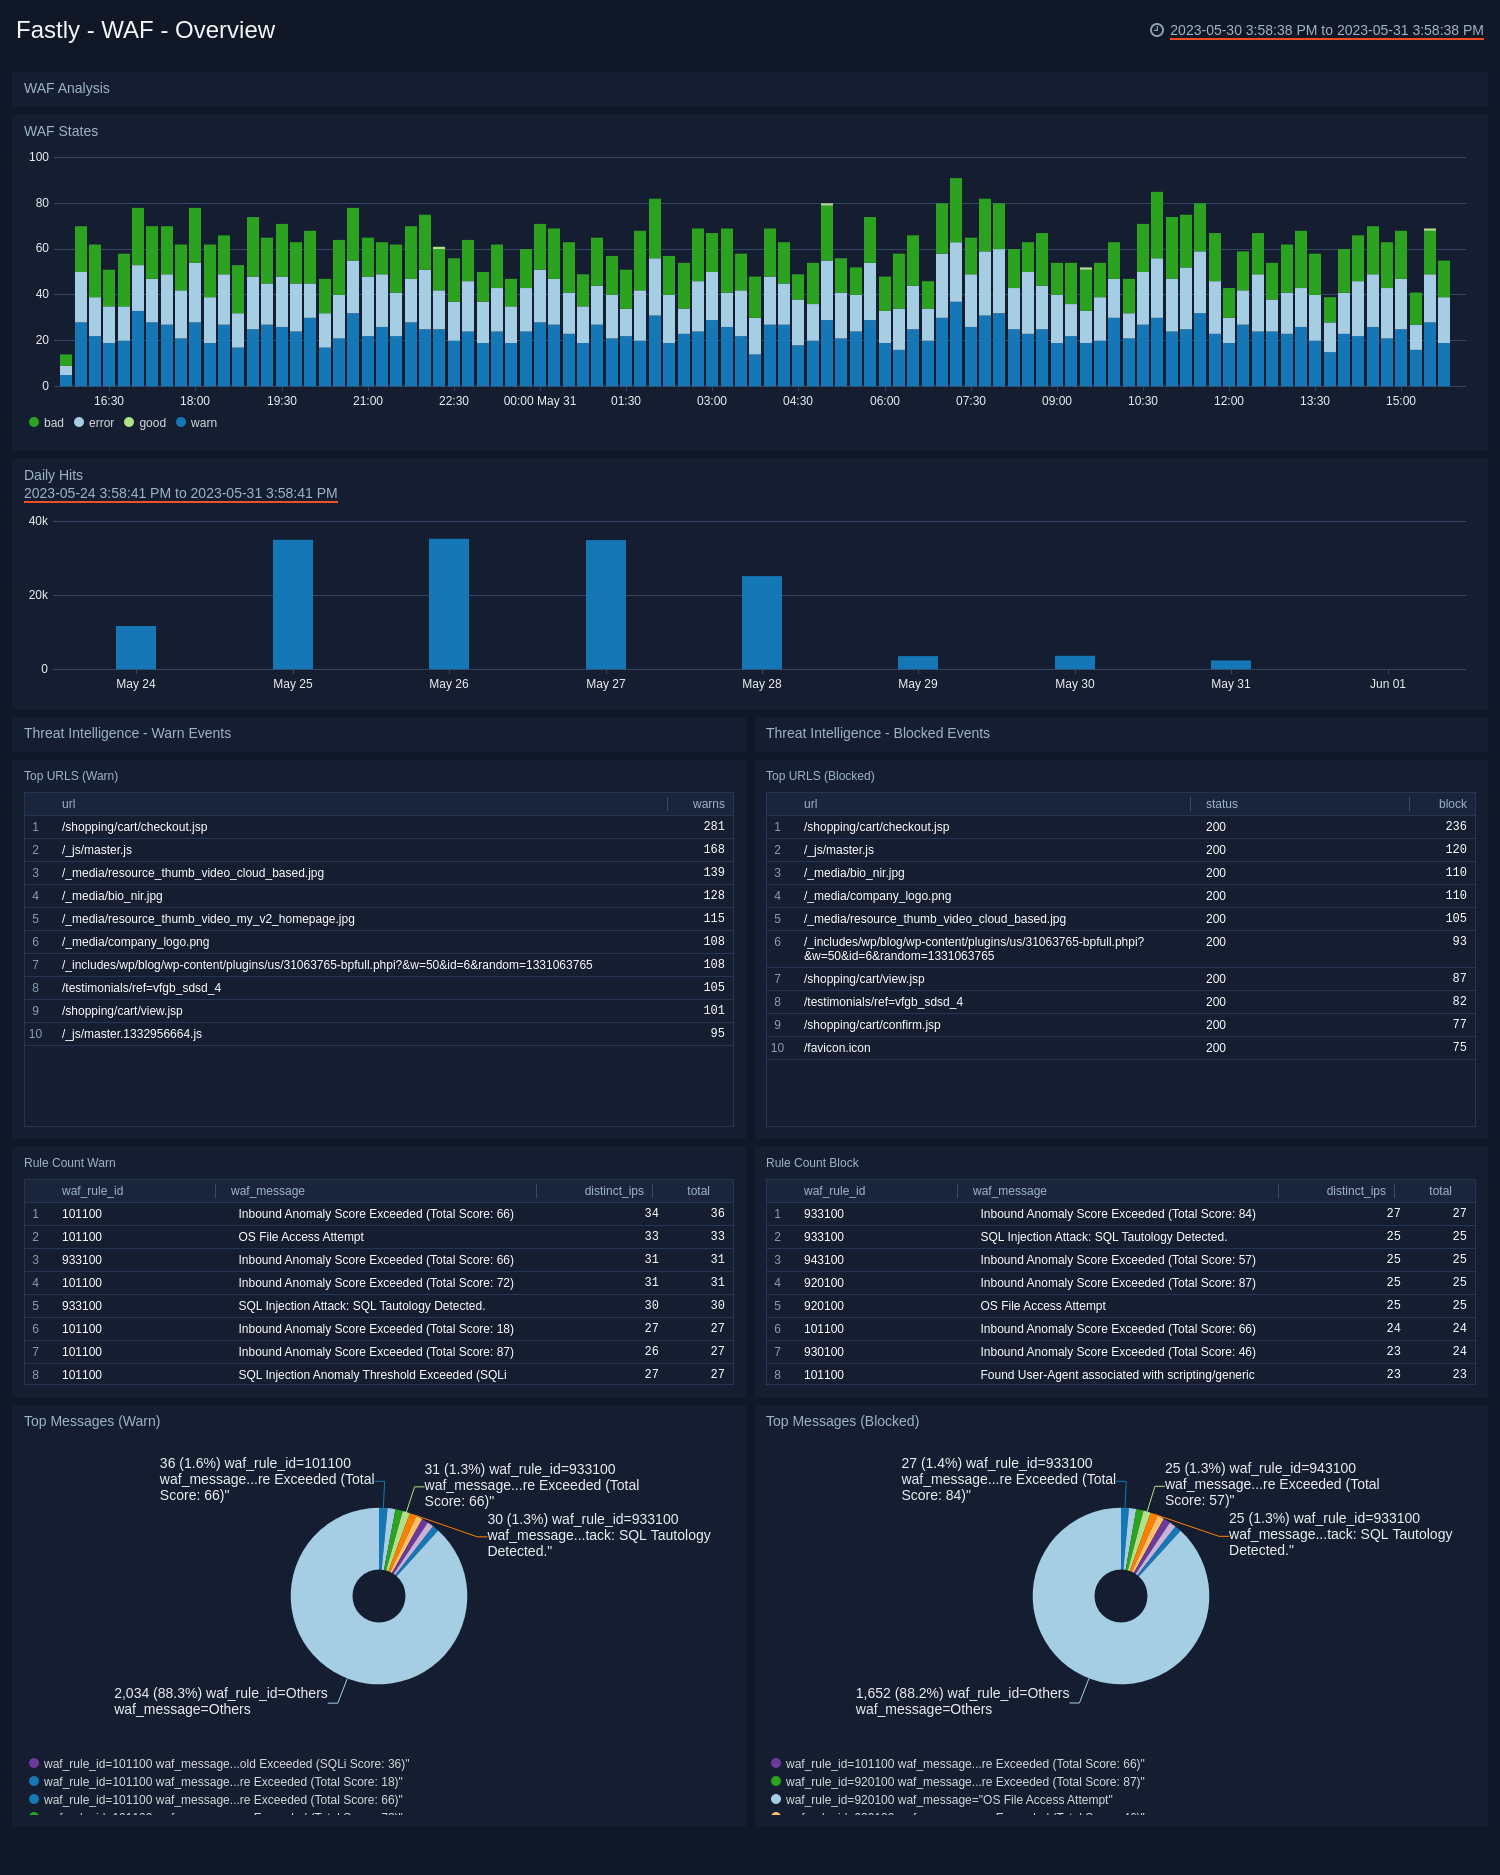
- WAF Analysis
- WAF States. See the count of requests that triggered WAF. It shows if the request triggered a rule(s) but passed to origin (warn), was blocked (bad), went through WAF and triggered no rules (good), cause an error (failure) for the last 24 hour as a line chart.
- Daily Hits. See the count of requests that triggered WAF in the last 7 days on a bar chart.
The following panels are grouped as blocking and warning (which triggered a rule but passed to origin) events.
- Threat Intelligence - Warn Events
- Top URLs (Warn). See the count of top URLs for warning events in the last 24 hours in a table.
- Rule Count (Warn). See the details of rules for warning events including the WAF rule ID, WAF message, count of distinct IPs, and total count, in the last 24 hours displayed in a table.
- Top Messages (Warn). See the count and percentage of WAF messages for warning events in the last 24 hours on a pie chart.
- Threat Intelligence - Blocked Events
- Top URLs (Blocked). See the count and status of top URLs for blocked events in the last 24 hours in a table.
- Rule Count (Blocked). See the details of rules for blocked events including the WAF rule ID, WAF message, count of distinct IPs, and total count, in the last 24 hours displayed in a table.
- Top Messages (Blocked). See the count and percentage of WAF messages for blocked events in the last 24 hours on a pie chart.
WAF - Offenders
See the details on WAF offenders including the location, client IP addresses for warning and blocked events, and OWASP offenders in different attack categories and threshold exceptions.
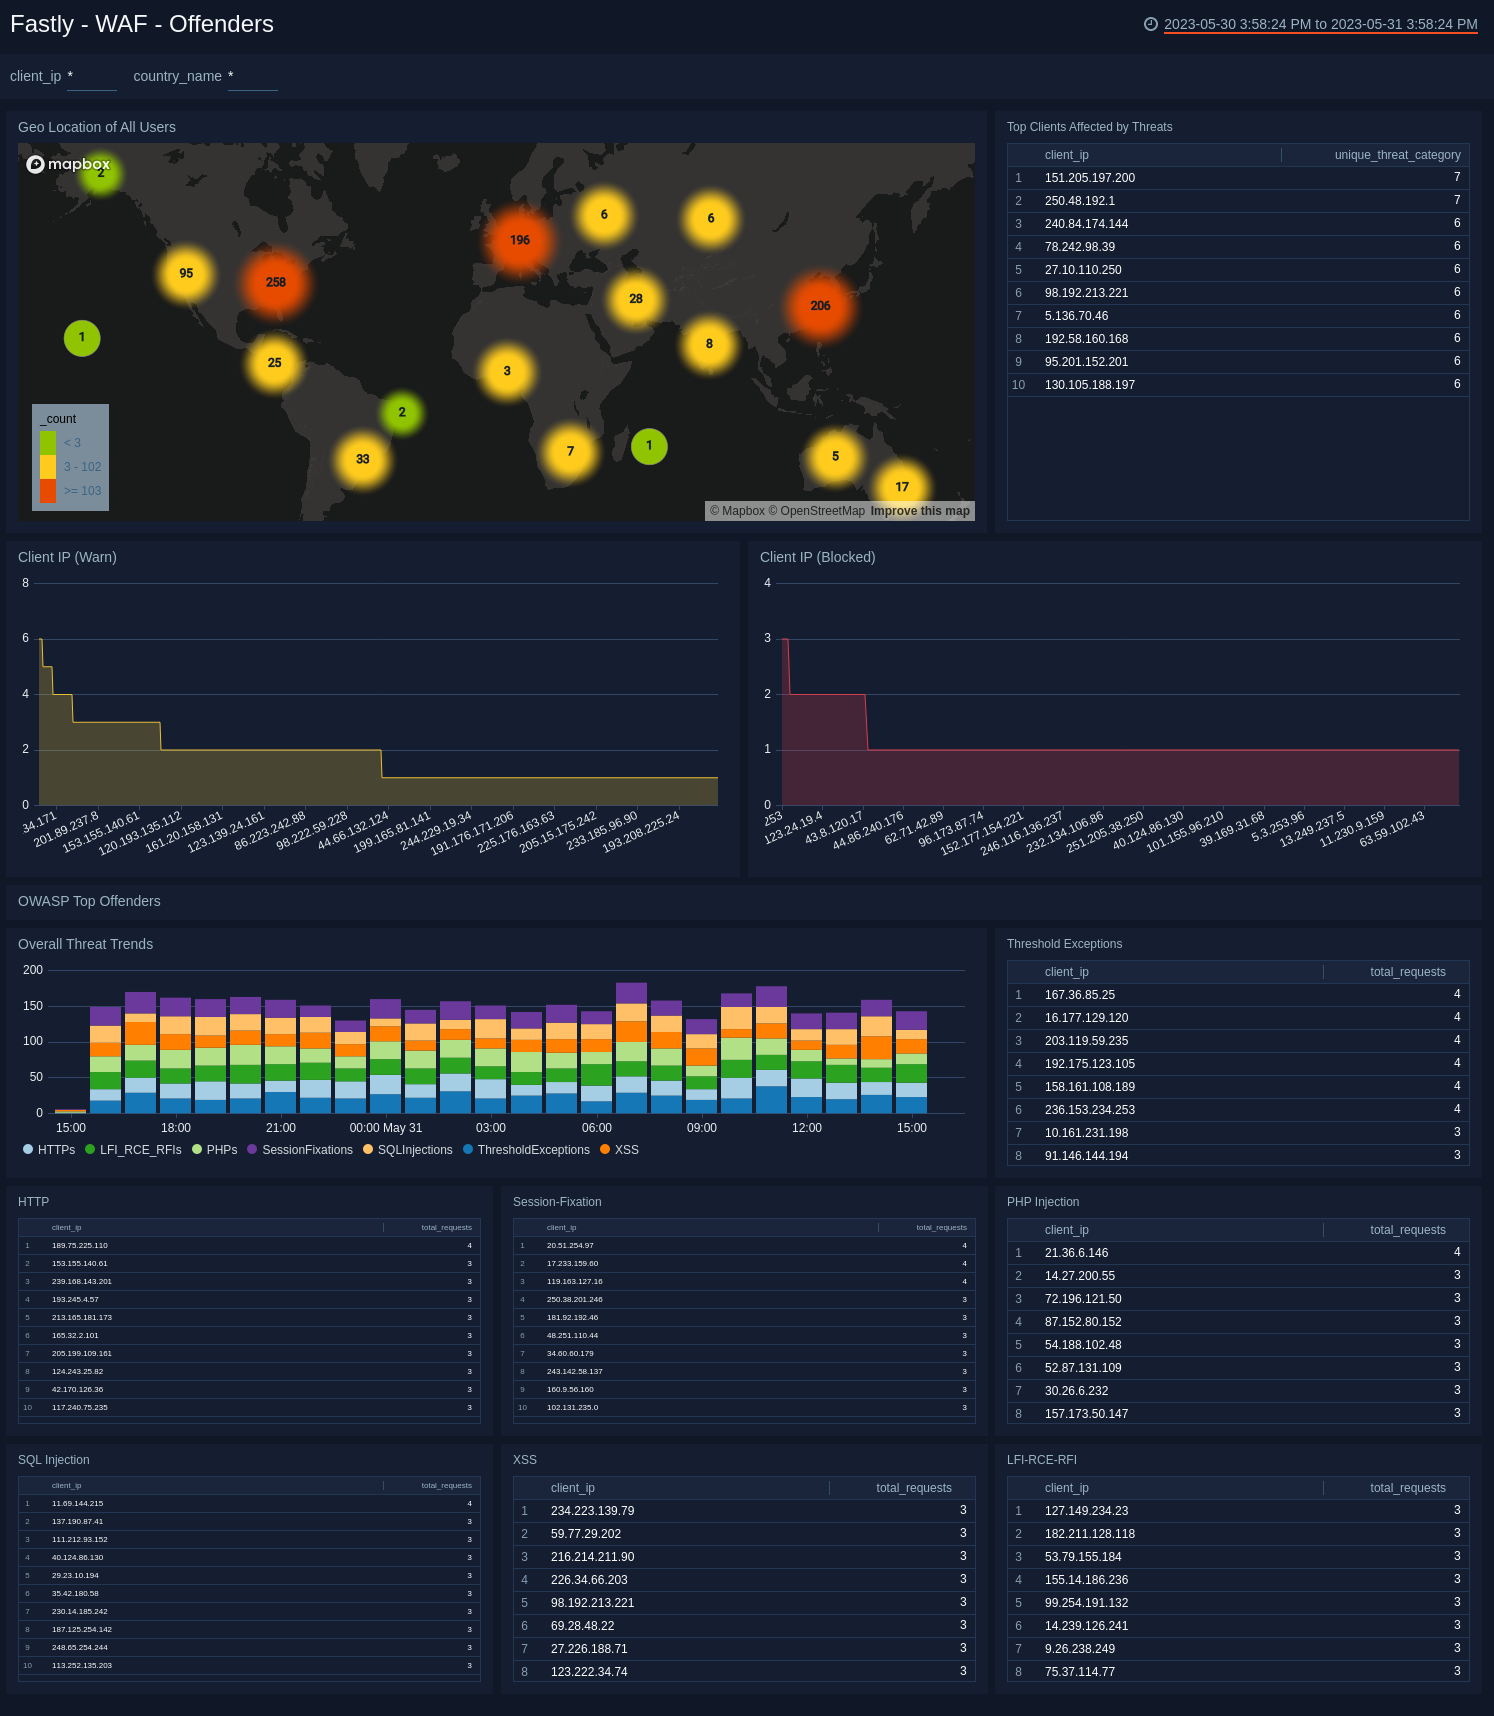
- Geo Location of All Users. See the count and user location where WAF was executed in the last 24 hours on a world map.
- Top Clients affected by Threats. See the top 10 client IP addresses by count that are affected by threats in the last 24 hours.
- Client IP (Warn). See the count of IP addresses for warning events in the last 24 hours on a column chart.
- Client IP (Blocked). See the count of IP addresses for blocked events in the last seven days on a column chart.
- OWASP Top Offenders. The following panels show the top 10 client IP addresses that trigger WAF in block and monitor mode in different attack categories and the threshold exceptions.
- Overall Threat Trends. See the trend in the overall threats in the last 24 hours on a stacked column chart.
- Threshold Exceptions. See the top 10 IP addresses by count triggering the threshold exception rule in the last 24 hours displayed in a table.
- HTTP. See the top 10 IP addresses by count triggering HTTP exception rule in the last 24 hours.
- Session Fixation. See the top 10 IP addresses by count triggering the session fixation rule in the last 24 hours.
- PHP Injection. See the top 10 IP addresses by count triggering the PHP injection rule in the last 24 hours.
- SQL Injection. See the top 10 IP addresses by count triggering the SQL injection rule in the last 24 hours.
- XSS. See the top 10 IP addresses by count triggering the XSS rule in the last 24 hours.
- LFI-RCE-RFI. See the top 10 IP addresses by count triggering the local file inclusion, remote file inclusion, and remote code execution rules in the last 24 hours.
WAF - OWASP
See the overall Open Web Application Security Project (OWASP) anomaly score quartiles and by rule category.
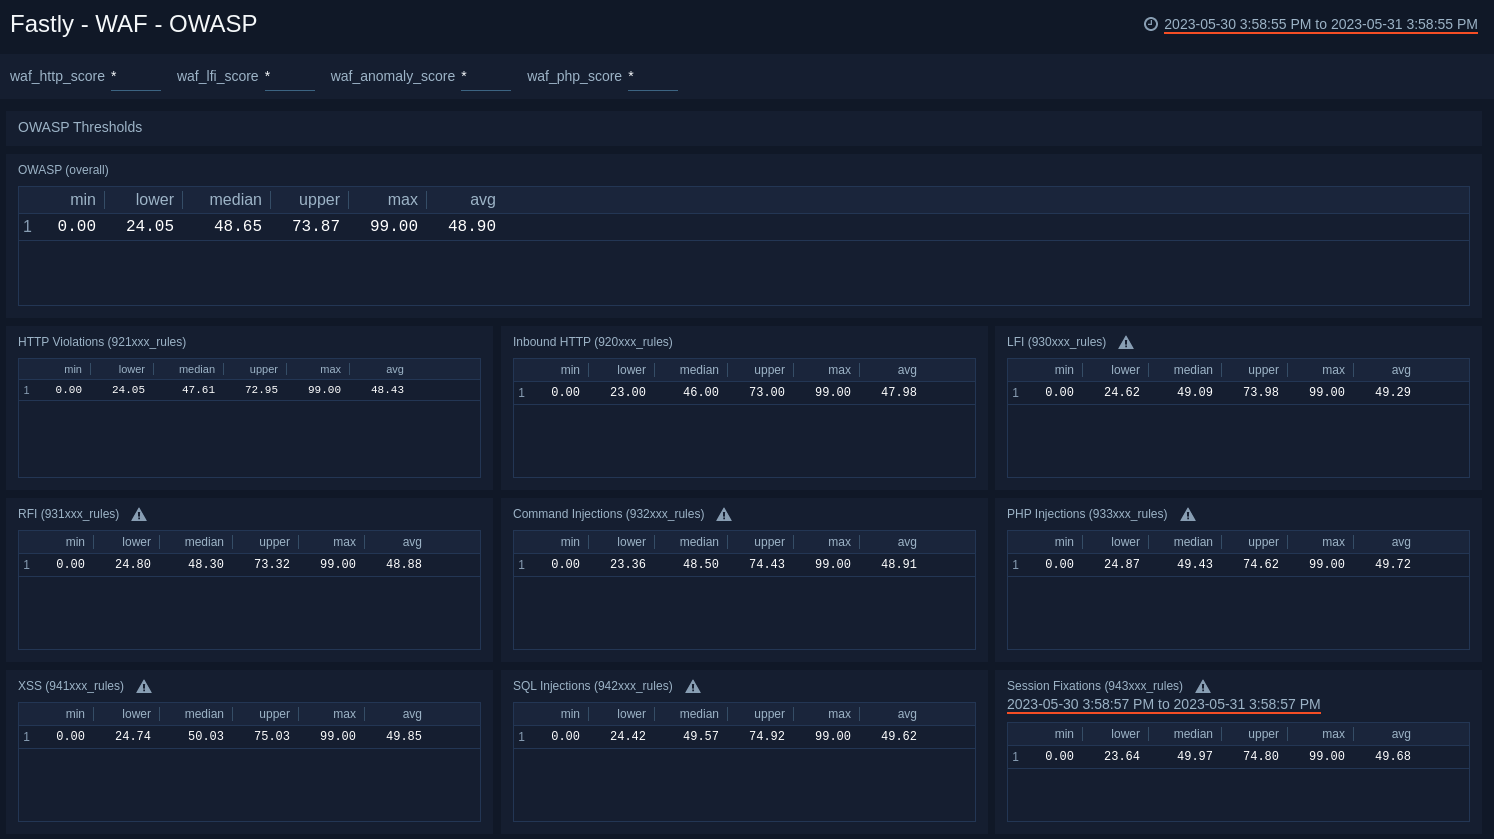
- OWASP Thresholds. The panels in this dashboard show the overall anomaly score quartiles and by rule category. They show the following statistics: minimum, 25th percentile, median, 75th percentile, maximum, and the average in the last hour, for each of the following:
- OWASP Overall.
- HTTP Violations.
- Inbound HTTP.
- LFI (Local File Inclusion)
- RFI (Remote File Inclusion).
- Command Injections.
- PHP Injections.
- XSS (Cross-site Scripting)
- SQL Injections.
- Session Fixations.
Upgrade/Downgrade the Fastly app (Optional)
To update the app, do the following:
Next-Gen App: To install or update the app, you must be an account administrator or a user with Manage Apps, Manage Monitors, Manage Fields, Manage Metric Rules, and Manage Collectors capabilities depending upon the different content types part of the app.
- Select App Catalog.
- In the Search Apps field, search for and then select your app.
Optionally, you can identify apps that can be upgraded in the Upgrade available section. - To upgrade the app, select Upgrade from the Manage dropdown.
- If the upgrade does not have any configuration or property changes, you will be redirected to the Preview & Done section.
- If the upgrade has any configuration or property changes, you will be redirected to the Setup Data page.
- In the Configure section of your respective app, complete the following fields.
- Field Name. If you already have collectors and sources set up, select the configured metadata field name (eg _sourcecategory) or specify other custom metadata (eg: _collector) along with its metadata Field Value.
- Click Next. You will be redirected to the Preview & Done section.
Post-update
Your upgraded app will be installed in the Installed Apps folder and dashboard panels will start to fill automatically.
See our Release Notes changelog for new updates in the app.
To revert the app to a previous version, do the following:
- Select App Catalog.
- In the Search Apps field, search for and then select your app.
- To version down the app, select Revert to < previous version of your app > from the Manage dropdown.
Uninstalling the Fastly app (Optional)
To uninstall the app, do the following:
- Select App Catalog.
- In the 🔎 Search Apps field, run a search for your desired app, then select it.
- Click Uninstall.