Miro
The Sumo Logic app for Miro provides visibility into Miro audit logs to ensure the security and compliance of your Miro environment. The app leverages the Miro cloud-to-cloud source to collect audit log data and provides pre-built dashboards and visualizations to enable security teams to easily monitor and investigate potential security threats.
The app provides a comprehensive overview of key security events and user activity. It includes widgets that track key metrics such as total events, board events, team events, sign-in security events, and more. Additionally, it offers insights into the distribution of sign-in security events and sign-ins over time by authentication methods. The dashboard also highlights sign-ins from risky geo-locations, which helps you to quickly identify potential security threats and take appropriate actions to mitigate them. These widgets help you to monitor your account performance, identify improvement areas, and ensure their data's security. With these widgets, you can easily monitor and manage their security posture, ensuring your data and systems remain secure and protected.
With the Sumo Logic app for Miro, security teams can stay on top of potential security threats, proactively identify vulnerabilities, and respond quickly to security incidents.
Log types
This App uses Sumo Logic’s Miro Source to collect Audit Logs from Miro.
Sample log messages
{
      "type": "event",
      "event": "board_opened",
      "details": {
        "role": "OWNER"
      },
      "createdAt": "2018-10-19T23:59:45Z",
      "createdBy": {
        "type": "user",
        "name": "Test",
        "id": "3074457346235995512",
      },
      "object": {
        "id": "3074457346235995523",
        "name": "BoardName"
      },
      "context": {
        "organization": {
                      "type": "organization",
          "name": "CompanyName",
          "id": "3074457345821140123"
        },
        "team": {
          "type": "team",
          "name": "TeamName",
          "id": "3074457345710755694"
        },
        "ip": "10.10.10.10"
      },
      "id": "450256789"
}
Sample queries
_sourceCategory=miro
| json "id", "type", "context.team.name", "context.organization.name", "context.ip", "createdAt", "event", "createdBy.name", "createdBy.email" as id, type, team_name, organization_name, ip, createdAt, event, user_name, user_email nodrop
| where organization_name matches "{{organization}}"
| where team_name matches "{{team}}"
| where event matches "{{event}}"
| count_distinct (id)
Collection configuration and app installation
Depending on the set up collection method, you can configure and install the app in three ways:
- Create a new collector and install the app. Create a new Sumo Logic Cloud-to-Cloud (C2C) source under a new Sumo Logic Collector and later install the app, or
- Use an existing collector and install the app. Create a new Sumo Logic Cloud-to-Cloud (C2C) source under an existing Sumo Logic Collector and later install the app, or
- Use existing source and install the app. Use your existing configured Sumo Logic Cloud-to-Cloud (C2C) source and install the app.
Use the Cloud-to-Cloud Integration for Miro to create the source and use the same source category while installing the app. By following these steps, you can ensure that your Miro app is properly integrated and configured to collect and analyze your Miro data.
Create a new collector and install the app
To set up collection and install the app, do the following:
Next-Gen App: To install or update the app, you must be an account administrator or a user with Manage Apps, Manage Monitors, Manage Fields, Manage Metric Rules, and Manage Collectors capabilities depending upon the different content types part of the app.
- Select App Catalog.
- In the 🔎 Search Apps field, run a search for your desired app, then select it.
- Click Install App.
note
Sometimes this button says Add Integration.
- In the Set Up Collection section of your respective app, select Create a new Collector.
- Collector Name. Enter a Name to display the Source in the Sumo Logic web application. The description is optional.
- Timezone. Set the default time zone when it is not extracted from the log timestamp. Time zone settings on Sources override a Collector time zone setting.
- (Optional) Metadata. Click the +Add Metadata link to add a custom log Metadata Fields. Define the fields you want to associate, each metadata field needs a name (key) and value.
 A green circle with a checkmark is shown when the field exists and is enabled in the Fields table schema.
 An orange triangle with an exclamation point is shown when the field doesn't exist, or is disabled, in the Fields table schema. In this case, an option to automatically add or enable the nonexistent fields to the Fields table schema is provided. If a field is sent to Sumo that does not exist in the Fields schema or is disabled it is ignored, known as dropped.
- Click Next.
- Configure the source as specified in the
Infobox above, ensuring all required fields are included. - In the Configure section of your respective app, complete the following fields.
- Field Name. If you already have collectors and sources set up, select the configured metadata field name (eg _sourcecategory) or specify other custom metadata (eg: _collector) along with its metadata Field Value.
- Click Next. You will be redirected to the Preview & Done section.
Post-installation
Once your app is installed, it will appear in your Installed Apps folder, and dashboard panels will start to fill automatically.
Each panel slowly fills with data matching the time range query received since the panel was created. Results will not immediately be available but will be updated with full graphs and charts over time.
Use an existing collector and install the app
To set up the source in the existing collector and install the app, do the following:
Next-Gen App: To install or update the app, you must be an account administrator or a user with Manage Apps, Manage Monitors, Manage Fields, Manage Metric Rules, and Manage Collectors capabilities depending upon the different content types part of the app.
- Select App Catalog.
- In the 🔎 Search Apps field, run a search for your desired app, then select it.
- Click Install App.
note
Sometimes this button says Add Integration.
- In the Set Up Collection section of your respective app, select Use an existing Collector.
- From the Select Collector dropdown, select the collector that you want to set up your source with and click Next.
- Configure the source as specified in the
Infobox above, ensuring all required fields are included. - In the Configure section of your respective app, complete the following fields.
- Field Name. If you already have collectors and sources set up, select the configured metadata field name (eg _sourcecategory) or specify other custom metadata (eg: _collector) along with its metadata Field Value.
- Click Next. You will be redirected to the Preview & Done section.
Post-installation
Once your app is installed, it will appear in your Installed Apps folder, and dashboard panels will start to fill automatically.
Each panel slowly fills with data matching the time range query received since the panel was created. Results will not immediately be available but will be updated with full graphs and charts over time.
Use an existing source and install the app
To skip collection and only install the app, do the following:
Next-Gen App: To install or update the app, you must be an account administrator or a user with Manage Apps, Manage Monitors, Manage Fields, Manage Metric Rules, and Manage Collectors capabilities depending upon the different content types part of the app.
- Select App Catalog.
- In the 🔎 Search Apps field, run a search for your desired app, then select it.
- Click Install App.
note
Sometimes this button says Add Integration.
- In the Set Up Collection section of your respective app, select Skip this step and use existing source and click Next.
- In the Configure section of your respective app, complete the following fields.
- Field Name. If you already have collectors and sources set up, select the configured metadata field name (eg _sourcecategory) or specify other custom metadata (eg: _collector) along with its metadata Field Value.
- Click Next. You will be redirected to the Preview & Done section.
Post-installation
Once your app is installed, it will appear in your Installed Apps folder, and dashboard panels will start to fill automatically.
Each panel slowly fills with data matching the time range query received since the panel was created. Results will not immediately be available but will be updated with full graphs and charts over time.
Viewing Miro dashboards
All dashboards have a set of filters that you can apply to the entire dashboard. Use these filters to drill down and examine the data to a granular level.
- You can change the time range for a dashboard or panel by selecting a predefined interval from a drop-down list, choosing a recently used time range, or specifying custom dates and times. Learn more.
- You can use template variables to drill down and examine the data on a granular level. For more information, see Filtering Dashboards with Template Variables.
- Most Next-Gen apps allow you to provide the scope at the installation time and are comprised of a key (
_sourceCategoryby default) and a default value for this key. Based on your input, the app dashboards will be parameterized with a dashboard variable, allowing you to change the dataset queried by all panels. This eliminates the need to create multiple copies of the same dashboard with different queries.
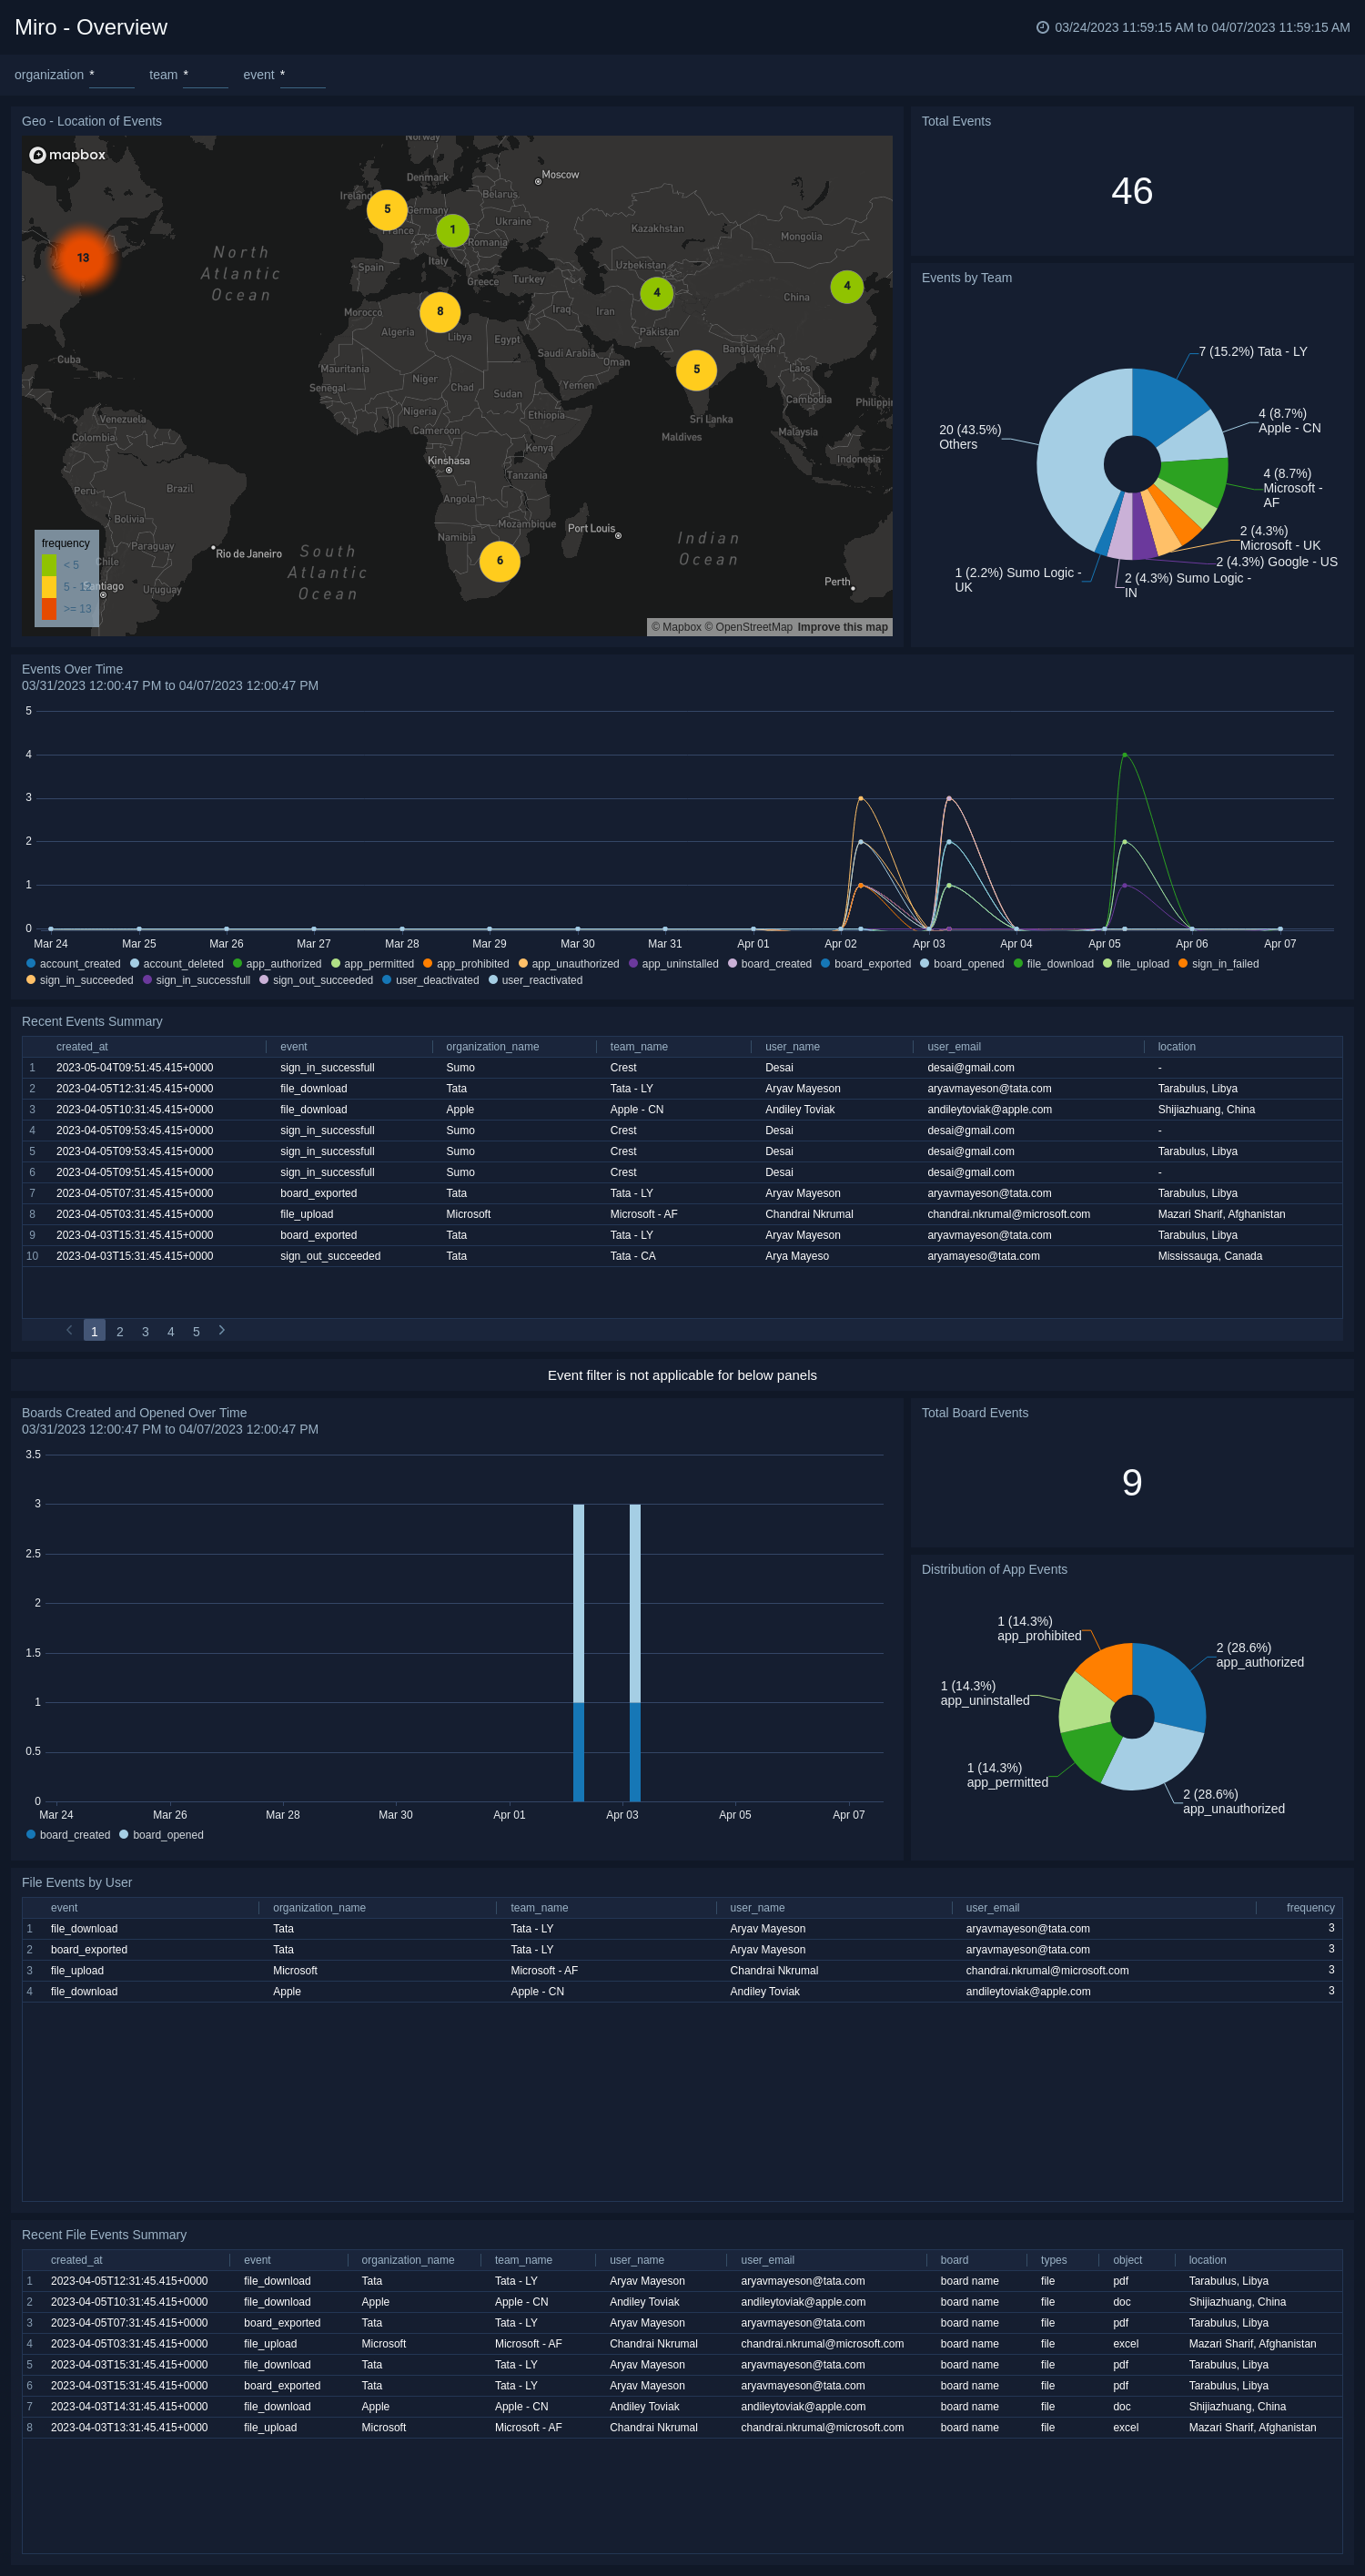
Overview
The Miro - Overview dashboard provides a comprehensive overview of events related to Miro. The dashboard features various widgets, including Total Events, Total Board Events, Distribution of App Events, Events By Team, Boards Created and Opened over Time, Events Over Time, Geo-Location of Events, Recent File Event Summary, and Recent Event Summary.
The widgets allow you to track and analyze event-related information, including the total number of events, their distribution, team-wise breakdown, creation and opening of boards over time, and their geographical locations. The Recent File Event Summary and Recent Event Summary widgets provide a summary of the latest events for quick reference. A dashboard is a useful tool for monitoring and improving event management by providing quick access to relevant information.
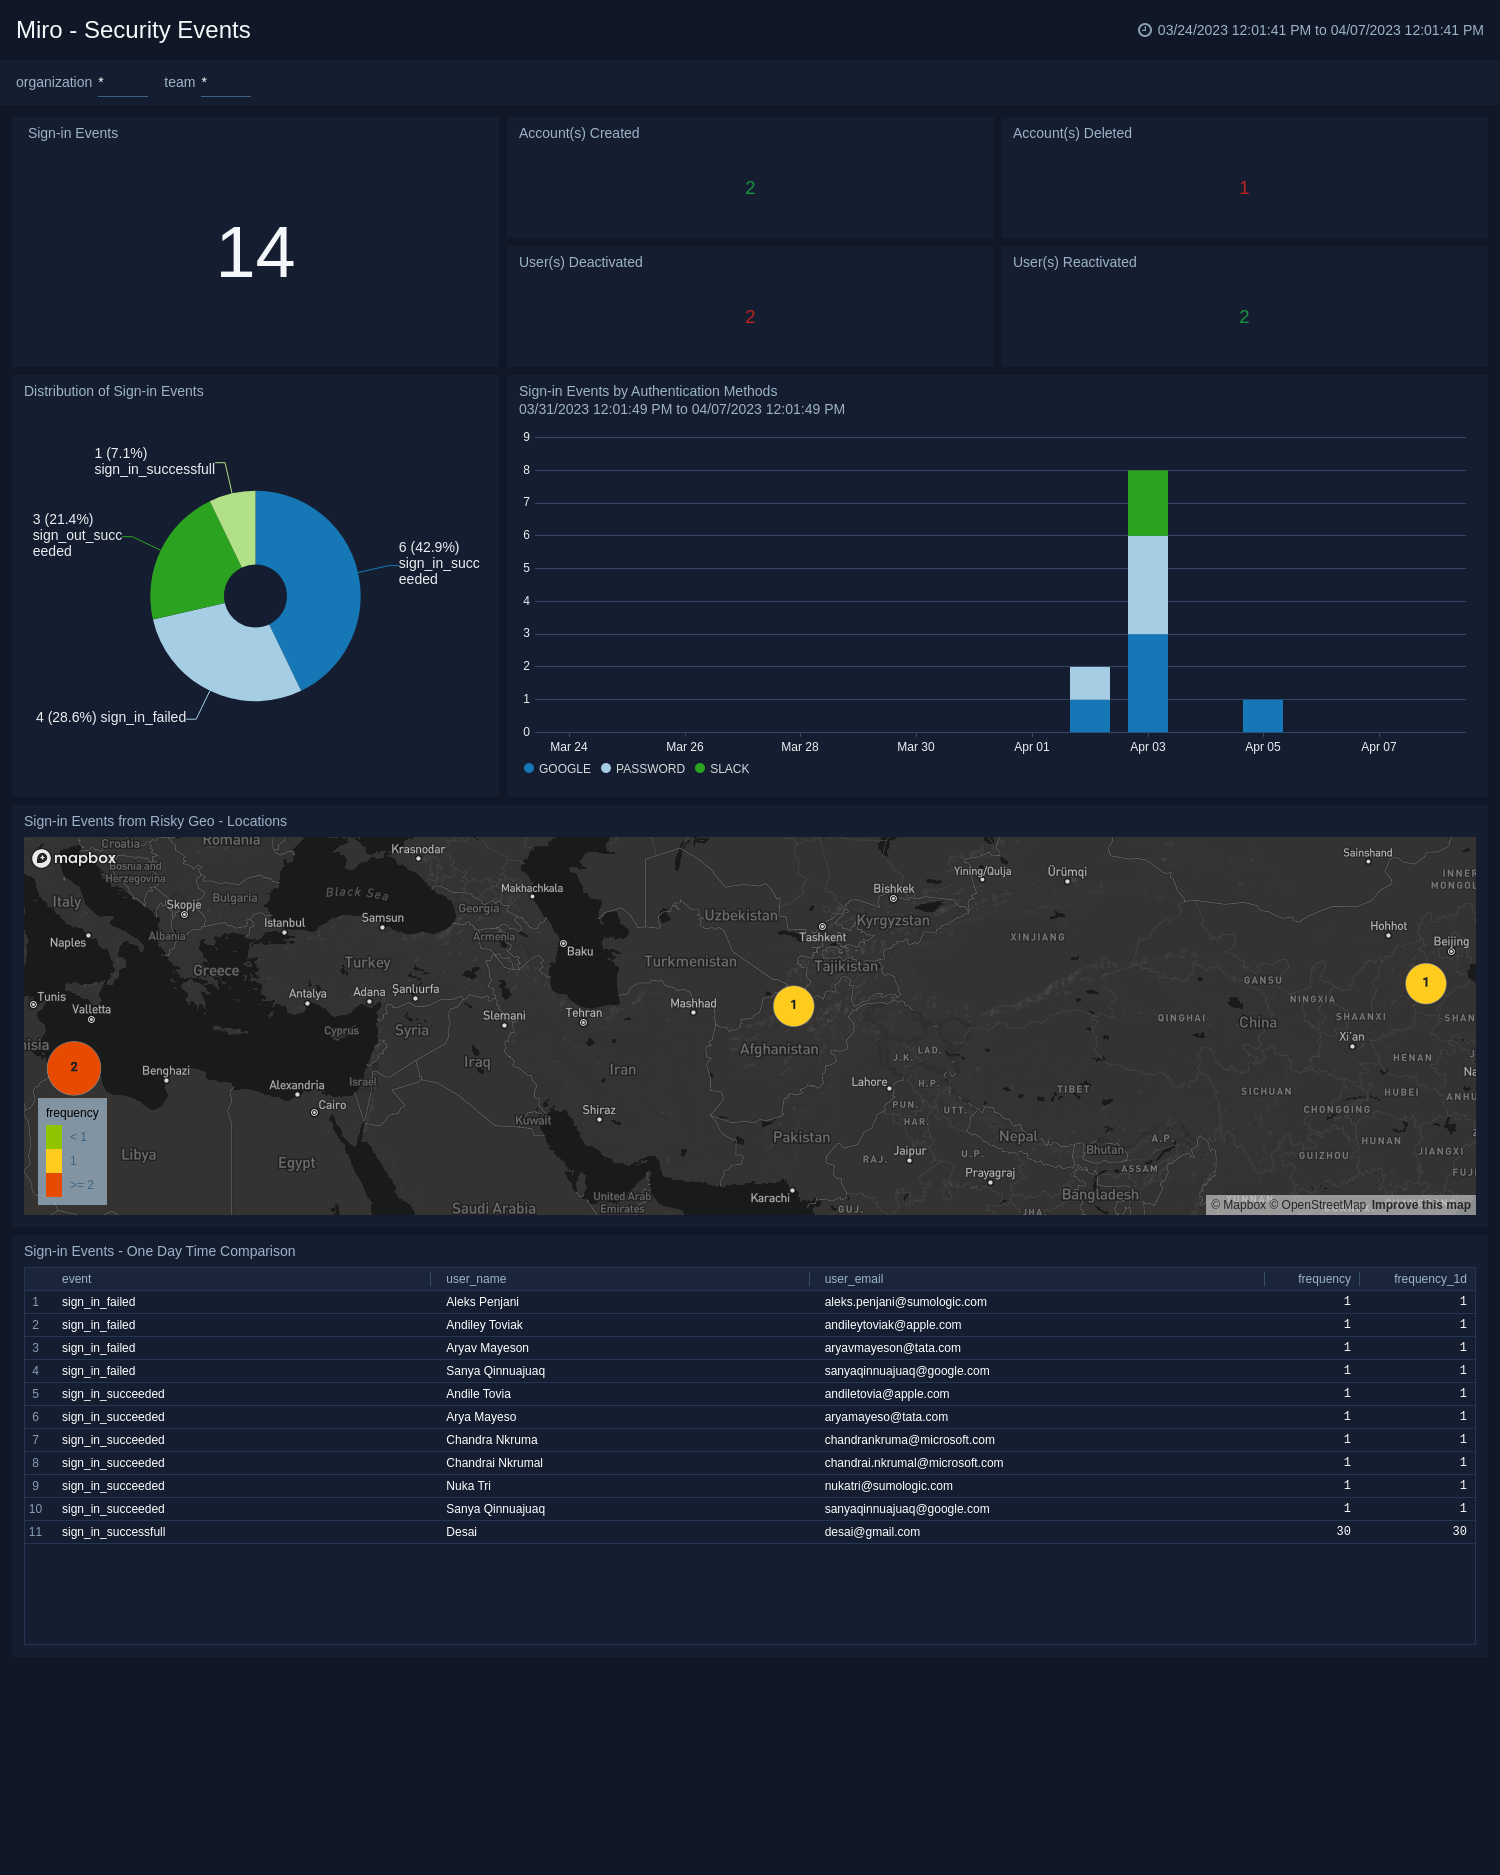
Security Events
The Miro - Security Events dashboard provides a comprehensive overview of your security events related to Miro. The dashboard features various widgets, including Sign-in Security Events, Account(s) Created, Account(s) Deleted, User(s) Deactivated, User(s) Reactivated, Distribution of Sign-in Security Events, Sign-In over time by Authentication Methods, and Sign-in from Risky Geo-Locations.
The widgets allow you to track and analyze your security events, including the number of sign-in security events, account creation, deletion, deactivation, and reactivation. The Distribution of Sign-in Security Events widget provides an overview of sign-in patterns across different events, while the Sign-in over time by Authentication Methods widget offers a breakdown of sign-ins by the authentication method. The Sign-in from Risky Geo-Locations widget helps you to identify geographic locations that pose a higher risk to your security. A dashboard is a useful tool for monitoring and improving your security by providing quick access to relevant information.
Upgrade/Downgrade the Miro app (Optional)
To update the app, do the following:
Next-Gen App: To install or update the app, you must be an account administrator or a user with Manage Apps, Manage Monitors, Manage Fields, Manage Metric Rules, and Manage Collectors capabilities depending upon the different content types part of the app.
- Select App Catalog.
- In the Search Apps field, search for and then select your app.
Optionally, you can identify apps that can be upgraded in the Upgrade available section. - To upgrade the app, select Upgrade from the Manage dropdown.
- If the upgrade does not have any configuration or property changes, you will be redirected to the Preview & Done section.
- If the upgrade has any configuration or property changes, you will be redirected to the Setup Data page.
- In the Configure section of your respective app, complete the following fields.
- Field Name. If you already have collectors and sources set up, select the configured metadata field name (eg _sourcecategory) or specify other custom metadata (eg: _collector) along with its metadata Field Value.
- Click Next. You will be redirected to the Preview & Done section.
Post-update
Your upgraded app will be installed in the Installed Apps folder and dashboard panels will start to fill automatically.
See our Release Notes changelog for new updates in the app.
To revert the app to a previous version, do the following:
- Select App Catalog.
- In the Search Apps field, search for and then select your app.
- To version down the app, select Revert to < previous version of your app > from the Manage dropdown.
Uninstalling the Miro app (Optional)
To uninstall the app, do the following:
- Select App Catalog.
- In the 🔎 Search Apps field, run a search for your desired app, then select it.
- Click Uninstall.