PagerDuty V2

The Sumo Logic App for PagerDuty V2 collects incident messages from your PagerDuty account via a webhook, and displays incident data in pre-configured Dashboards that allow you to monitor and analyze the activity of your PagerDuty account and Services. The Sumo Logic App for PagerDuty V2 uses Webhooks V2, to provide enhanced context for alert object models.
Event types
The Sumo Logic App for PagerDuty V2 ingests PagerDuty incident Webhooks V2 messages, that are triggered by events that occur in your PagerDuty account and Services.
For more information on the incident messages supported in Webhooks V2, see the PagerDuty documentation: https://v2.developer.pagerduty.com/docs/webhooks-v2-overview
Sample log messages
For examples of incident.trigger, incident.acknowledge, incident.resolve, and incident.assign log messages, see the PagerDuty Webhooks V2 Examples page.
Sample queries
The following Top Altering Services query is shown on the PagerDuty V2 - Overview dashboard.
_sourceCategory=Labs/pagerduty_v2 "incident.trigger"
| parse regex "(?<event>\{\"event\":\"incident\..+?\}(?=,\{\"event\":\"incident\..+|\]\}$))" multi
| json  field=event "event","log_entries", "created_on", "incident", "webhook"
| json field=incident "id", "incident_number", "escalation_policy.summary", "service.name" , "impacted_services[*].summary", "status", "summary", "description", "title", "urgency", "teams[0].summary", "assignments[0].assignee.summary" as incident_id, incident_number, escalation_policy_name, alertedBy_service, impacted_service, incident_status, incident_summary, incident_description, incident_tittle, incident_urgency,  incident_team_involved, assigned_user
| where event = "incident.trigger"
| count by alertedBy_service
| order by _count
Collecting logs for PagerDuty V2
This section provides instructions for configuring a Sumo Logic Hosted Collector and HTTP Source to create a PagerDuty Webhook V2, to collect PagerDuty events.
Configure a Sumo Logic Collector and Source
A Hosted Collector is not installed on a local system in your deployment. Instead, Sumo Logic hosts the Collector and its Sources in AWS. With a Hosted Collector, you can create Sources to collect data from various services. A single Hosted Collector can be configured with any number of Sources.
An HTTP Source is an endpoint for receiving log and metric data uploaded to a unique URL generated for the Source. The URL securely encodes the Collector and Source information. You can add as many HTTP Logs and Metrics Sources as you'd like to a single Hosted Collector.
To configure Hosted Collector and HTTP Source, do the following:
- Sign in to Sumo Logic.
- Follow the instructions for configuring a Hosted Collector.
- Follow the instructions for configuring an HTTP Source.
Make sure to save the HTTP Source Address URL. You will be asked for this Endpoint URL when you configure the PagerDuty Webhook in the following procedure.
Create a PagerDuty V2 Webhook
Using PagerDuty with Webhooks V2, you receive HTTP callbacks when incident events occur in your PagerDuty account. Details about the events are then sent via HTTP to a URL that you specify.
To create a PagerDuty V2 Webhook, do the following:
- Log in to your PagerDuty account.
- Use the following instructions to create a Webhook V2: https://support.pagerduty.com/hc/en-us/articles/202830320-Webhooks-, entering the HTTP Source Address URL as the Endpoint URL in Step 6.
- Continue with Installing the Sumo Logic App for PagerDuty V2.
Installing the PagerDuty V2 App
To install the app, do the following:
Next-Gen App: To install or update the app, you must be an account administrator or a user with Manage Apps, Manage Monitors, Manage Fields, Manage Metric Rules, and Manage Collectors capabilities depending upon the different content types part of the app.
- Select App Catalog.
- In the 🔎 Search Apps field, run a search for your desired app, then select it.
- Click Install App.
note
Sometimes this button says Add Integration.
- Click Next in the Setup Data section.
- In the Configure section of your respective app, complete the following fields.
- Field Name. If you already have collectors and sources set up, select the configured metadata field name (eg _sourcecategory) or specify other custom metadata (eg: _collector) along with its metadata Field Value.
- Click Next. You will be redirected to the Preview & Done section.
Post-installation
Once your app is installed, it will appear in your Installed Apps folder, and dashboard panels will start to fill automatically.
Each panel slowly fills with data matching the time range query received since the panel was created. Results will not immediately be available but will be updated with full graphs and charts over time.
Viewing PagerDuty v2 Dashboards
All dashboards have a set of filters that you can apply to the entire dashboard. Use these filters to drill down and examine the data to a granular level.
- You can change the time range for a dashboard or panel by selecting a predefined interval from a drop-down list, choosing a recently used time range, or specifying custom dates and times. Learn more.
- You can use template variables to drill down and examine the data on a granular level. For more information, see Filtering Dashboards with Template Variables.
- Most Next-Gen apps allow you to provide the scope at the installation time and are comprised of a key (
_sourceCategoryby default) and a default value for this key. Based on your input, the app dashboards will be parameterized with a dashboard variable, allowing you to change the dataset queried by all panels. This eliminates the need to create multiple copies of the same dashboard with different queries.
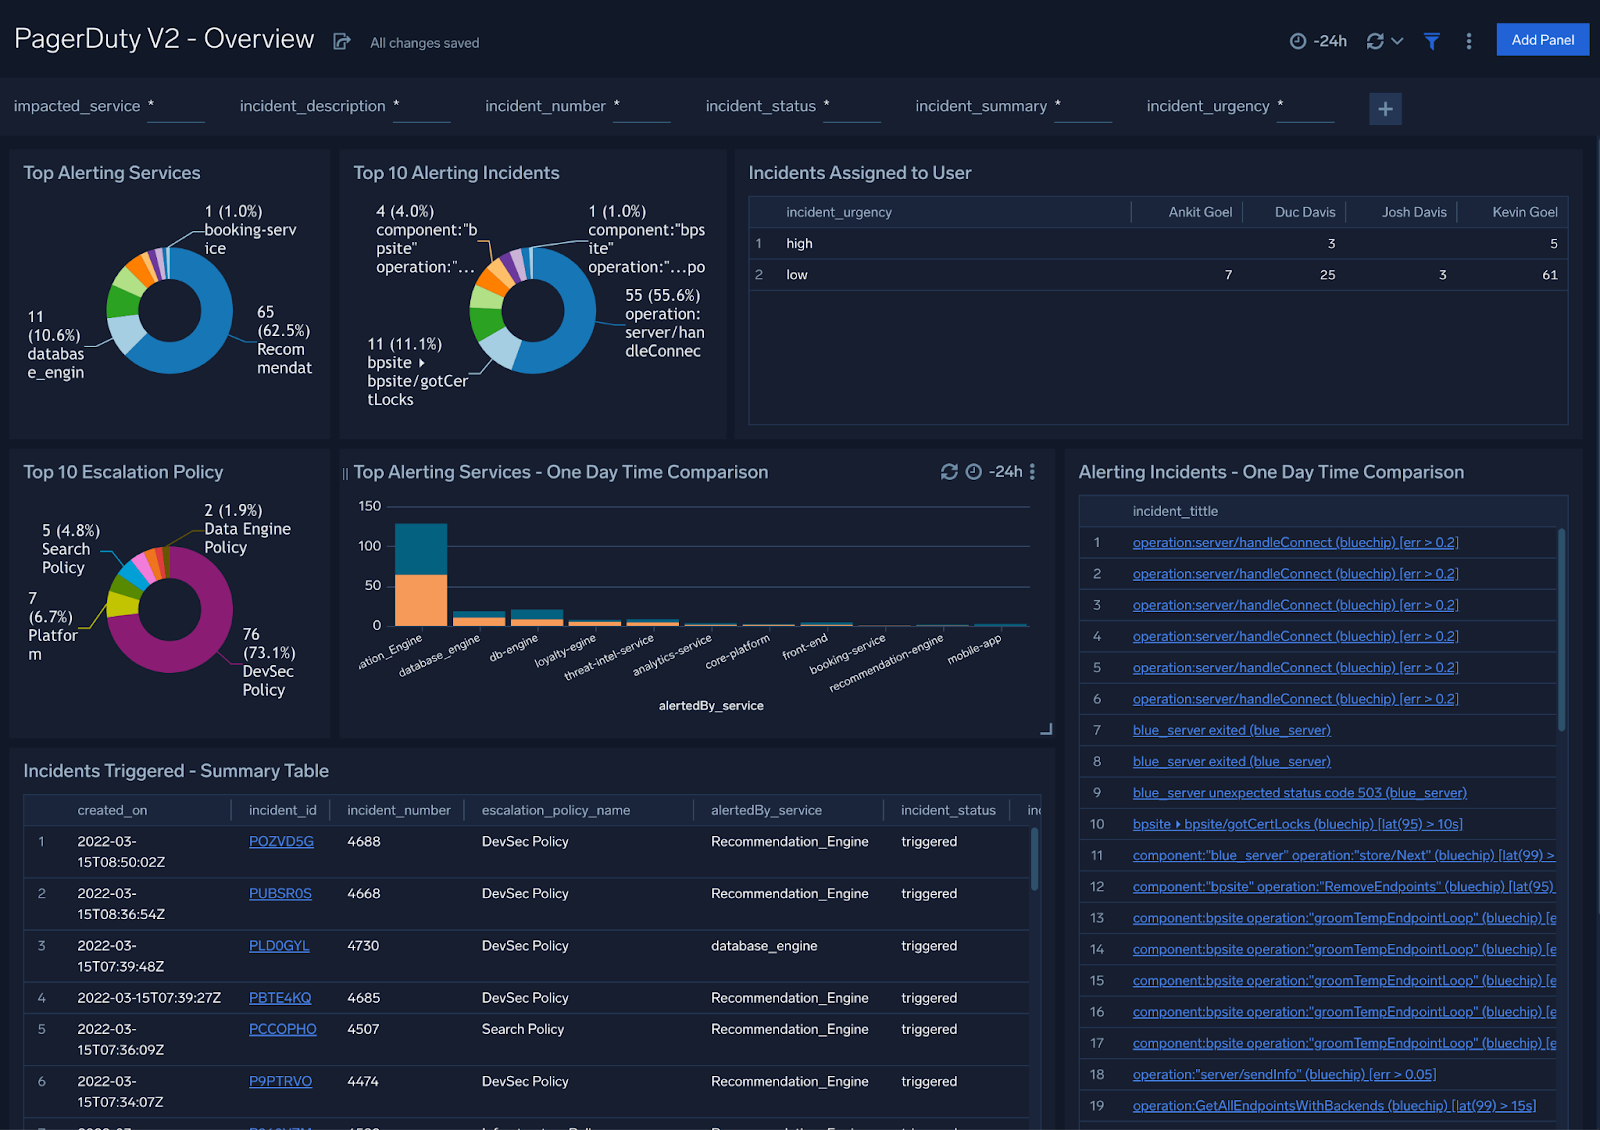
Overview
PagerDuty V2 - Overview Dashboard provides a high-level view of top alerts, triggered incidents summary, as well as a breakdown of per-user incident assignments and comparisons over a specified time interval.
Use this dashboard to:
- Review the services, incidents and policies that are causing the most alerts.
- Analyze detailed information on incidents using the Incident Summary panel.
- Drill down to examine data on a granular level with filters.
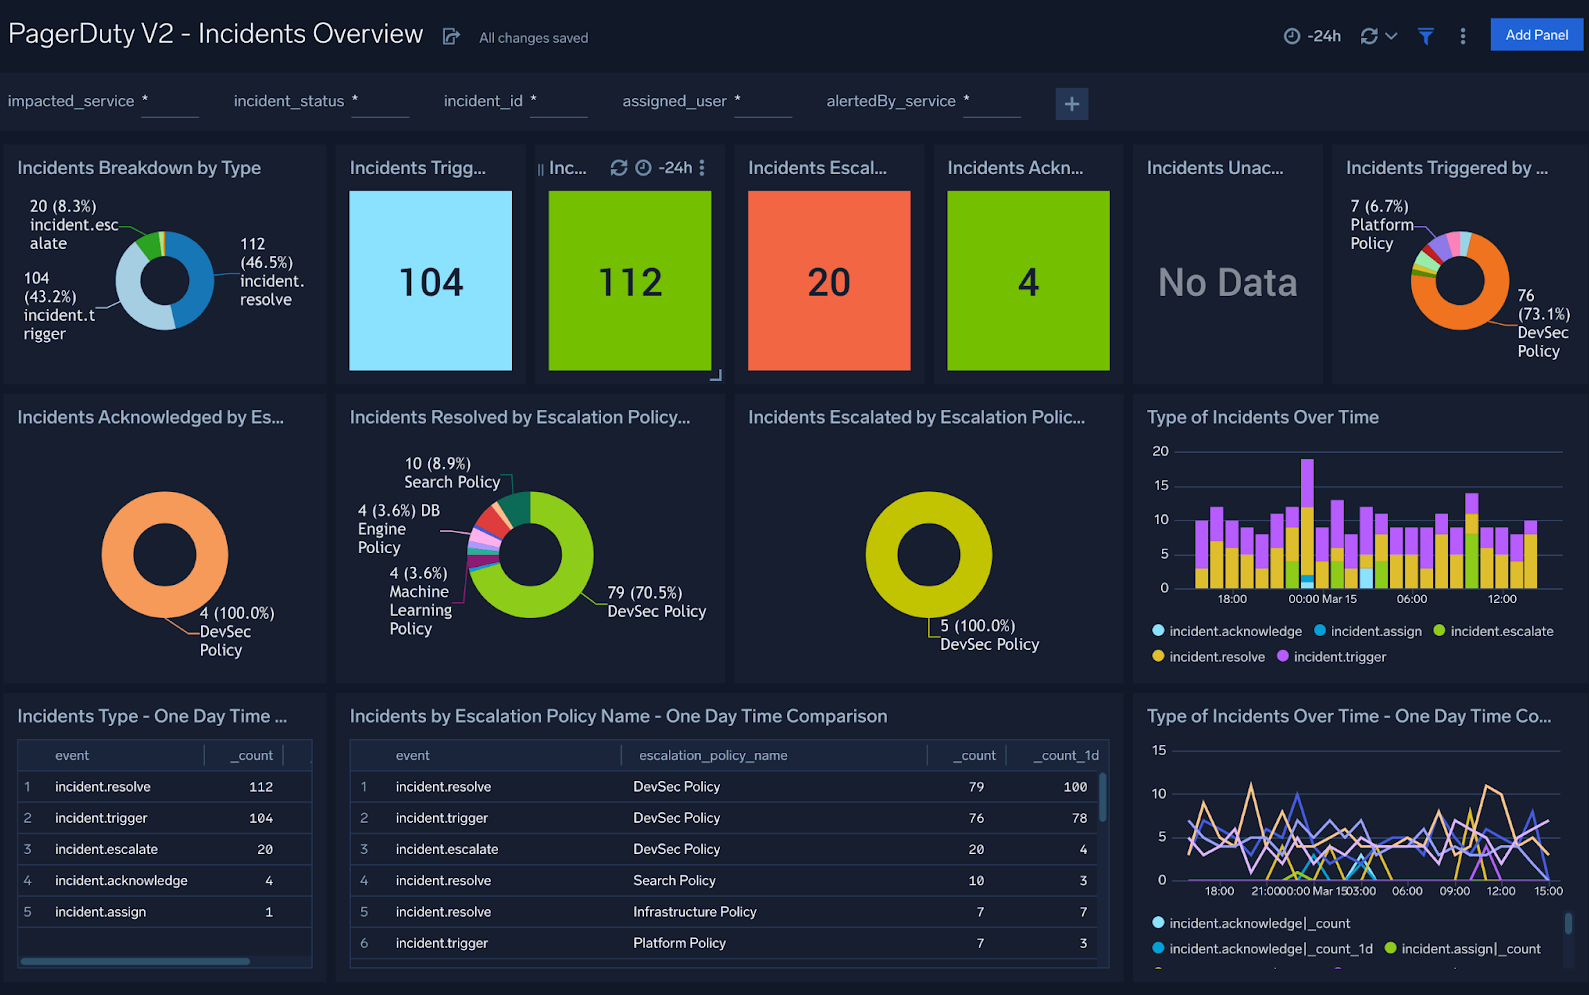
Incidents Overview
PagerDuty V2 - Incidents Overview Dashboard provides an at-a-glance analysis of triggered, acknowledged, escalated, assigned, and resolved incidents. This dashboard also provides a high-level view of incident trends and comparisons over specified time intervals.
Use this dashboard to:
- Review a high-level view of incidents summaries.
- Compare the state of incidents with that of a previous time
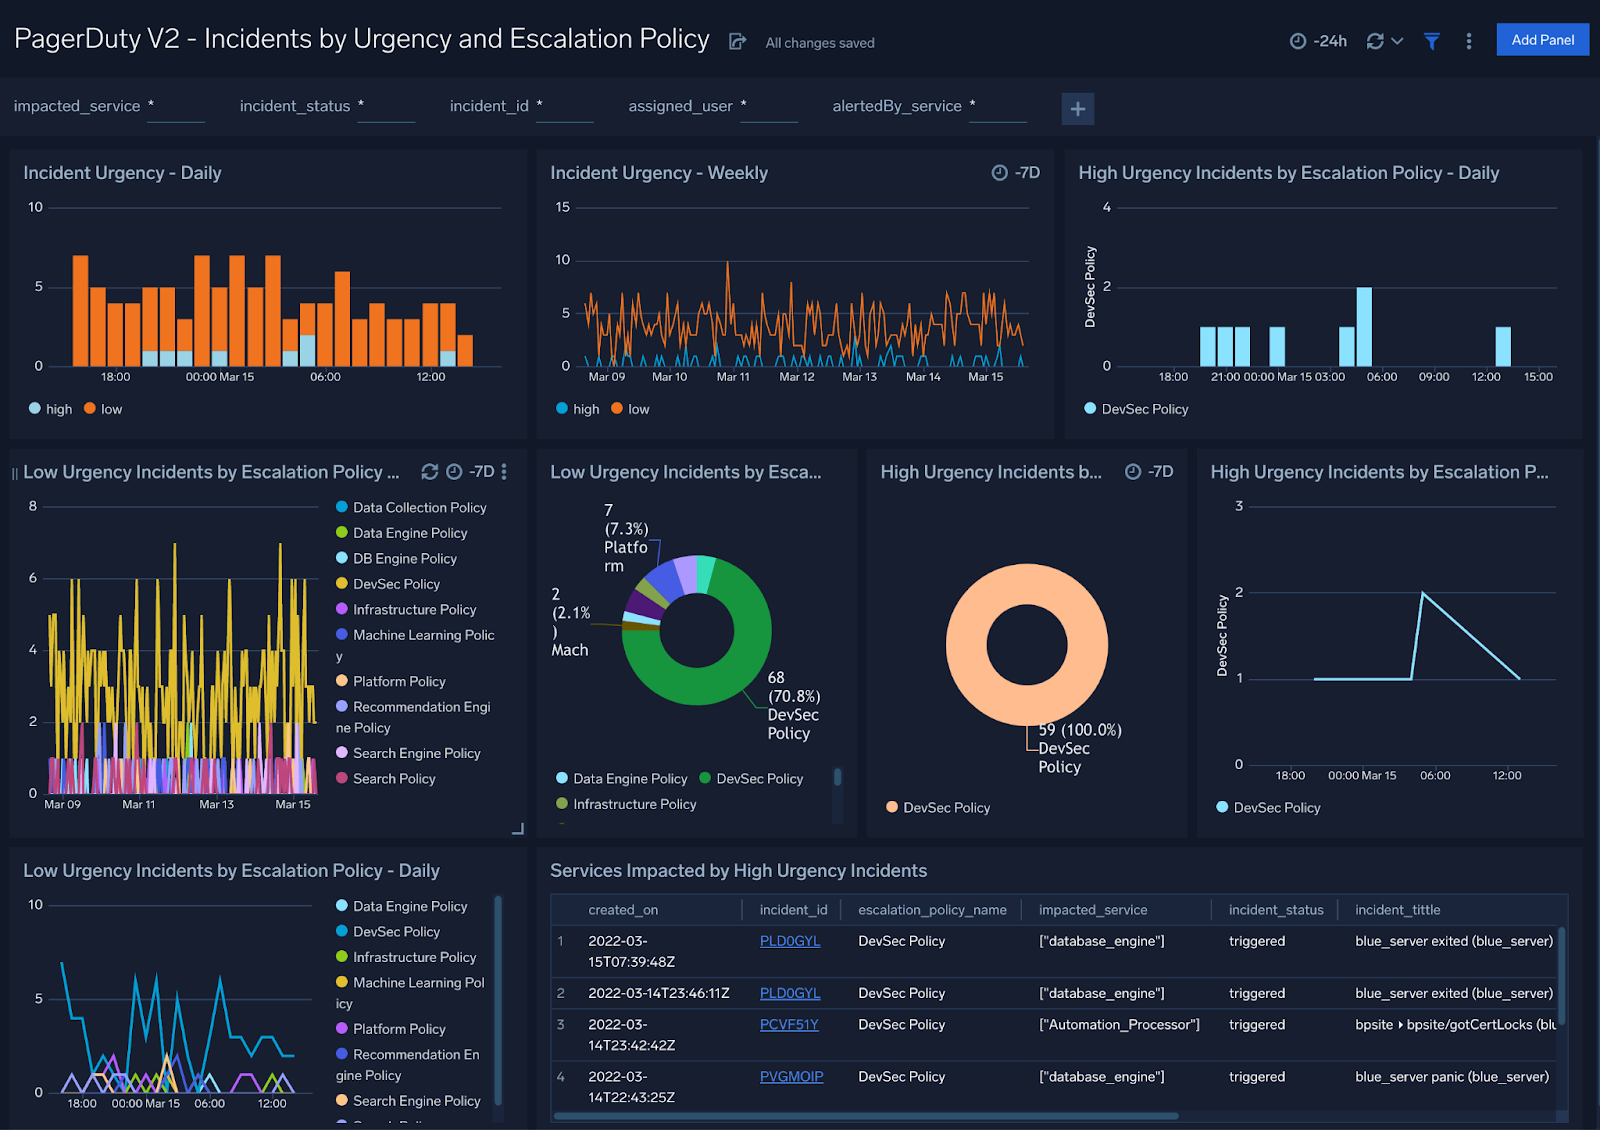
Incidents by Urgency and Escalation Policy
PagerDuty V2 - Incidents by Urgency and Escalation Policy Dashboard provides an overview analysis of urgency events, from low to high, as well as a breakdown of the services impacted by high urgency events.
Use this dashboard to:
- Review see weekly incident summaries.
- Analyze incidents by severity and escalation policy.