Salesforce
The Sumo Logic app for Salesforce analyzes logs generated by Salesforce Event Monitoring, which provides insight into your Salesforce instance and Salesforce apps. This app allows you to monitor APEX and API performance, logins, report performance, setup audit activity, user activity, and user agents.
Salesforce generates event logs during non-peak hours, every 24 hours. This means that you may not see data fill your Dashboard Panels for at least 24 hours. If you do not see data in 48 hours, contact Salesforce customer support.
Log types
The Sumo Logic app for Salesforce uses Salesforce Event Log Files. The number of log types you receive depends on the Event Monitoring Edition that you sign up for.
For details, see the Salesforce Event Monitoring Quick Start Guide.
For the complete list of available events and fields, see Event Monitoring Event Types.
Sample log messages
{
   "EVENT_TYPE":"Report",
   "TIMESTAMP":"20171002172229.677",
   "REQUEST_ID":"423LBHidMGMvdMH5Tie2a-",
   "ORGANIZATION_ID":"00XT0000000ABmu",
   "USER_ID":"006X0000006TZhh",
   "RUN_TIME":"606",
   "CPU_TIME":"90",
   "CLIENT_IP":"38.99.50.98",
   "URI":"/00OE0000003MThb",
   "REQUEST_STATUS":"S",
   "DB_TOTAL_TIME":"475884875",
   "ENTITY_NAME":"",
   "DISPLAY_TYPE":"S",
   "RENDERING_TYPE":"W",
   "REPORT_ID":"00OE0000003MThb",
   "NUMBER_EXCEPTION_FILTERS":"0",
   "NUMBER_COLUMNS":"3",
   "SORT":"",
   "DB_BLOCKS":"65351",
   "DB_CPU_TIME":"430",
   "NUMBER_BUCKETS":"2",
   "TIMESTAMP_DERIVED":"2016-02-08T21:55:55.667Z",
   "USER_ID_DERIVED":"006X0000006TZhhIAG",
   "USER_ID_DERIVED_LOOKUP":"saad@acme.com",
   "URI_ID_DERIVED":"00OE0000003MThbMAG",
   "REPORT_ID_DERIVED":"00OE0000003MThbMAG",
   "REPORT_ID_DERIVED_LOOKUP":"g Current Q MQL(C) by LC"
}
Sample queries
_sourceCategory=salesforce event type "Report"
| json "REPORT_ID_DERIVED","REPORT_ID_DERIVED_LOOKUP" as report_id, report_name
| count by report_name, report_id
| format("%s : %s",report_name, report_id) as report_id
| count by report_id
| sort by _count desc | top 20 report_id by _count
Prerequisites
Before you begin setting up log collection, review the required prerequisites and process overview described in the following sections. Installing the Sumo Logic App for Salesforce requires the following:
- Your Salesforce subscription must include the Salesforce Event Monitoring add-on, which is required to obtain all of the data presented in the app dashboards. The add-on enables access to all event types in the Salesforce EventLogFile, the LoginEvent object, Transaction Security, and the Event Monitoring Analytics App. For more information, see Get Started with Event Monitoring and Enable Event Monitoring.
- You will need a user with the permissions API Enabled and View Event Log Files (or View All Data). For assistance, you may need to contact your Salesforce administrator. (See Salesforce Configuration for steps.)
- Your system must run JRE 7. If you do not meet this requirement, you may see an exception similar to:
Exception in thread "main" java.lang.UnsupportedClassVersionError: \
com/sumologic/content/tools/apiclient/SumoJanus : Unsupported major.minor version 51.0- If your Salesforce instance does not support Transport Layer Security (TLS) v1.0, you will be required to run JRE 8 instead of JRE 7. Specifically, if you see an error message like this when the script queries data:
TLS 1.0 has been disabled in this organization.
Please use TLS 1.1 or higher when connecting to Salesforce using https. - You may do the configuration steps on a system with a web browser for authentication via OAuth2, and then move the configuration folder to your production system. Or if your production system has a web browser, all steps may be done on that system.
Collection configuration and app installation
Depending on the set up collection method, you can configure and install the app in three ways:
- Create a new collector and install the app. Create a new Sumo Logic Cloud-to-Cloud (C2C) source under a new Sumo Logic Collector and later install the app, or
- Use an existing collector and install the app. Create a new Sumo Logic Cloud-to-Cloud (C2C) source under an existing Sumo Logic Collector and later install the app, or
- Use existing source and install the app. Use your existing configured Sumo Logic Cloud-to-Cloud (C2C) source and install the app.
Use the Cloud-to-Cloud Integration for Salesforce to create the source and use the same source category while installing the app. By following these steps, you can ensure that your Salesforce app is properly integrated and configured to collect and analyze your Salesforce data.
Create a new collector and install the app
To set up collection and install the app, do the following:
Next-Gen App: To install or update the app, you must be an account administrator or a user with Manage Apps, Manage Monitors, Manage Fields, Manage Metric Rules, and Manage Collectors capabilities depending upon the different content types part of the app.
- Select App Catalog.
- In the 🔎 Search Apps field, run a search for your desired app, then select it.
- Click Install App.
note
Sometimes this button says Add Integration.
- In the Set Up Collection section of your respective app, select Create a new Collector.
- Collector Name. Enter a Name to display the Source in the Sumo Logic web application. The description is optional.
- Timezone. Set the default time zone when it is not extracted from the log timestamp. Time zone settings on Sources override a Collector time zone setting.
- (Optional) Metadata. Click the +Add Metadata link to add a custom log Metadata Fields. Define the fields you want to associate, each metadata field needs a name (key) and value.
 A green circle with a checkmark is shown when the field exists and is enabled in the Fields table schema.
 An orange triangle with an exclamation point is shown when the field doesn't exist, or is disabled, in the Fields table schema. In this case, an option to automatically add or enable the nonexistent fields to the Fields table schema is provided. If a field is sent to Sumo that does not exist in the Fields schema or is disabled it is ignored, known as dropped.
- Click Next.
- Configure the source as specified in the
Infobox above, ensuring all required fields are included. - In the Configure section of your respective app, complete the following fields.
- Field Name. If you already have collectors and sources set up, select the configured metadata field name (eg _sourcecategory) or specify other custom metadata (eg: _collector) along with its metadata Field Value.
- Click Next. You will be redirected to the Preview & Done section.
Post-installation
Once your app is installed, it will appear in your Installed Apps folder, and dashboard panels will start to fill automatically.
Each panel slowly fills with data matching the time range query received since the panel was created. Results will not immediately be available but will be updated with full graphs and charts over time.
Use an existing collector and install the app
To set up the source in the existing collector and install the app, do the following:
Next-Gen App: To install or update the app, you must be an account administrator or a user with Manage Apps, Manage Monitors, Manage Fields, Manage Metric Rules, and Manage Collectors capabilities depending upon the different content types part of the app.
- Select App Catalog.
- In the 🔎 Search Apps field, run a search for your desired app, then select it.
- Click Install App.
note
Sometimes this button says Add Integration.
- In the Set Up Collection section of your respective app, select Use an existing Collector.
- From the Select Collector dropdown, select the collector that you want to set up your source with and click Next.
- Configure the source as specified in the
Infobox above, ensuring all required fields are included. - In the Configure section of your respective app, complete the following fields.
- Field Name. If you already have collectors and sources set up, select the configured metadata field name (eg _sourcecategory) or specify other custom metadata (eg: _collector) along with its metadata Field Value.
- Click Next. You will be redirected to the Preview & Done section.
Post-installation
Once your app is installed, it will appear in your Installed Apps folder, and dashboard panels will start to fill automatically.
Each panel slowly fills with data matching the time range query received since the panel was created. Results will not immediately be available but will be updated with full graphs and charts over time.
Use an existing source and install the app
To skip collection and only install the app, do the following:
Next-Gen App: To install or update the app, you must be an account administrator or a user with Manage Apps, Manage Monitors, Manage Fields, Manage Metric Rules, and Manage Collectors capabilities depending upon the different content types part of the app.
- Select App Catalog.
- In the 🔎 Search Apps field, run a search for your desired app, then select it.
- Click Install App.
note
Sometimes this button says Add Integration.
- In the Set Up Collection section of your respective app, select Skip this step and use existing source and click Next.
- In the Configure section of your respective app, complete the following fields.
- Field Name. If you already have collectors and sources set up, select the configured metadata field name (eg _sourcecategory) or specify other custom metadata (eg: _collector) along with its metadata Field Value.
- Click Next. You will be redirected to the Preview & Done section.
Post-installation
Once your app is installed, it will appear in your Installed Apps folder, and dashboard panels will start to fill automatically.
Each panel slowly fills with data matching the time range query received since the panel was created. Results will not immediately be available but will be updated with full graphs and charts over time.
Viewing Salesforce dashboards
All dashboards have a set of filters that you can apply to the entire dashboard. Use these filters to drill down and examine the data to a granular level.
- You can change the time range for a dashboard or panel by selecting a predefined interval from a drop-down list, choosing a recently used time range, or specifying custom dates and times. Learn more.
- You can use template variables to drill down and examine the data on a granular level. For more information, see Filtering Dashboards with Template Variables.
- Most Next-Gen apps allow you to provide the scope at the installation time and are comprised of a key (
_sourceCategoryby default) and a default value for this key. Based on your input, the app dashboards will be parameterized with a dashboard variable, allowing you to change the dataset queried by all panels. This eliminates the need to create multiple copies of the same dashboard with different queries.
Overview
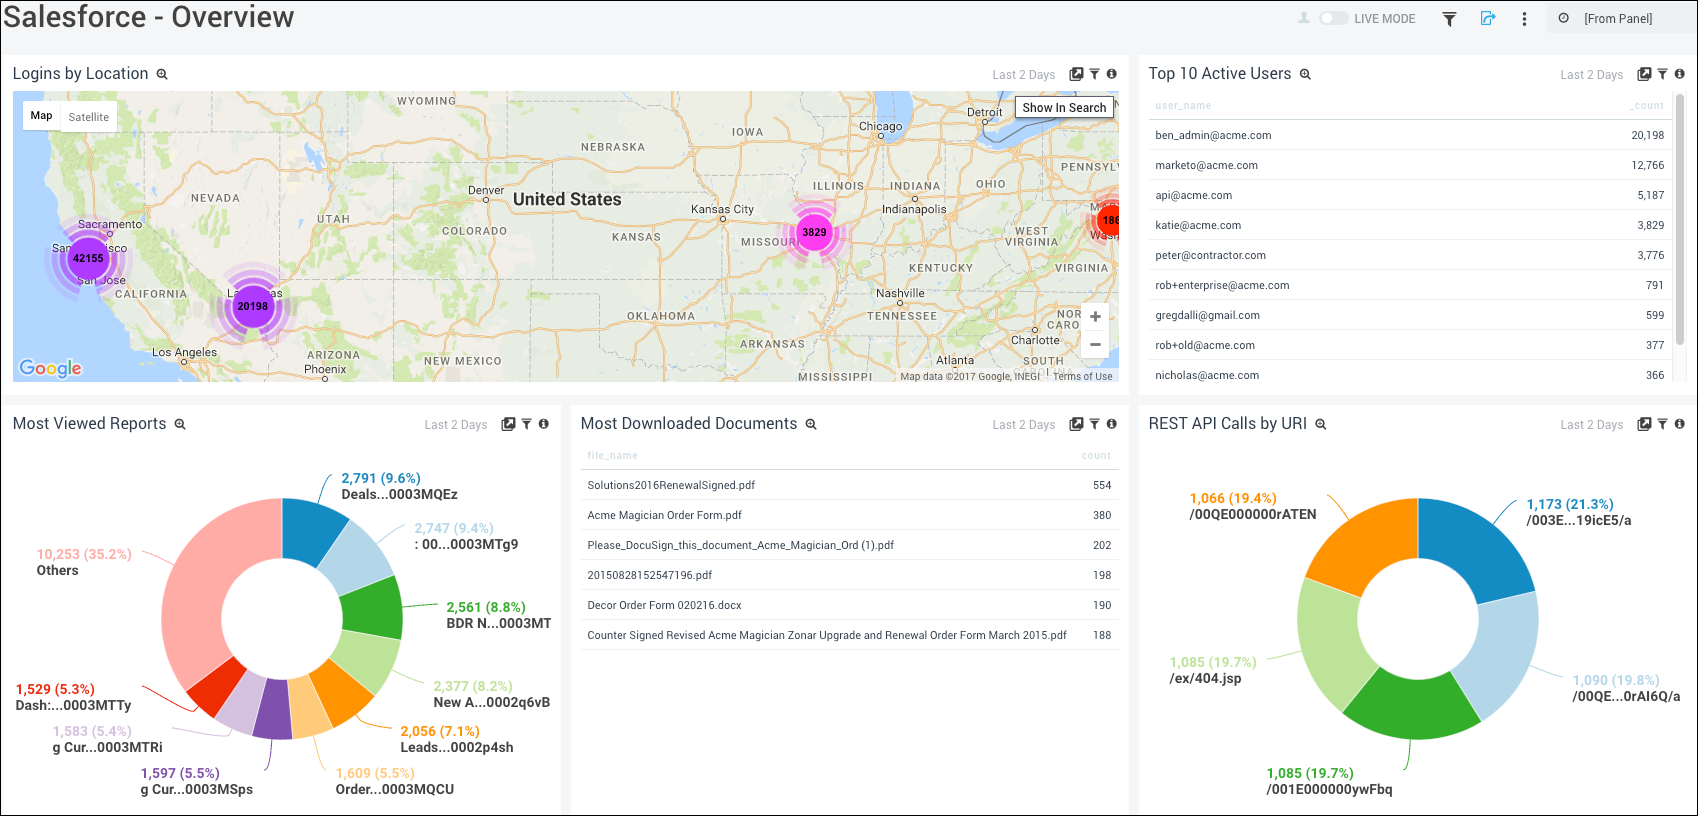
Logins by Location. Uses a geo lookup operation to display login activity on a map of the world for the last two days.
Top 10 Active Users. Lists the top 10 active users in a table chart including user name and count for the last two days.
Most Viewed Reports. Displays the most viewed reports in a pie chart for the last two days.
Most Downloaded Documents. Provides details on the most downloaded documents in a table chart with information on file name and count for the last two days.
REST API Calls by URI. Shows all REST API calls by URI in a pie chart for the last two days.
APEX and API Performance
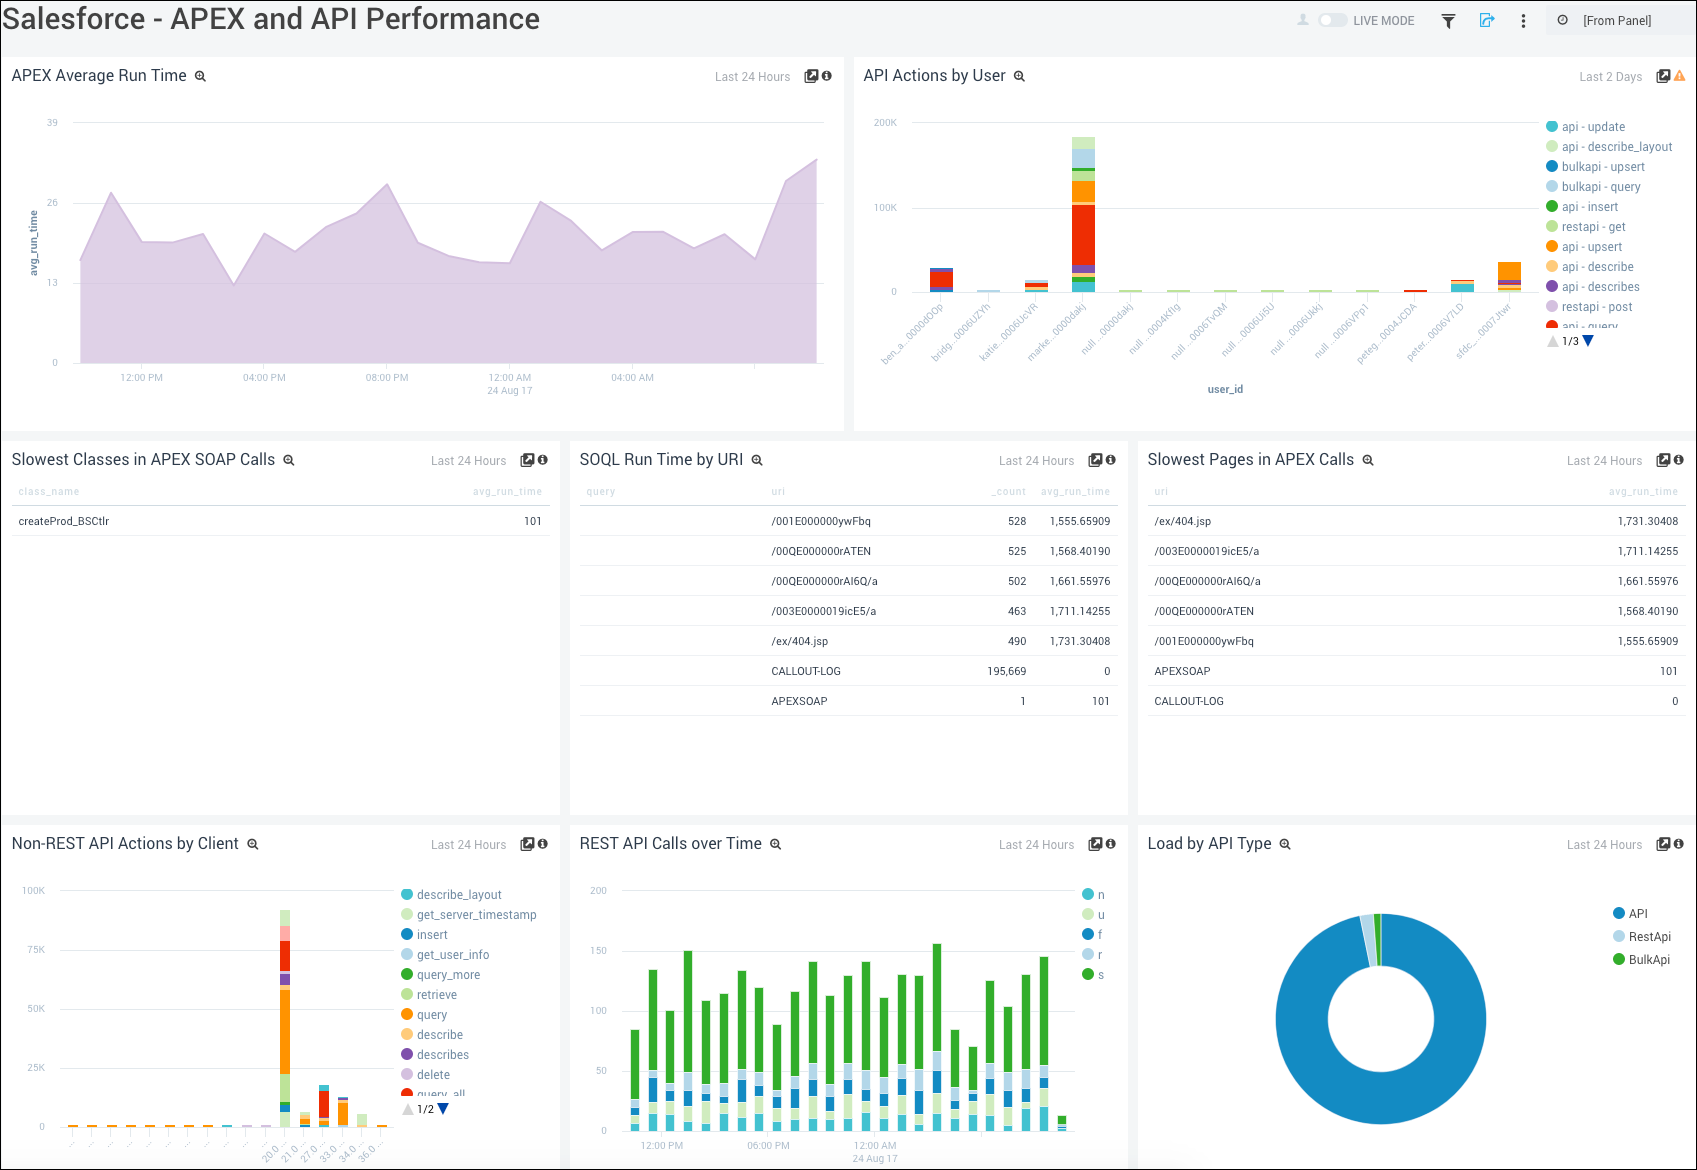
APEX Average Run Time. Displays the APEX average run time in an area chart on a timeline for the last 24 hours.
API Actions by User. Shows API actions by users in a stacked column chart for the last two days.
Slowest Classes in APEX SOAP Calls. Provides details on the slowest classes in APEX SOAP calls in a table chart, including information on the class name and the average run time for the last 24 hours.
SOQL Run Time by URI. Displays the SOQL run time by URI in a table chart including details on the query, URL, count, and average run time for the last 24 hours.
Slowest Pages in APEX Calls. Provides information on the slowest pages in APEX calls in a table chart including details on the URL and average run time for the last 24 hours.
Non-REST API Actions by Client. Shows the non-REST API actions by client in a stacked column chart for the last 24 hours.
REST API Calls Over Time. Displays REST API calls over time in a stacked column chart on a timeline for the last 24 hours.
Load by API Type. Provides information on the load by API type in a pie chart for the last 24 hours.
Logins
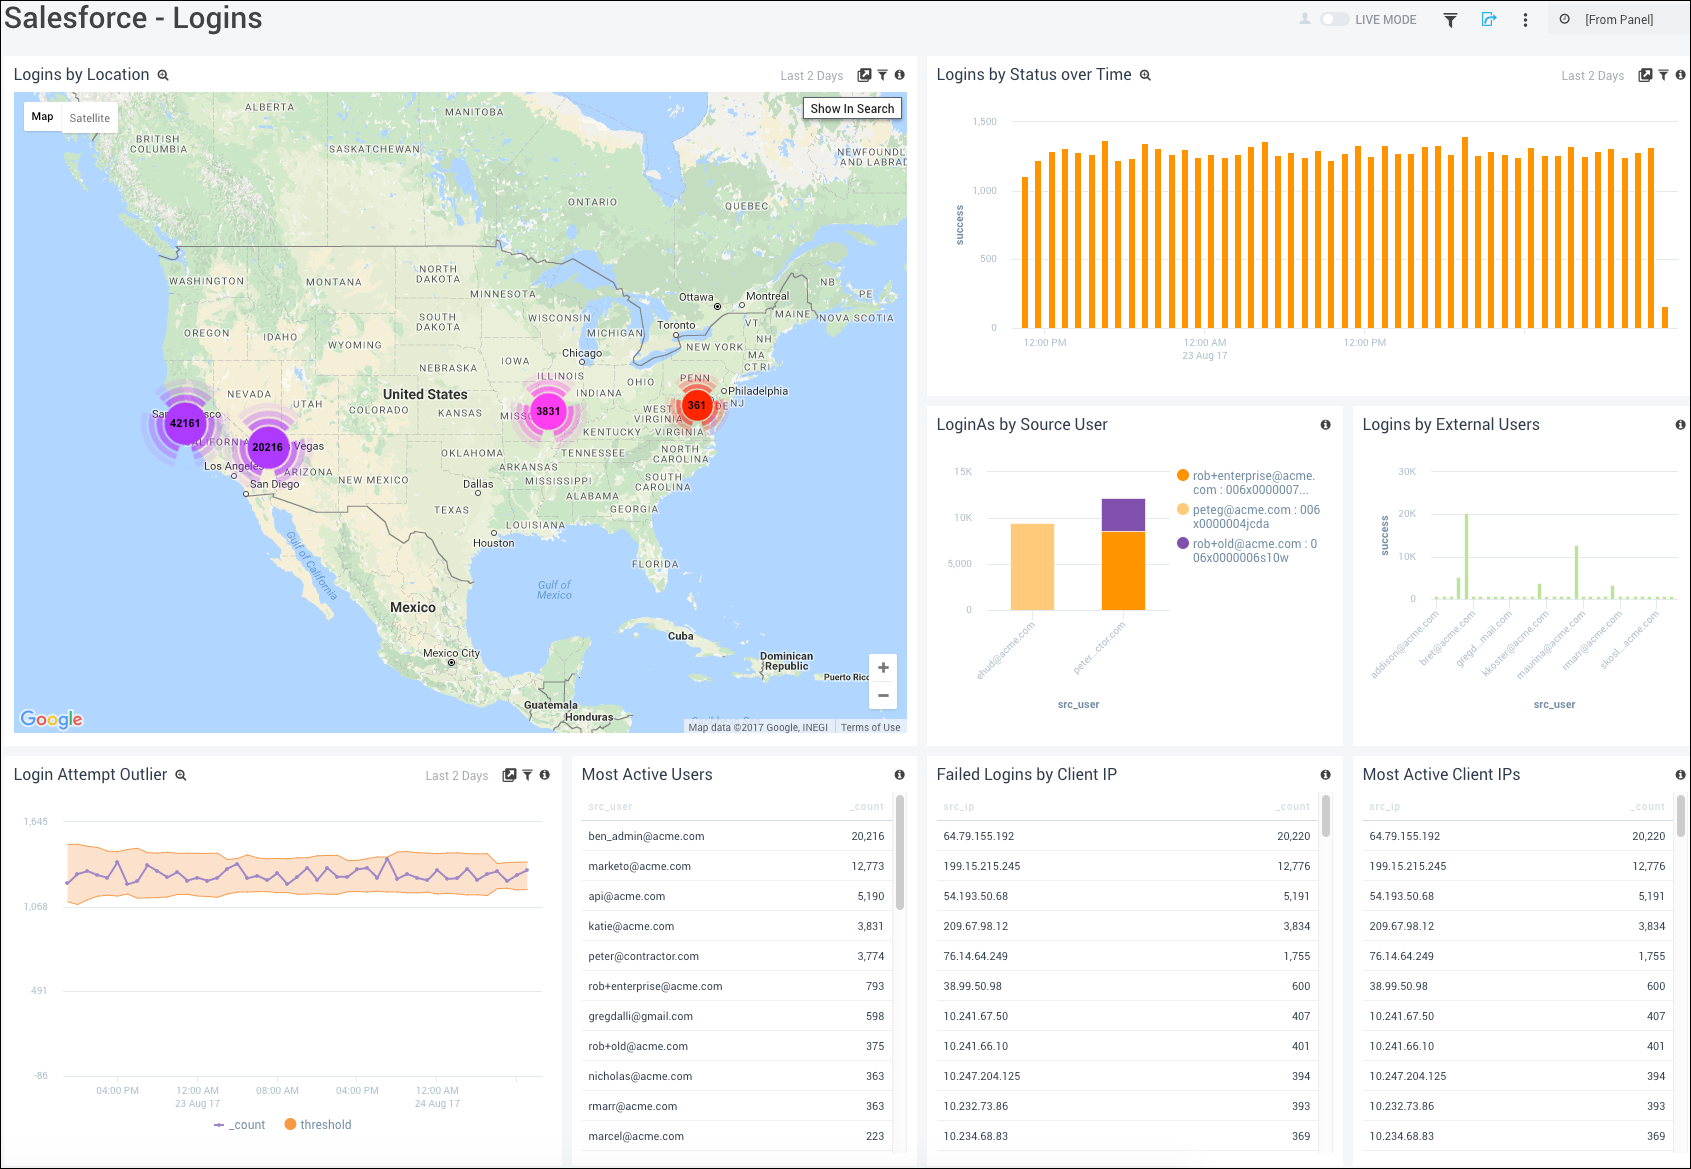
Logins by Location. Uses a geo lookup operation to display login activity on a map of the world for the last two days.
Logins by Status Over Time. Displays successes and failures in a column chart on a timeline for the last two days.
LoginAs by Source User. Provides details on LoginAs actions by source user in a stacked column chart for the last two days.
Logins by External Users. Shows the number of logins by external users by user name on a column chart for the last two days.
Login Attempt Outlier. Performs an outlier operation to display login attempts on a timeline for the last two days.
Most Active Users. Displays the most active users in a table chart including details on the user name and count for the last two days.
Failed Logins by Client IP. Shows details of failed logins by client IP address including information on the client IP address and the count for the last two days.
Most Active Client IPs. Displays the most active client IP addresses in a table chart including details on the client IP address and count for the last two days.
Report Performance
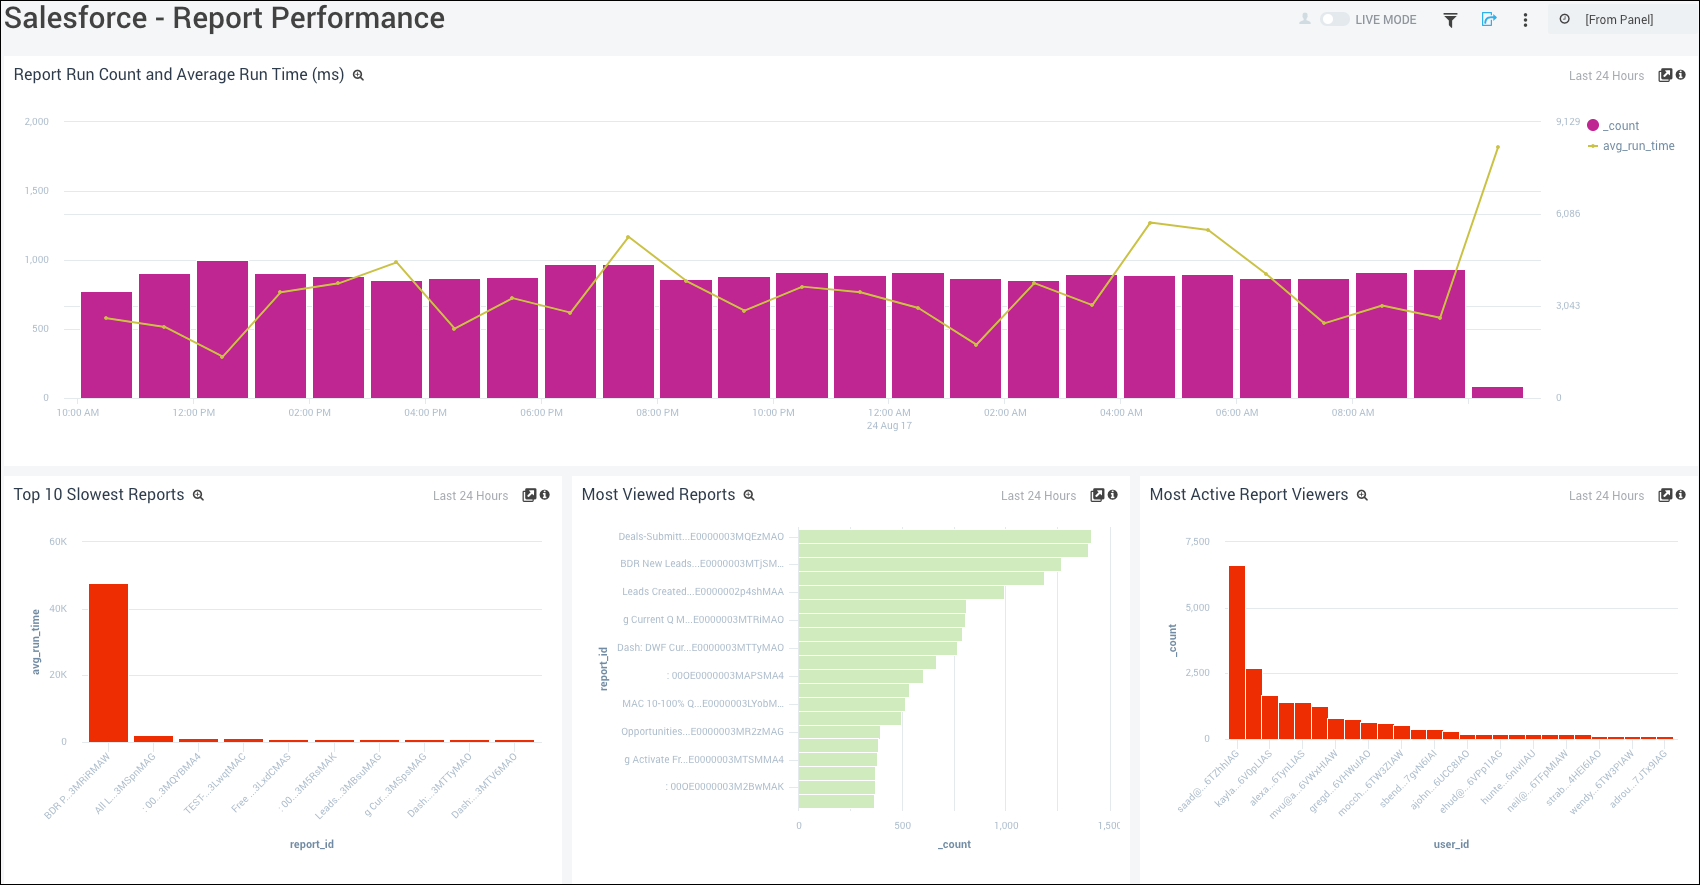
Report Run Count and Average Run Time (ms). Displays the report run count (bar chart) and the average run time (line chart) in milliseconds in a combo chart on a timeline for the last 24 hours.
Top 10 Slowest Reports. Shows the top 10 slowest reports by count and report ID on a column chart for the last 24 hours.
Most Viewed Reports. Provides details on the most viewed reports by count and report ID in a bar chart for the last 24 hours.
Most Active Report Viewers. Displays the most active report viewed by count and user ID on a column chart for the last 24 hours.
Setup Audit Activity
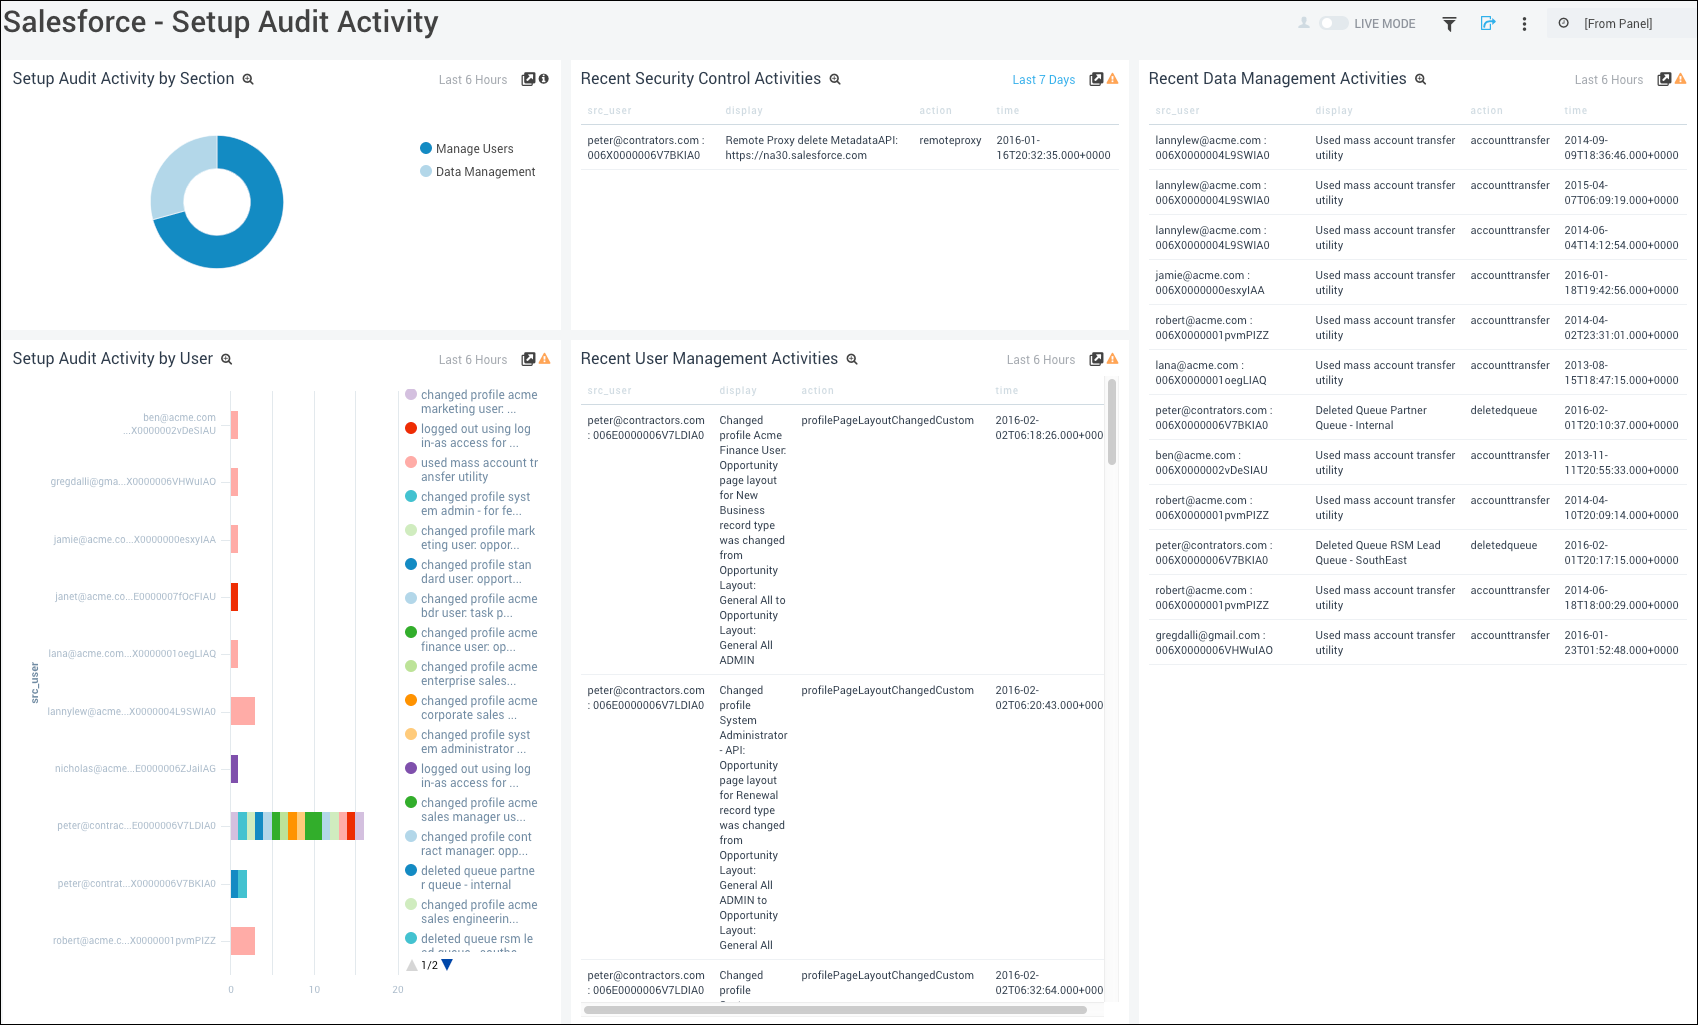
Setup Audit Activity by Section. Displays setup audit activity by section in a pie chart for the last two days.
Recent Security Control Activities. Provides details on recent security control activities in a table chart including information on the source user, display, action, and time for the last two days.
Recent Data Management Activities. Provides details on recent data management activities in a table chart including information on the source user, display, action, and time for the last two days.
Setup Audit Activity by User. Shows setup audit activity by user and by count in a stacked bar chart for the last two days.
Recent User Management Activities. Displays information on recent user management activities in a table chart including details on the source user, display, action, and time for the last two days.
User Activity - Content
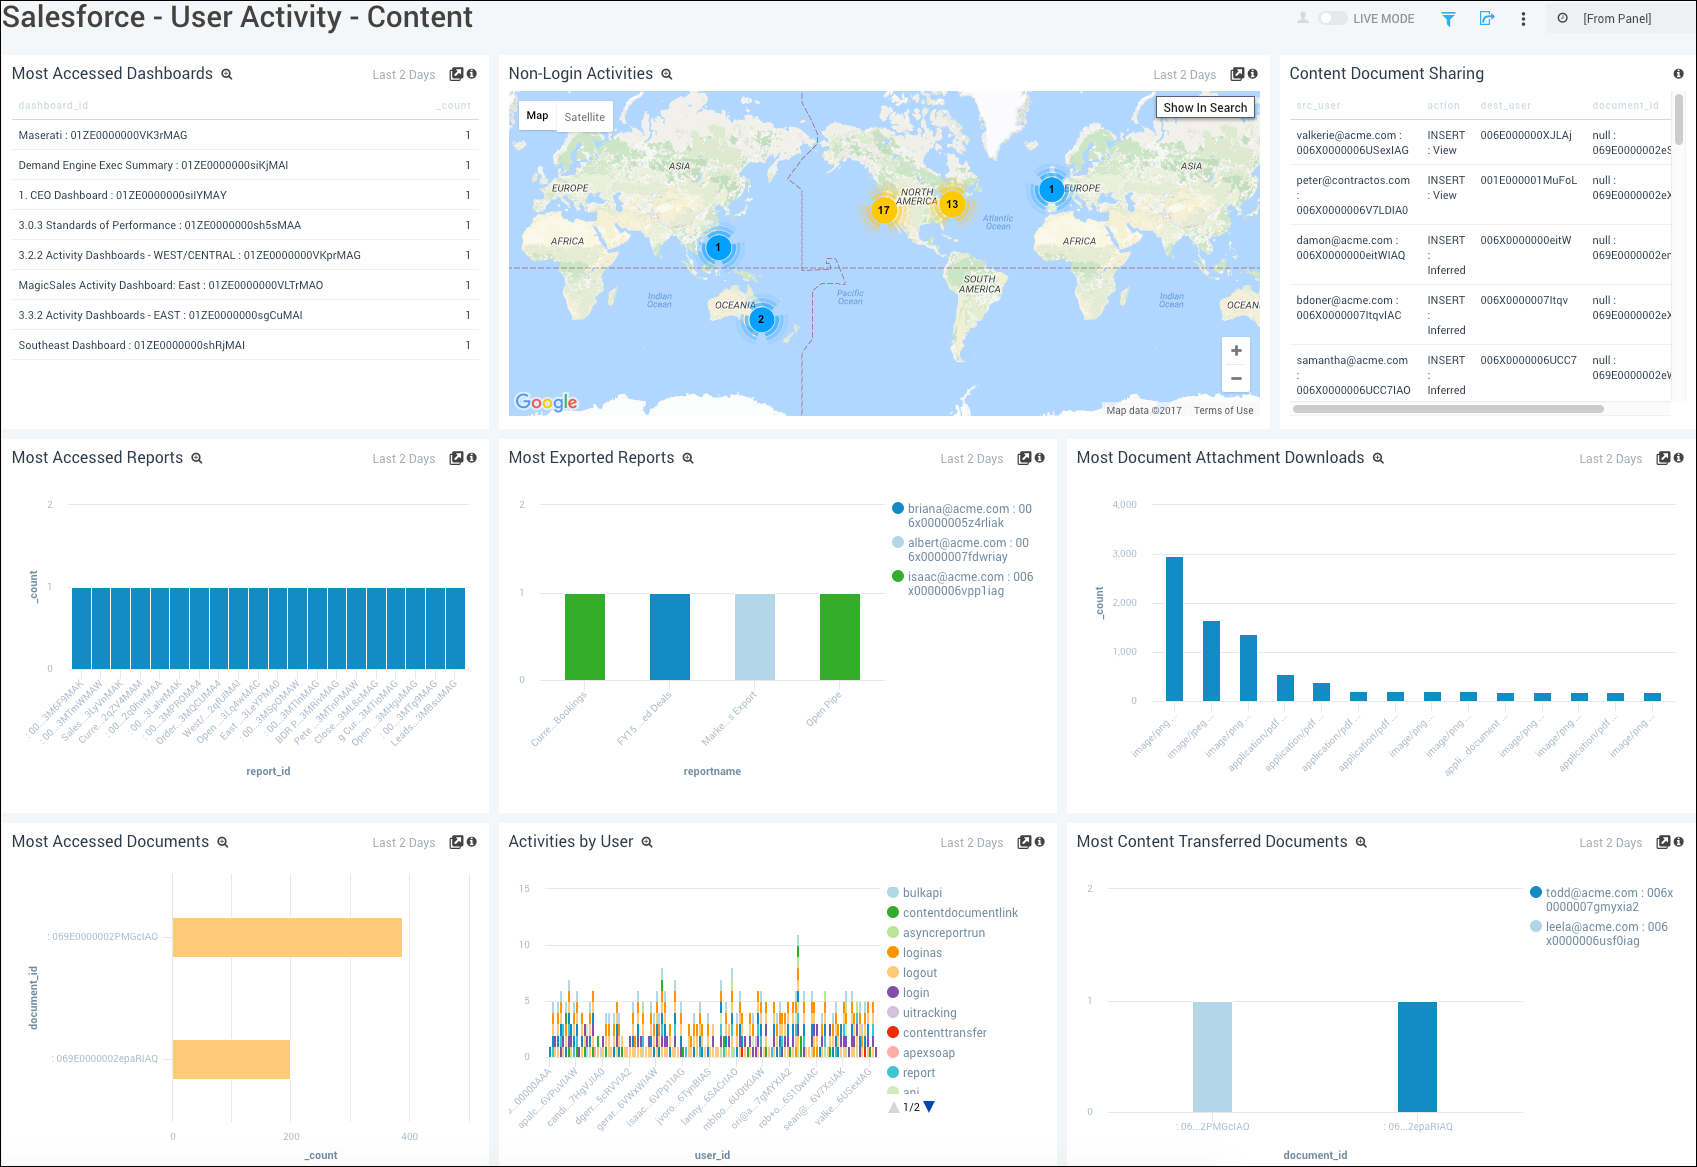
Most Accessed Dashboards. Displays the Dashboards most often accessed by users in a pie chart for the last two days.
Non-Login Activities. Performs a geo lookup operation and displays the IP address location of non-login activities on a map of the world for the last two days.
Content Document Sharing. Provides details on documents shared by users in a table chart including information on the source user, action, destination user, document ID and count for the last two days.
Most Accessed Reports. Shows the reports most often accessed by users and the count in a column chart for the last two days.
Most Exported Reports. Displays details on the reports most exported by users in a column chart by report name and count for the last two days.
Most Document Attachment Downloads. Displays information on the documents with attachments that were most often downloaded by users in a column chart by attachment name, type, and count for the last two days.
Most Accessed Documents. Provides details on the documents most accessed by users in a bar chart by count for the last two days.
Activities by User. Shows information on activities by user in a stacked column chart for the last two days.
Most Content Transferred Documents. Shows details on documents with content that were most often transferred by users in a column chart by document ID and count for the last two days.
User Activity - Monitoring
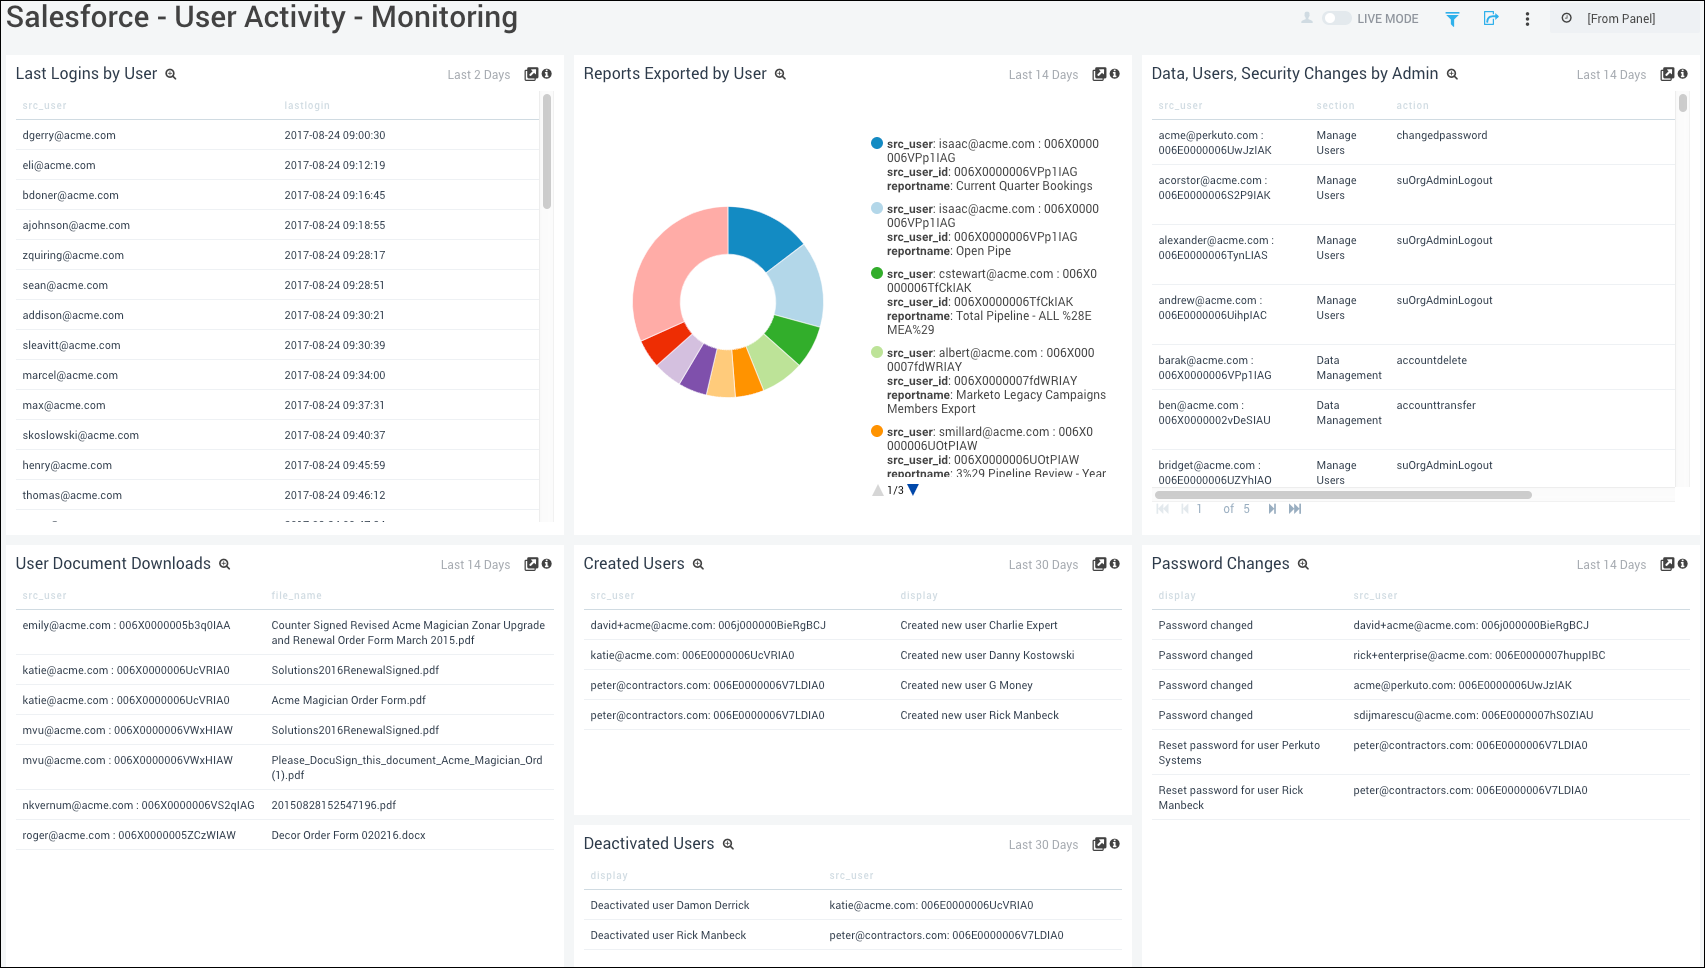
Last login by User. Displays the details of last logins by user in the last two days including the user name and last login time.
Reports Exported by User. Shows the count of reports exported by user including the user name, user ID, and report name in the last 14 days on a pie chart.
Data, Users, Security Changes by Admin. Displays the details of data, user, and security changes performed by admin in the last 14 days including the user ID, section, and action performed.
User Document Downloads. Shows the details of user documents downloaded in the last 14 days including the user ID, and file name.
Created Users. Displays the details of users created in the last 30 days including the source user ID and the description of the action performed.
Password Changes. Displays the details of password changes in the last 14 days including the source user ID and the description of the action performed.
Deactivated Users. Displays the details of users deactivated in the last 30 days including the source user ID and the description of the action performed.
User Agents
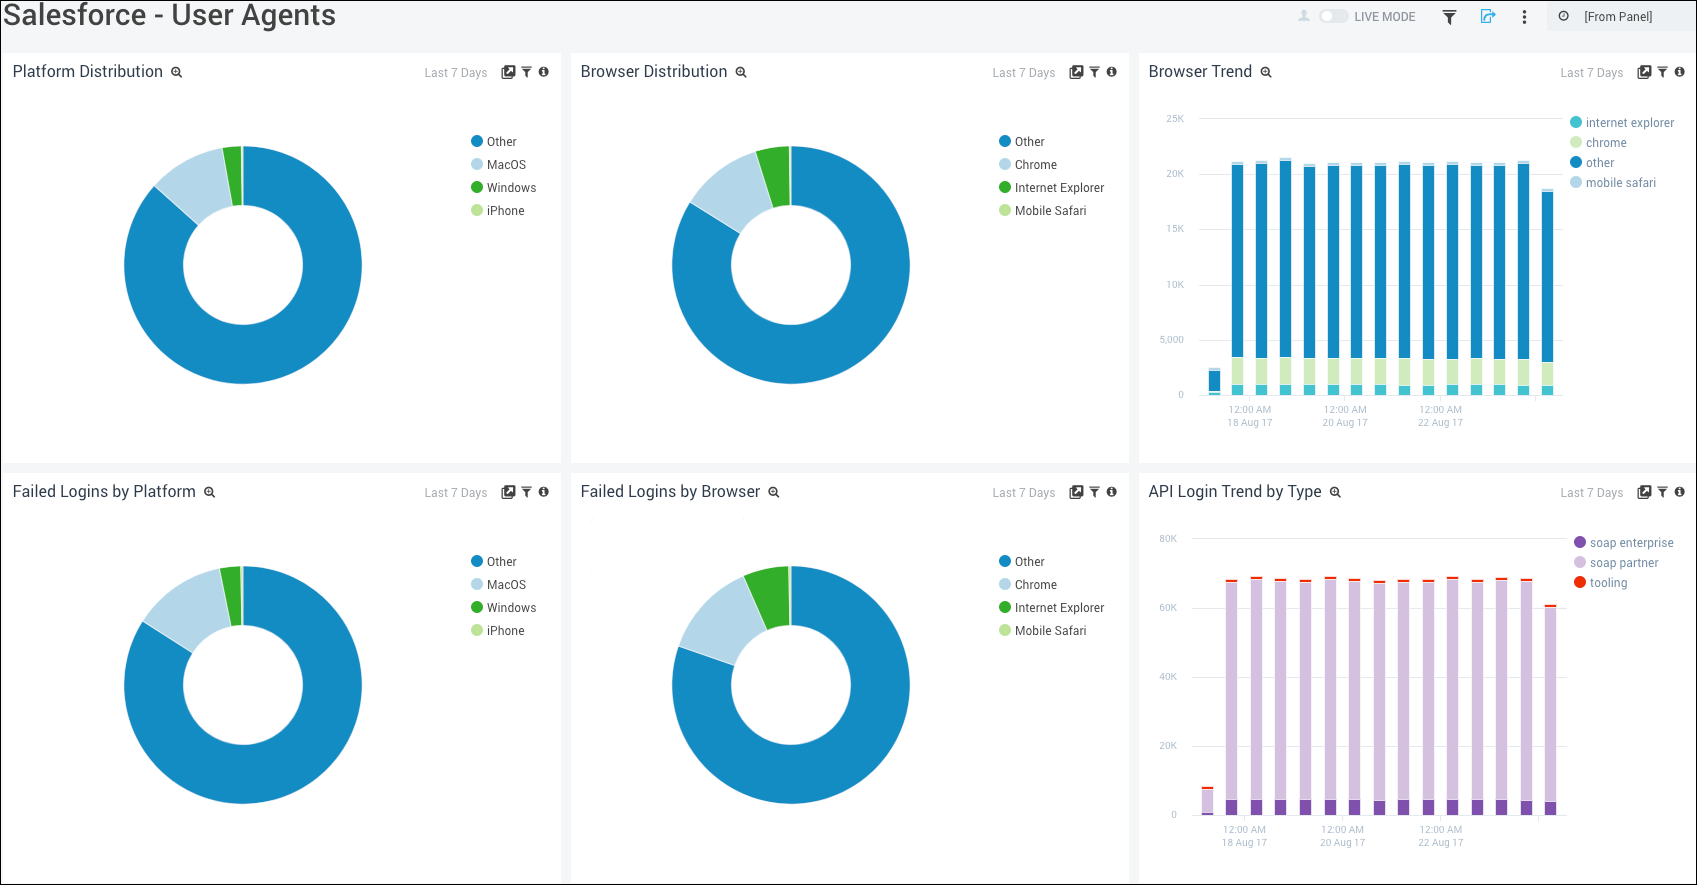
Platform Distribution. Displays the distribution of operating system type used by users in a pie chart for the last seven days.
Browser Distribution. Provides information on the web browser distribution used by users in a pie chart for the last seven days.
Browser Trend. Shows the number and type of web browsers used to login in a stacked column chart on a timeline for the last seven days.
Failed Logins by Platform. Shows details on failed logins by operating system platform in a pie chart for the last seven days.
Failed Logins by Browser. Displays details of failed logins by web browser in a pie chart for the last seven days.
API Login Trend by Type. Provides details on the number and type of APIs used to login in a stacked column chart on a timeline for the last seven days.
Upgrade/Downgrade the Salesforce app (Optional)
To update the app, do the following:
Next-Gen App: To install or update the app, you must be an account administrator or a user with Manage Apps, Manage Monitors, Manage Fields, Manage Metric Rules, and Manage Collectors capabilities depending upon the different content types part of the app.
- Select App Catalog.
- In the Search Apps field, search for and then select your app.
Optionally, you can identify apps that can be upgraded in the Upgrade available section. - To upgrade the app, select Upgrade from the Manage dropdown.
- If the upgrade does not have any configuration or property changes, you will be redirected to the Preview & Done section.
- If the upgrade has any configuration or property changes, you will be redirected to the Setup Data page.
- In the Configure section of your respective app, complete the following fields.
- Field Name. If you already have collectors and sources set up, select the configured metadata field name (eg _sourcecategory) or specify other custom metadata (eg: _collector) along with its metadata Field Value.
- Click Next. You will be redirected to the Preview & Done section.
Post-update
Your upgraded app will be installed in the Installed Apps folder and dashboard panels will start to fill automatically.
See our Release Notes changelog for new updates in the app.
To revert the app to a previous version, do the following:
- Select App Catalog.
- In the Search Apps field, search for and then select your app.
- To version down the app, select Revert to < previous version of your app > from the Manage dropdown.
Uninstalling the Salesforce app (Optional)
To uninstall the app, do the following:
- Select App Catalog.
- In the 🔎 Search Apps field, run a search for your desired app, then select it.
- Click Uninstall.