Sumo Logic Audit app

The Sumo Logic Audit app uses Sumo Logic audit index events to present information about account management activities, user activities, and management of Library content (searches, dashboards/reports, and folders) in your Sumo Logic account. The app uses predefined searches and Dashboards that provide visibility into your environment.
- Make sure that the Sumo auditing is enabled. If it is not, an administrator must enable it before you install the Audit app. For instructions, see Enable and Manage Auditing.
- Data is provided from the time the Sumo Auditing is enabled. Audit data is not backfilled to any time before the feature was enabled.
Installing the Sumo Logic Audit app
To install the app:
- Select App Catalog.
- In the Search Apps field, search for and then select your app.
- Optionally, you can scroll down to preview the dashboards included with the app. Then, click Install App (sometimes this button says Add Integration).
- Click Next.
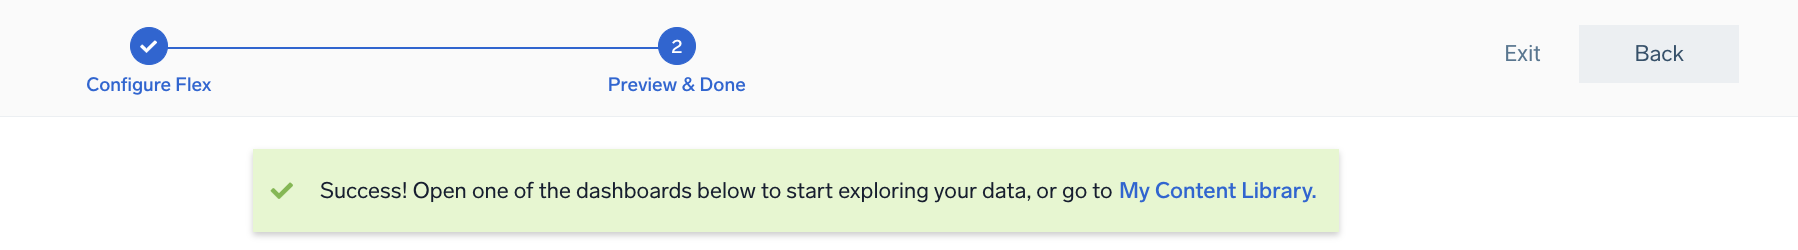
- Look for the dialog confirming that your app was installed successfully.
Once an app is installed, it will appear in your Personal folder or the folder that you specified. From here, you can share it with other users in your organization. Dashboard panels will automatically start to fill with data matching the time range query received since you created the panel. Results won't be available immediately, but within about 20 minutes, you'll see completed graphs and maps.
Create monitors for the Sumo Logic Audit app
From your App Catalog:
- From the Sumo Logic navigation, select App Catalog.
- In the Search Apps field, search for and then select your app.
- Make sure the app is installed.
- Navigate to What's Included tab and scroll down to the Monitors section.
- Click Create next to the pre-configured monitors. In the create monitors window, adjust the trigger conditions and notifications settings based on your requirements.
- Scroll down to Monitor Details.
- Under Location click on New Folder.
note
By default, monitor will be saved in the root folder. So to make the maintenance easier, create a new folder in the location of your choice.
- Enter Folder Name. Folder Description is optional.
tip
Using app version in the folder name will be helpful to determine the versioning for future updates.
- Click Create. Once the folder is created, click on Save.
Viewing Sumo Logic Audit dashboards
All dashboards have a set of filters that you can apply to the entire dashboard. Use these filters to drill down and examine the data to a granular level.
- You can change the time range for a dashboard or panel by selecting a predefined interval from a drop-down list, choosing a recently used time range, or specifying custom dates and times. Learn more.
- You can use template variables to drill down and examine the data on a granular level. For more information, see Filtering Dashboards with Template Variables.
- Most Next-Gen apps allow you to provide the scope at the installation time and are comprised of a key (
_sourceCategoryby default) and a default value for this key. Based on your input, the app dashboards will be parameterized with a dashboard variable, allowing you to change the dataset queried by all panels. This eliminates the need to create multiple copies of the same dashboard with different queries.
Account Management Overview
See an overview of account management activities, including role, operation, and access key operations; and the location where administrative activities were performed.
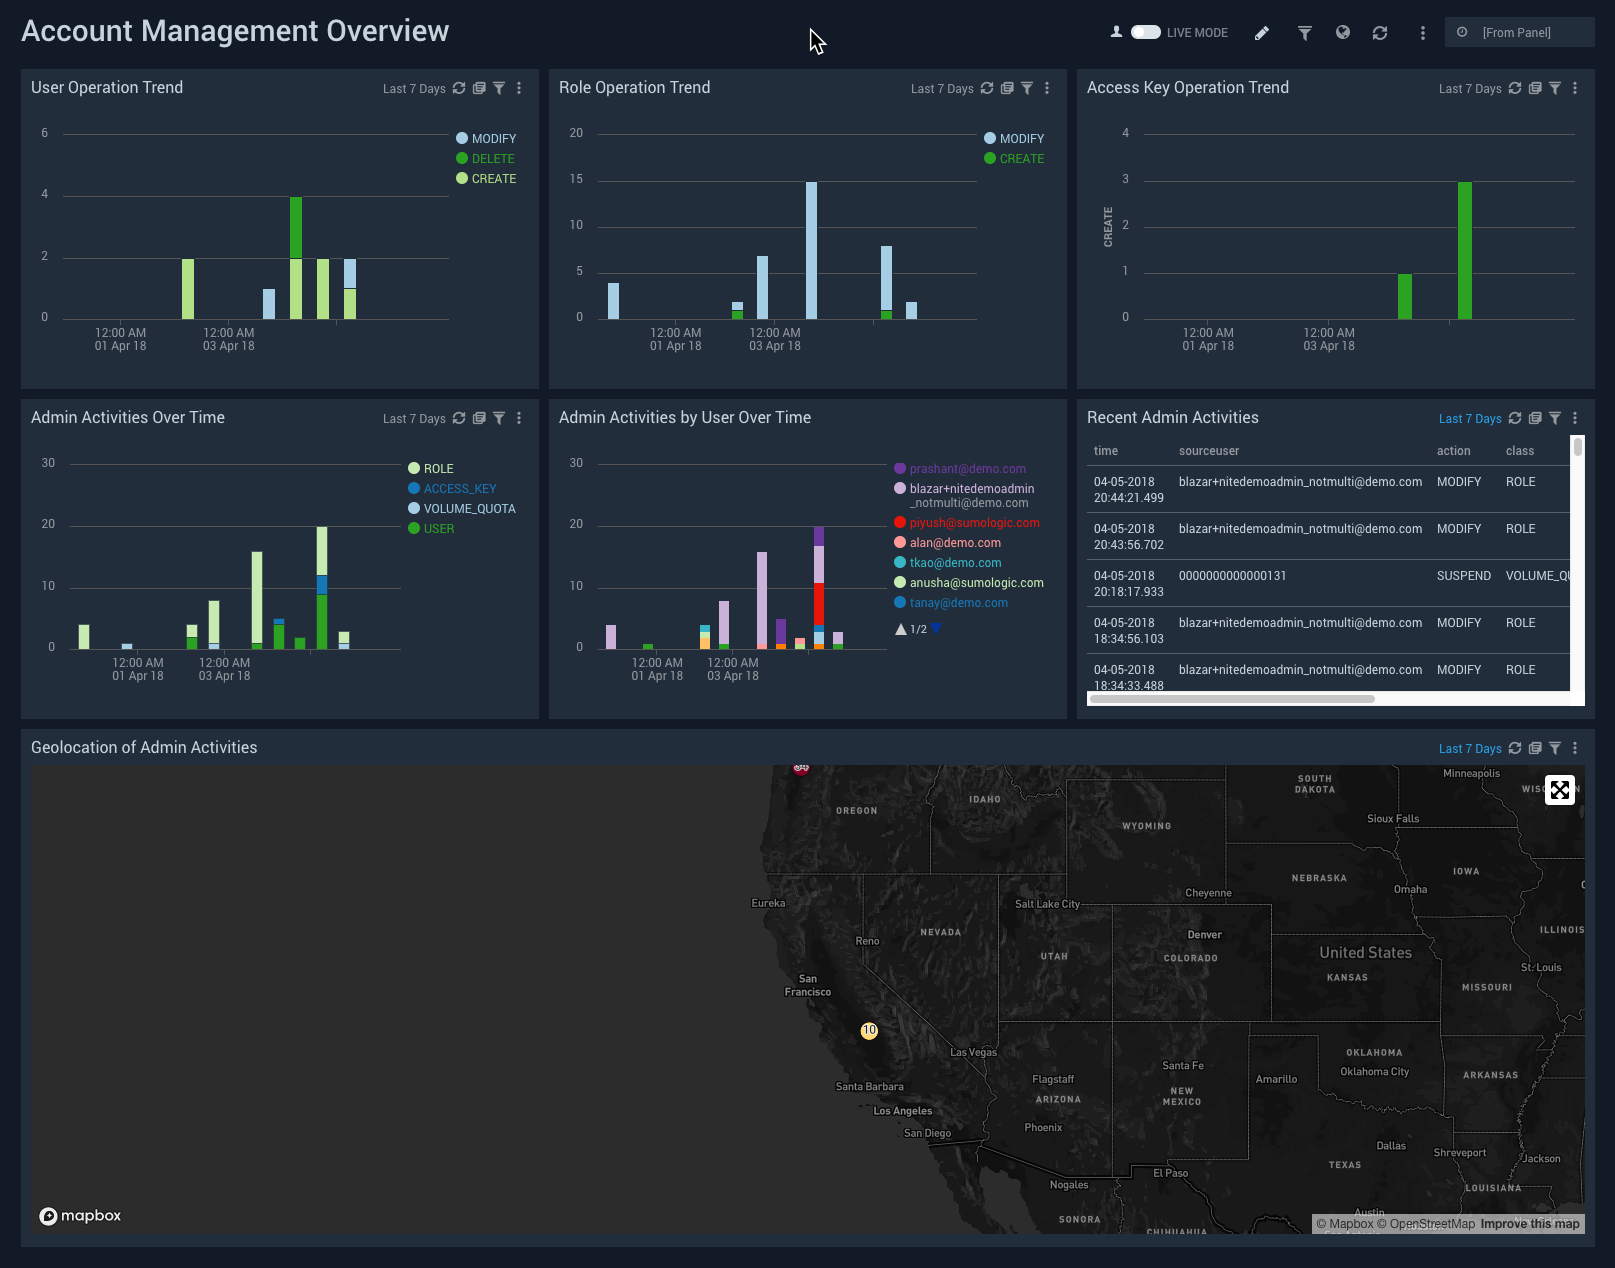
User Operation Trend. Displays the number and type (Create, Modify, and Delete) of user events performed in a stacked column chart on a timeline for the last week.
Role Operation Trend. Shows the number and type (Create, Modify, and Delete) of role events performed in a column chart on a timeline for the last week.
Access Key Operation Trend. Displays the number and type (Enable, Disable, Create, Delete) of access key events performed in a stacked column chart on a timeline for the last week.
Admin Activities Over Time. Shows the number and type of admin activity events performed in a stacked column chart on a timeline for the last week.
Admin Activities by User Over Time. Displays the number and type of admin activity events performed by user in a stacked column chart on a timeline for the last week.
Recent Admin Activities. Shows an aggregation table of recent admin activity events with columns for the time, user, action, class, target, and status of the event, for the last 24 hours.
Geolocation of Admin Activities. Performs a geo lookup query and displays the location and number of admin activity events on a map of the world for the last 24 hours.
Library Content - Overview
See an overview of content management actions—Install, Export, Move, and so on—that have been performed on library content (searches, dashboards/reports, and folders).
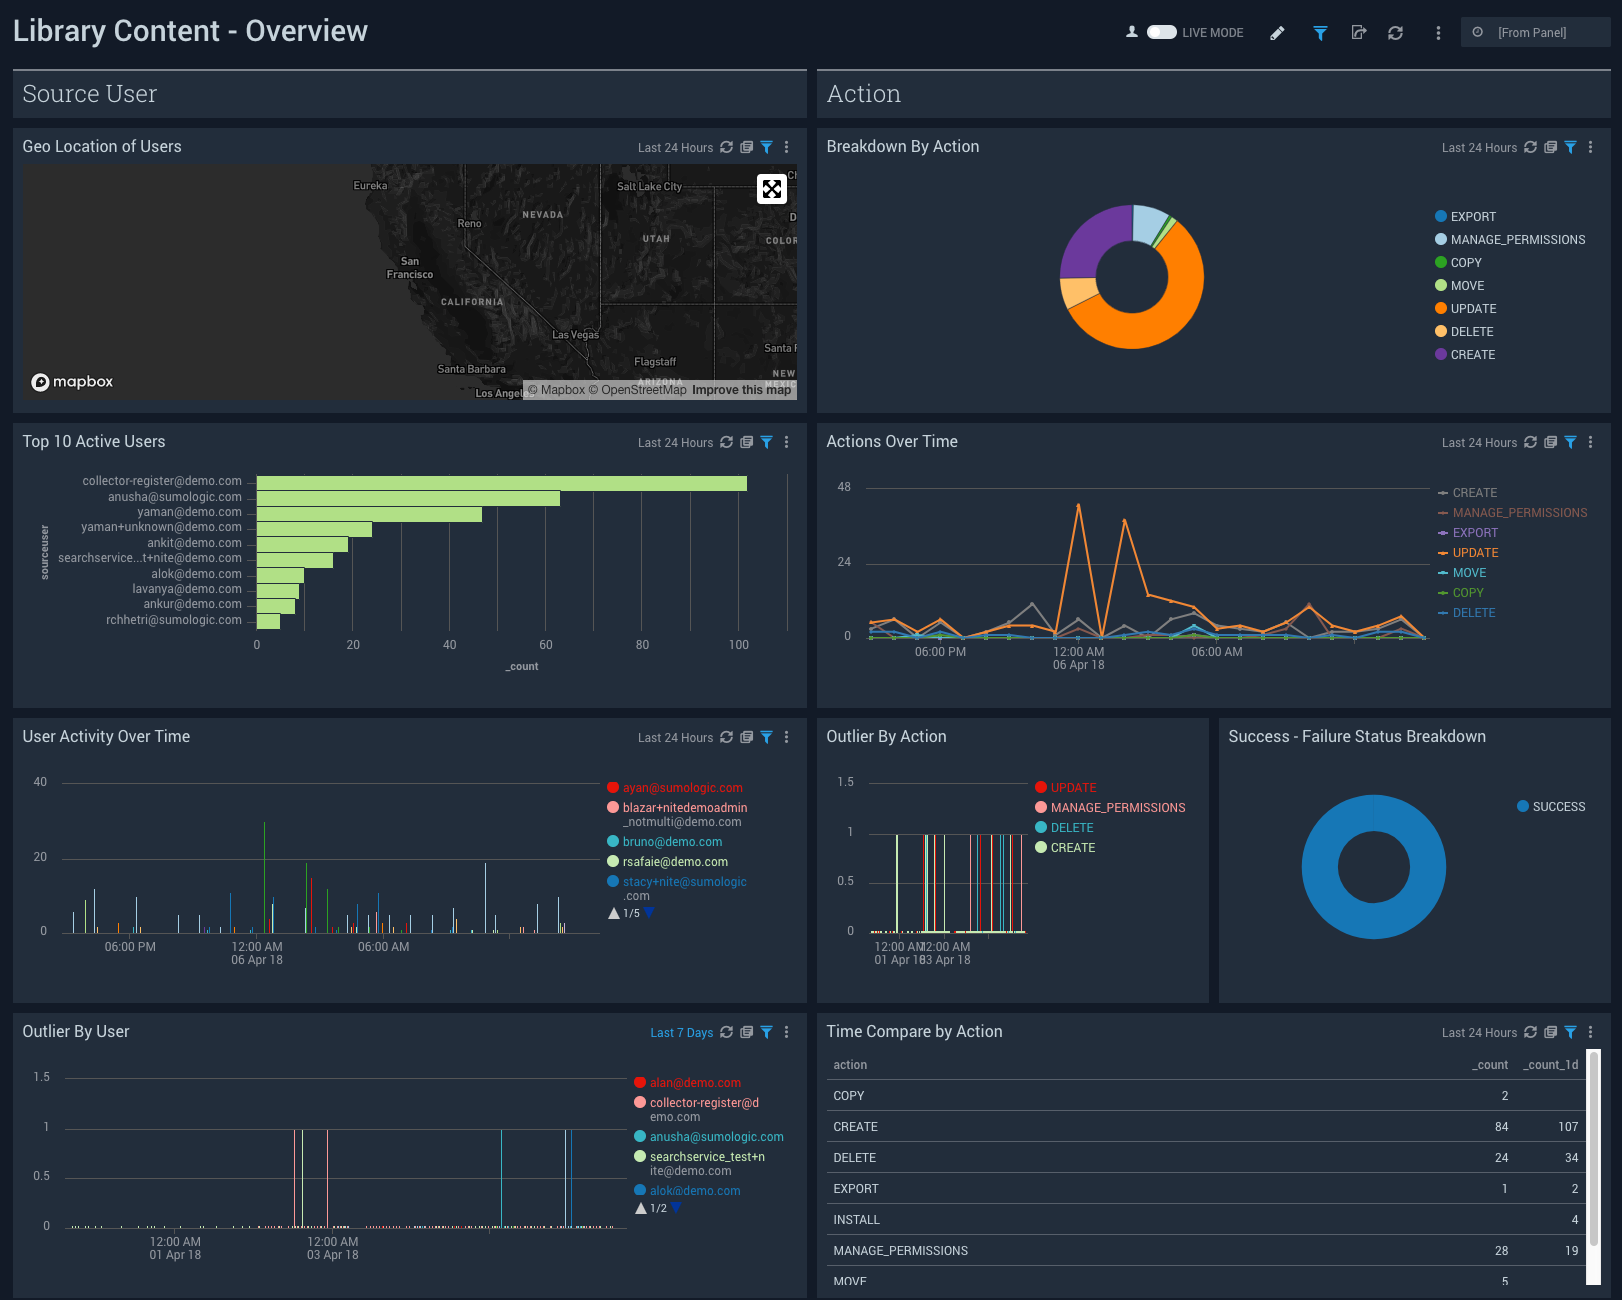
Geolocation of Admin Activities. Performs a geo lookup query and displays the location and number of admin activity events on a map of the world for the last 24 hours.
Breakdown By Action. Shows a breakdown of the types of actions performed, such as the installing, exporting, managing permissions, moving, updating, importing, exporting, creating and deleting of library content on a pie chart for the last 24 hours.
Top 10 Active Users. Shows the top ten active users on a bar chart for the last 24 hours.
Actions Over Time. Shows the count of the types of actions such as the installing, exporting, managing permissions, moving, updating, importing, exporting, creating and deleting of library content, on a line chart for the last 24 hours.
User Activity Over Time. Shows the count of user activity by user on a column chart for the last 24 hours.
Outlier By Action. Shows any outliers from the standard deviations in actions, such as the installing, exporting, managing permissions, moving, updating, importing, exporting, creating and deleting of library content, on a column chart for the last 24 hours.
Success - Failure Status Breakdown. Shows the number of successful or failed statuses on a pie chart for the last 24 hours.
Outlier By User. Shows any outstanding counts of user activity on a column chart for the last 24 hours.
Time Compare by Action. Displays a table that shows the current count of actions such as the installing, exporting, managing permissions, moving, updating, importing, exporting, creating and deleting of library content, compared to the count from one day ago.
Library Content - Updated Permission
See information about permissions added or removed to Library content scheduled searches, dashboards, and folders.
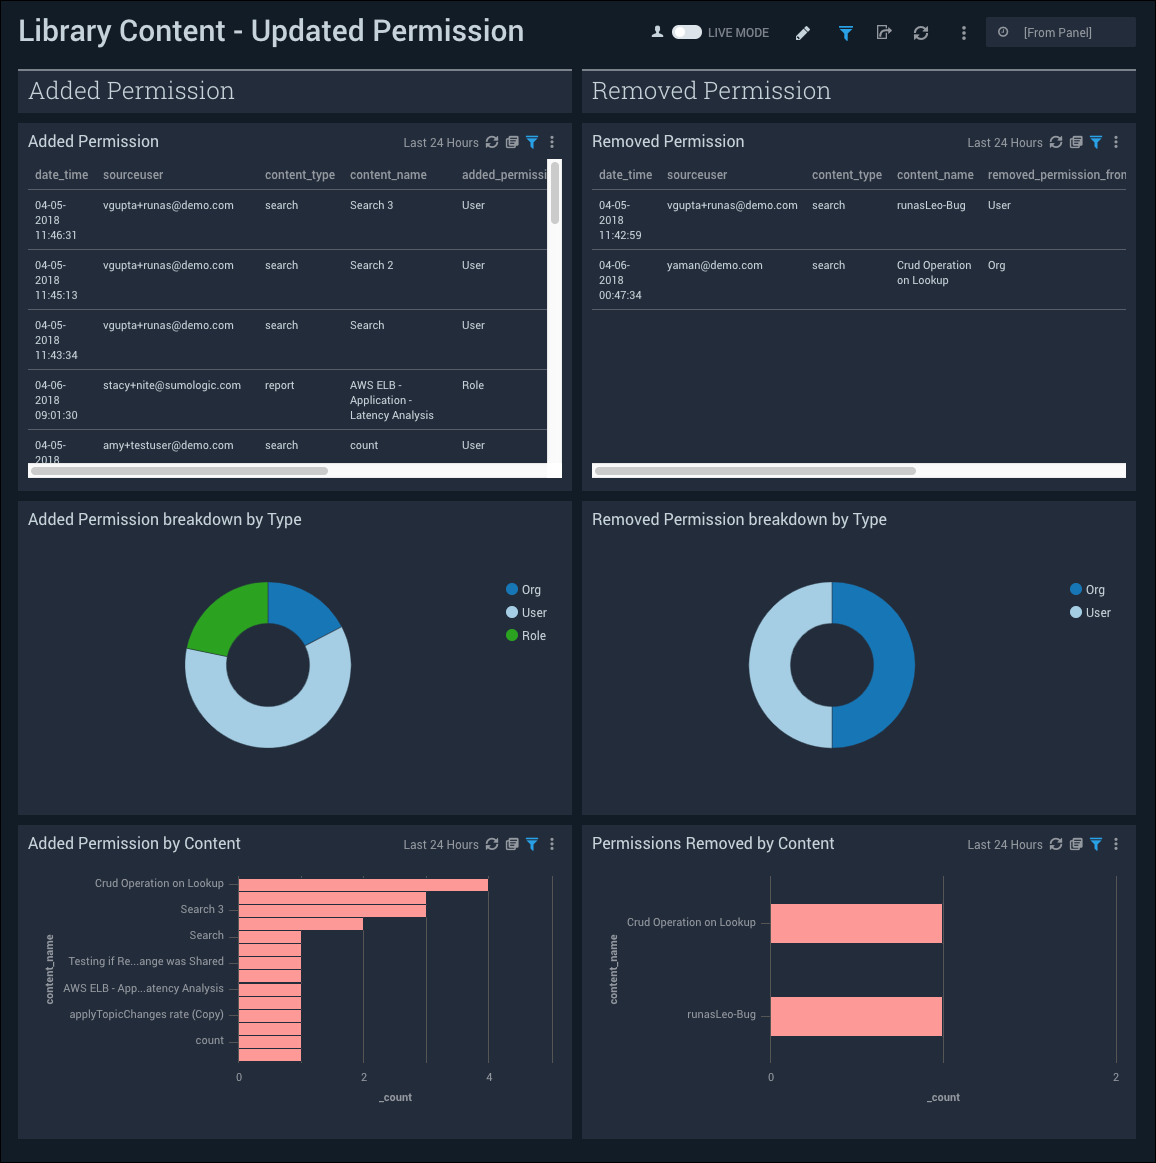
Added Permission. Shows an aggregation table of permissions added with columns for the time, user, type of content, role, target, type of permissions, and count, for the last 24 hours.
Removed Permission. Shows an aggregation table of permissions removed with columns for the time, user, type of content, type, target, type of permissions, and count, for the last 24 hours.
Added Permission breakdown by Type. Displays the type (user, role, organization) that was given permission on a pie chart for the last 24 hours.
Removed Permission breakdown by Type. Displays the type (i.e. user, role, organization) that was removed of permission on a pie chart for the last 24 hours.
Added Permission by Content. Shows the number of users that were given permission to library content (searches, dashboards, folders) on a bar chart for the last 24 hours.
Permissions Removed by Content. Shows the number of users that had their permission to library content (searches, dashboards, folders) removed on a bar chart for the last 24 hours.
Library Content - Admin Mode
See information about content management actions made in Admin mode to Library content searches, dashboards/reports, and folders). The dashboard shows information about content changes, include the deletion, whitelisting, and sharing of content; and the addition or removal of permissions.
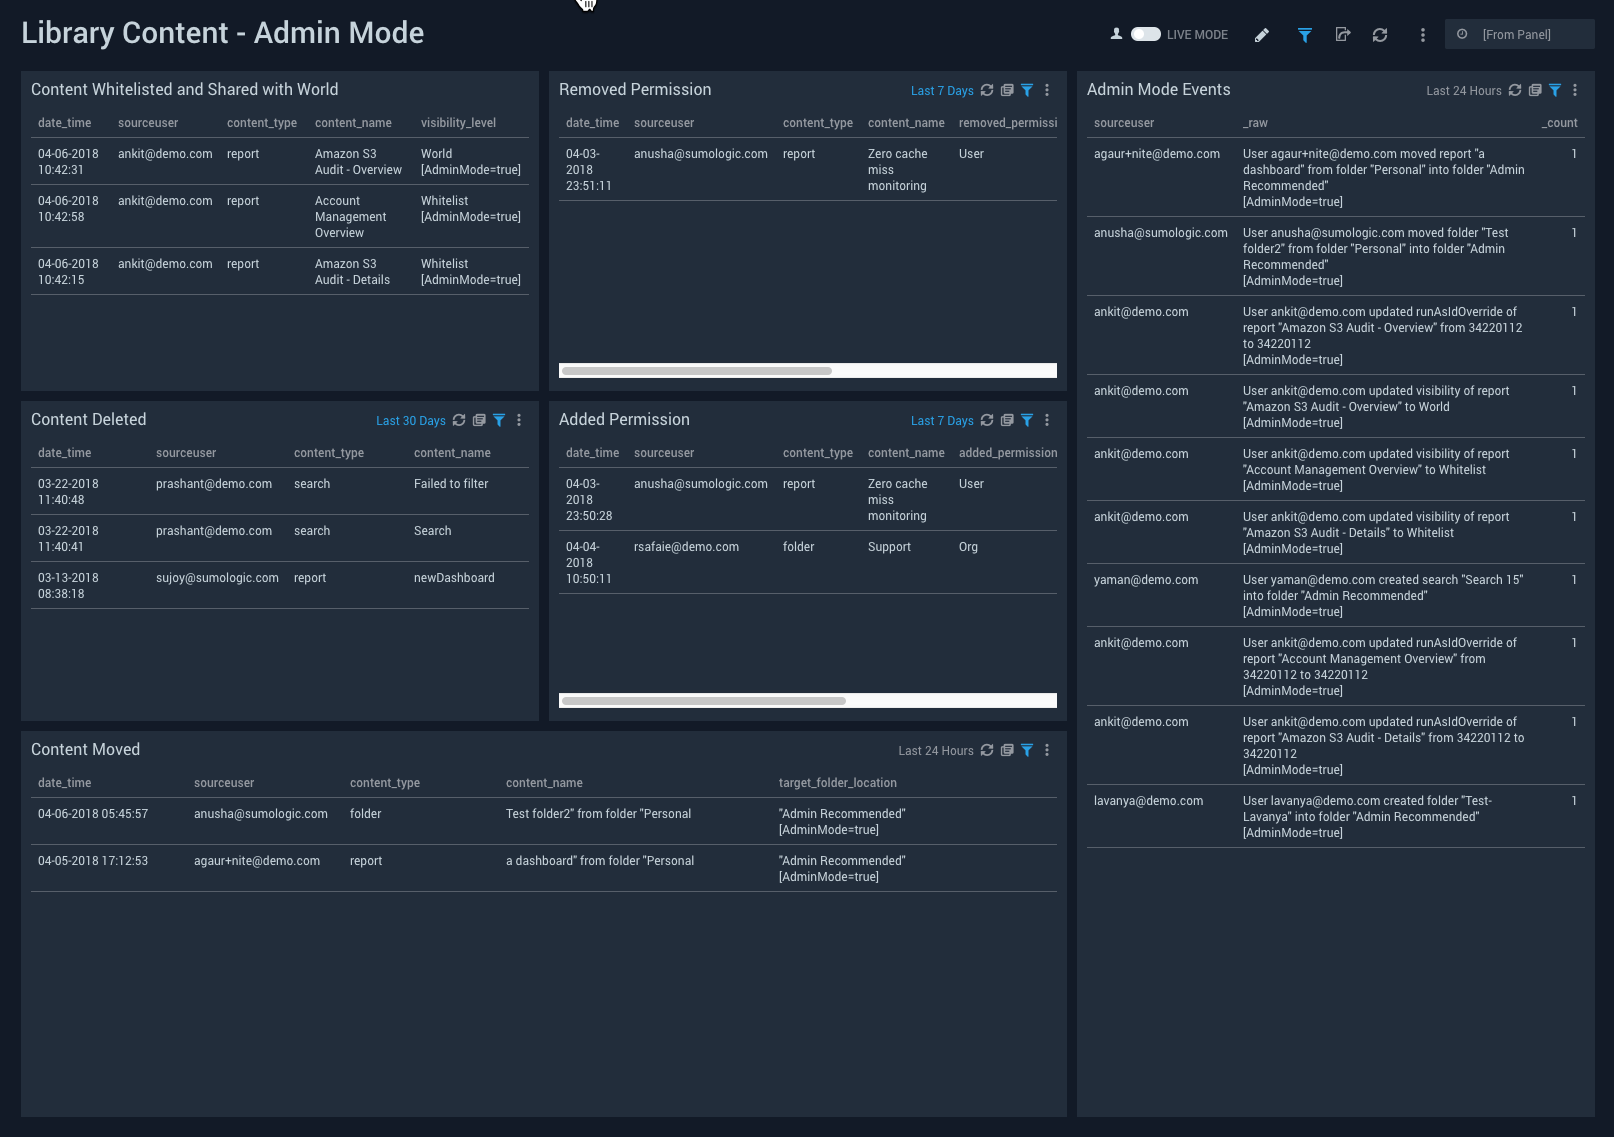
Content Whitelisted and Shared with World. Shows an aggregation table of content whitelisted and shared with the world with columns for the time, user, type of content, name of content, and level of visibility, for the last 24 hours.
Removed Permission. Shows an aggregation table of permissions remove with columns for the time, user, type of content, name of content, type, target, permissions removed, and count, for the last 24 hours.
Admin Mode Events. Shows an aggregation table of admin mode events with columns for the user, raw log message, and count, for the last 24 hours.
Content Deleted. Shows an aggregation table of content deleted with columns for the time, user, type of content, and name of content, for the last 24 hours.
Added Permission. Shows an aggregation table of permissions added with columns for the time, user, type of content, name of content, type, target, permissions added, and count, for the last 24 hours.
Content Moved. Shows an aggregation table of content moved with columns for the time, user, type of content, and target folder location, for the last 24 hours.
Library Content - Created/Deleted/Moved/Copied
See information about content management actions performed to Library content (scheduled searches, dashboards, folders). The dashboard provides information about actions such as content deletion, content moved, and content copied.
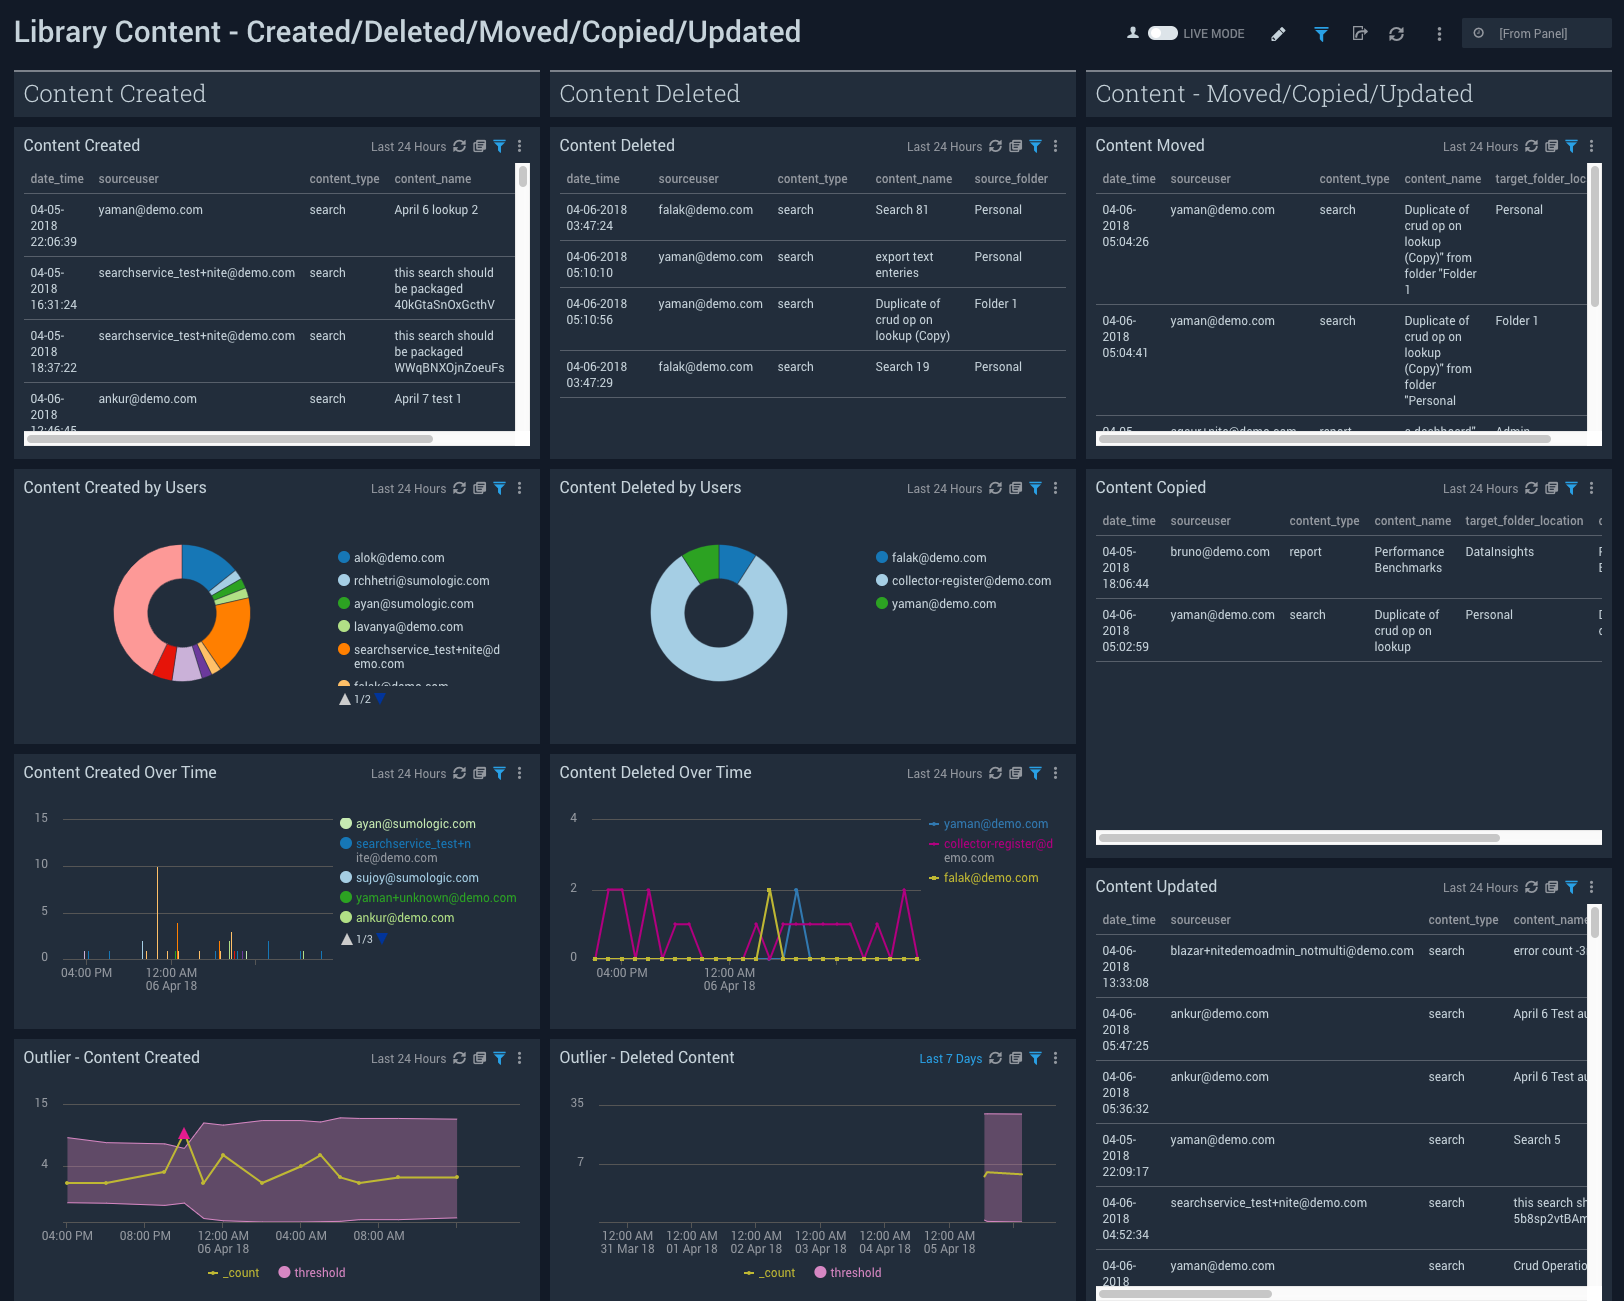
Content Created. Shows an aggregation table of library content created with columns for the time, user, type of content, name of content, and folder location, for the last 24 hours.
Content Deleted. Shows an aggregation table of library content deleted with columns for the time, user, type of content, name of content, and source folder, for the last 24 hours.
Content Moved. Shows an aggregation table of library content moved with columns for the time, user, type of content, name of content, and location of target folder, for the last 24 hours.
Content Created by Users. Displays the number of library content created by each user on a pie chart for the last 24 hours.
Content Deleted by Users. Displays the number of library content deleted by each user on a pie chart for the last 24 hours.
Content Copied. Shows an aggregation table of library content copied with columns for the time, user, type of content, name of content, location of target folder, and name of the copied content, for the last 24 hours.
Content Created Over Time. Displays the number of library content created by each user on a column chart for the last 24 hours.
Content Deleted Over Time. Displays the number of library content deleted by each user on a column chart for the last 24 hours.
Content Updated. Shows an aggregation table of library content updated with columns for the time, user, type of content, name of content, old name of the content, old description of the content, new name of the content, new description of the content, and count, for the last 24 hours.
Outlier - Content Created. Shows any outliers from the standard deviations in library content created on a line chart with the threshold for the last 24 hours.
Outlier - Deleted Content. Shows any outliers from the standard deviations in library content deleted on a line chart with the threshold for the last 24 hours.
Library Content - Imported/Exported/Installed/Shared Publicly
See information about Library Content (searches, dashboards/reports, and folders) that has been shared, exported or imported.
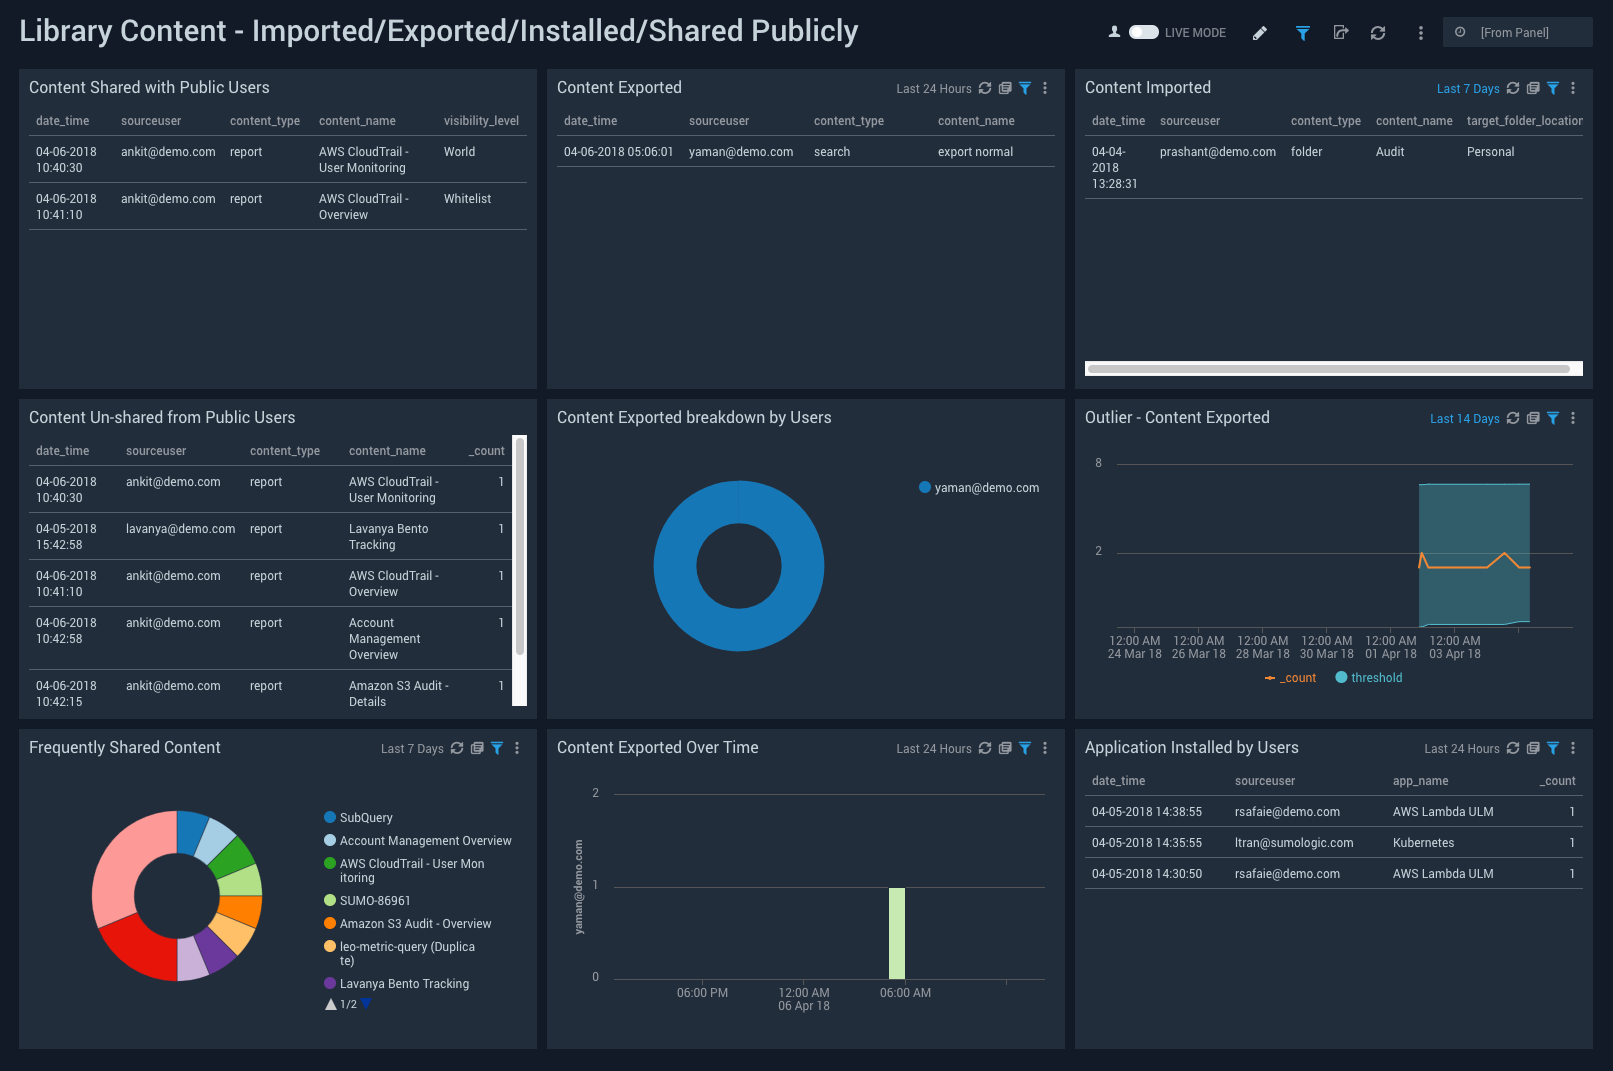
Content Shared with Public Users. Shows an aggregation table of library content shared with public users with columns for the time, user, type of content, name of content, and level of visibility, for the last 24 hours.
Content Exported. Shows an aggregation table of library content exported with columns for the time, user, type of content, and name of content, for the last 24 hours.
Content Imported. Shows an aggregation table of library content imported with columns for the time, user, type of content, name of content, and location of target folder, for the last 24 hours.
Content Un-shared from Public Users. Shows an aggregation table of library content un-shared from public users with columns for the time, user, type of content, name of the content, and count, for the last 24 hours.
Content Exported breakdown by Users. Displays the number of library content exported by each user on a pie chart for the last 24 hours.
Outlier - Content Exported. Shows any outliers from the standard deviations in library content exported on a line chart with the threshold for the last 24 hours.
Frequently Shared Content. Displays the number of frequently shared library content by each user on a pie chart for the last 24 hours.
Content Exported Over Time. Show the number of library content exported by users on a column chart for the last 24 hours.
Application Installed by Users. Shows an aggregation table of applications installed by users with columns for the time, user, app name, and count, for the last 24 hours.
User Activity - Login and Credentials
See information on user activities, including modifying or resetting passwords, modifying preferences, and logging in or out.
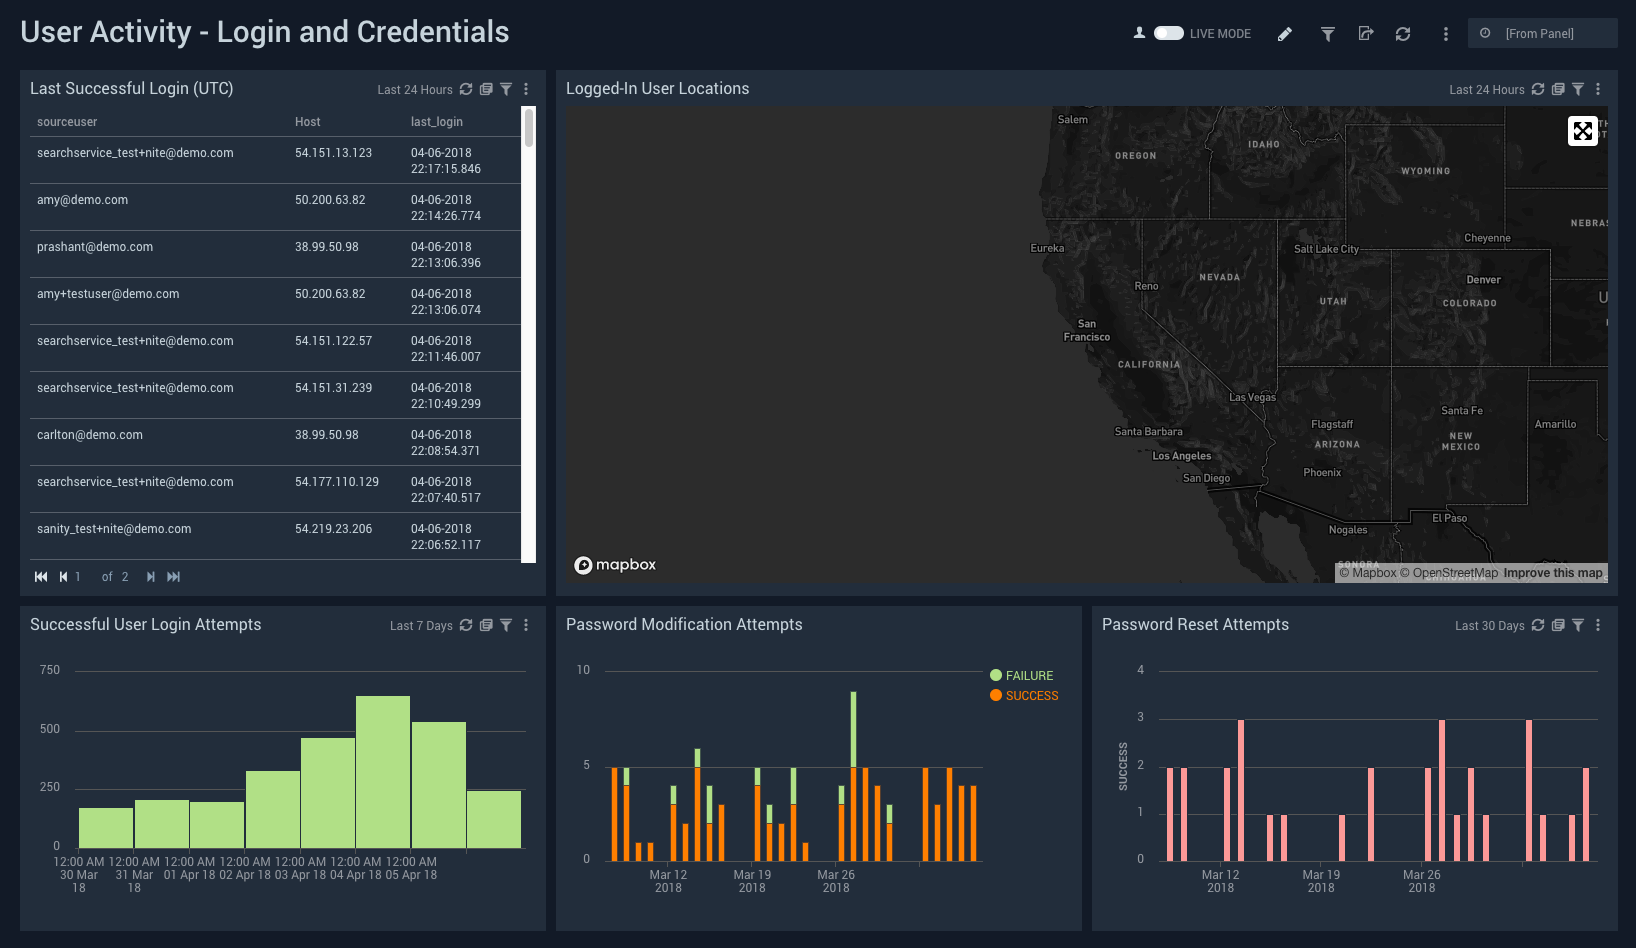
Last Successful Login (UTC). Displays an aggregation table of the last successful login per user, including the host and UTC event time for the last 24 hours.
Logged-In User Locations. Performs a geo lookup query and displays the location and number of logged-in users on a map of the world for the last 24 hours.
Successful User Login Attempts. Counts the number of successful user login attempt events and displays them in a column chart on a timeline of days for the last week.
Password Modification Attempts. Counts the number of password modification attempt events and displays them in a column chart on a timeline of days for the last month.
Password Reset Attempts. Counts the number of password reset attempt events and displays them in a column chart on a timeline of days for the last month.
User Activity - Scheduled Search
See information on user activity pertaining to scheduled searches or scheduled search events (Start, Finish, Create, Delete, Update, Timeout, Skip, Suspend, Unsuspend).
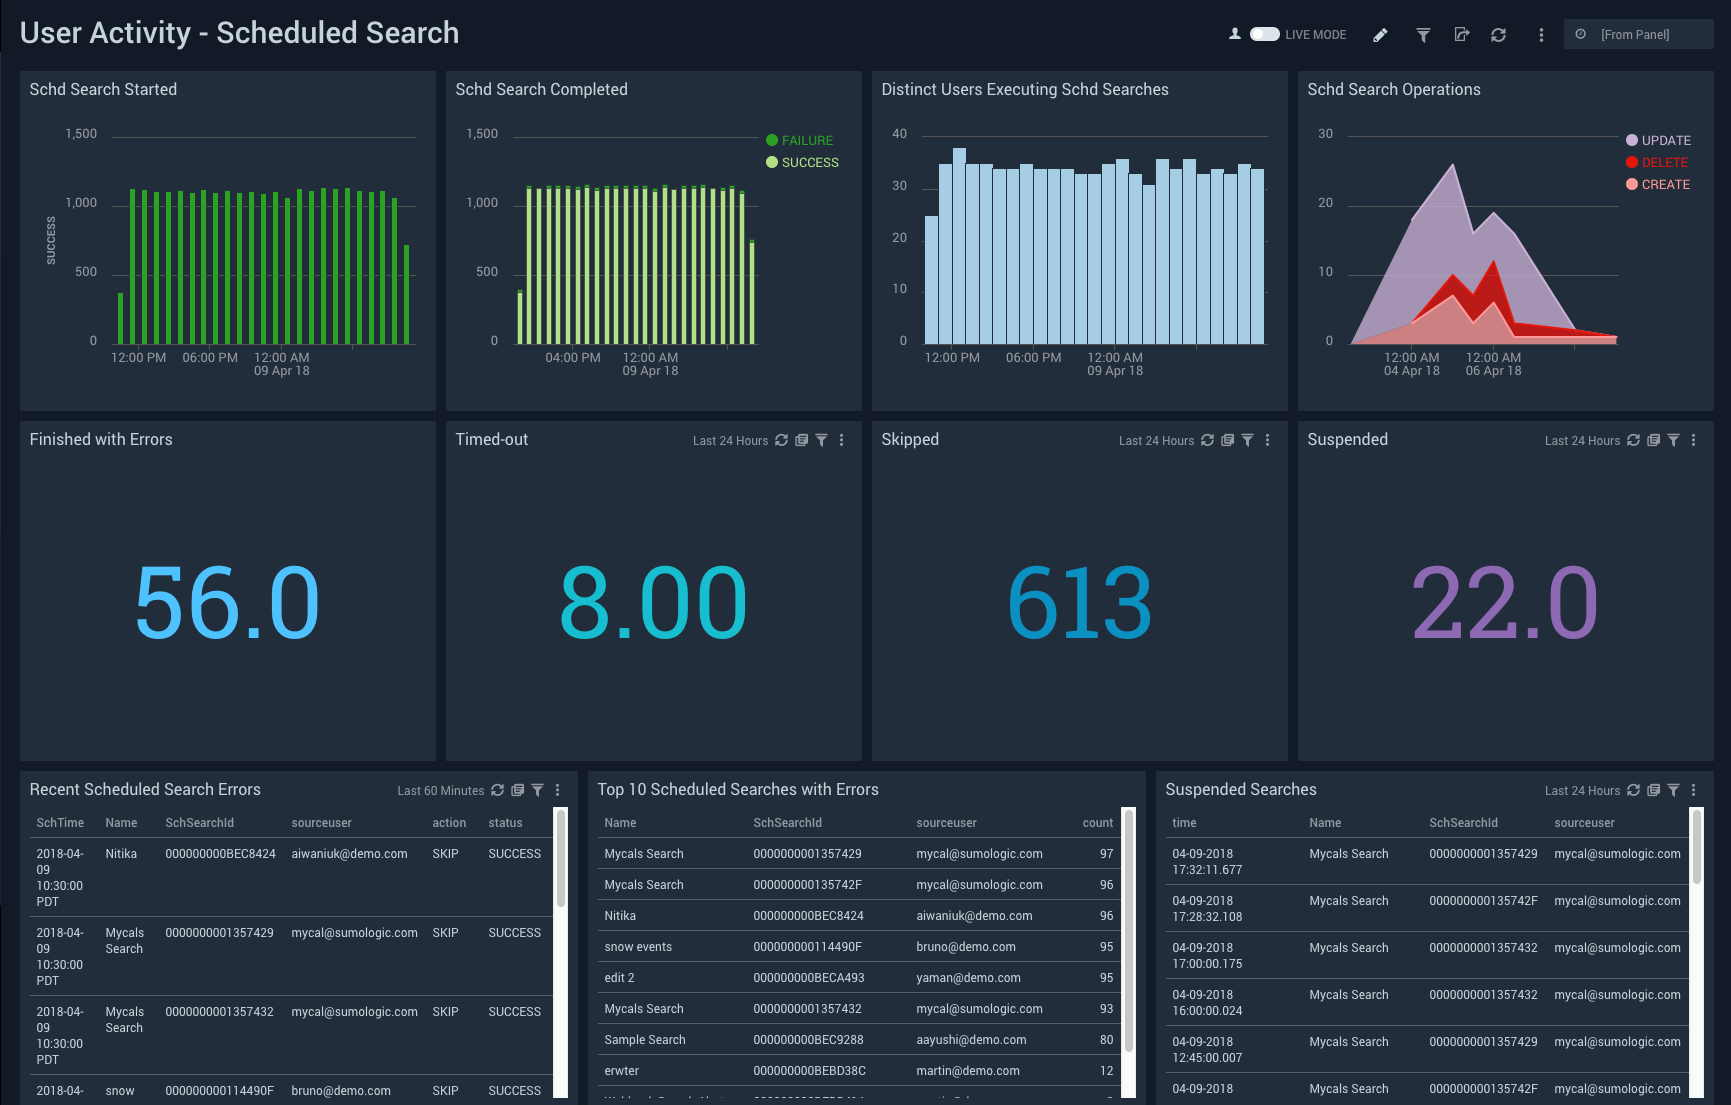
Scheduled Search Started. Counts the number of successfully started scheduled searches events and displays them in a column chart on a timeline for the last 24 hours.
Scheduled Search Completed. Counts the number of scheduled searches completed in either start or failure events and displays them in a stacked column chart on a timeline for the last 24 hours.
Distinct Users Executing Scheduled Searches. Counts the number of distinct users executing scheduled searches and displays them in a column chart on a timeline for the last 24 hours.
Scheduled Search Operations. Displays the overall scheduled search operation events in an area chart on a timeline for the last week.
Finished with Errors. Counts the number of scheduled searches that finished with errors and displays the number in a single value chart for the last 24 hours.
Timed-out. Counts the number of scheduled searches that have timed out and displays them in a single value chart for the last 24 hours.
Skipped. Counts the number of scheduled searches that were skipped and displays them as a single value chart for the last 24 hours.
Suspended. Counts the number of scheduled searches that were suspended and displays them as a single value chart for the last 24 hours.
Recent Scheduled Search Errors. Displays scheduled search errors in an aggregation table with information on the search time, name, search ID, user, action, and status for the last hour.
Top 10 Scheduled Searches with Errors. Shows the top 10 scheduled searches with errors, including the search name, ID, user, and count for the last 24 hours.
Suspended Searches. Displays scheduled searches that have been suspended with information on the time, name, ID, and user for the last 24 hours.
Scheduled Search - Triggered Summary
See information on scheduled searches that have been triggered, along with details on related alerts and Webhooks.
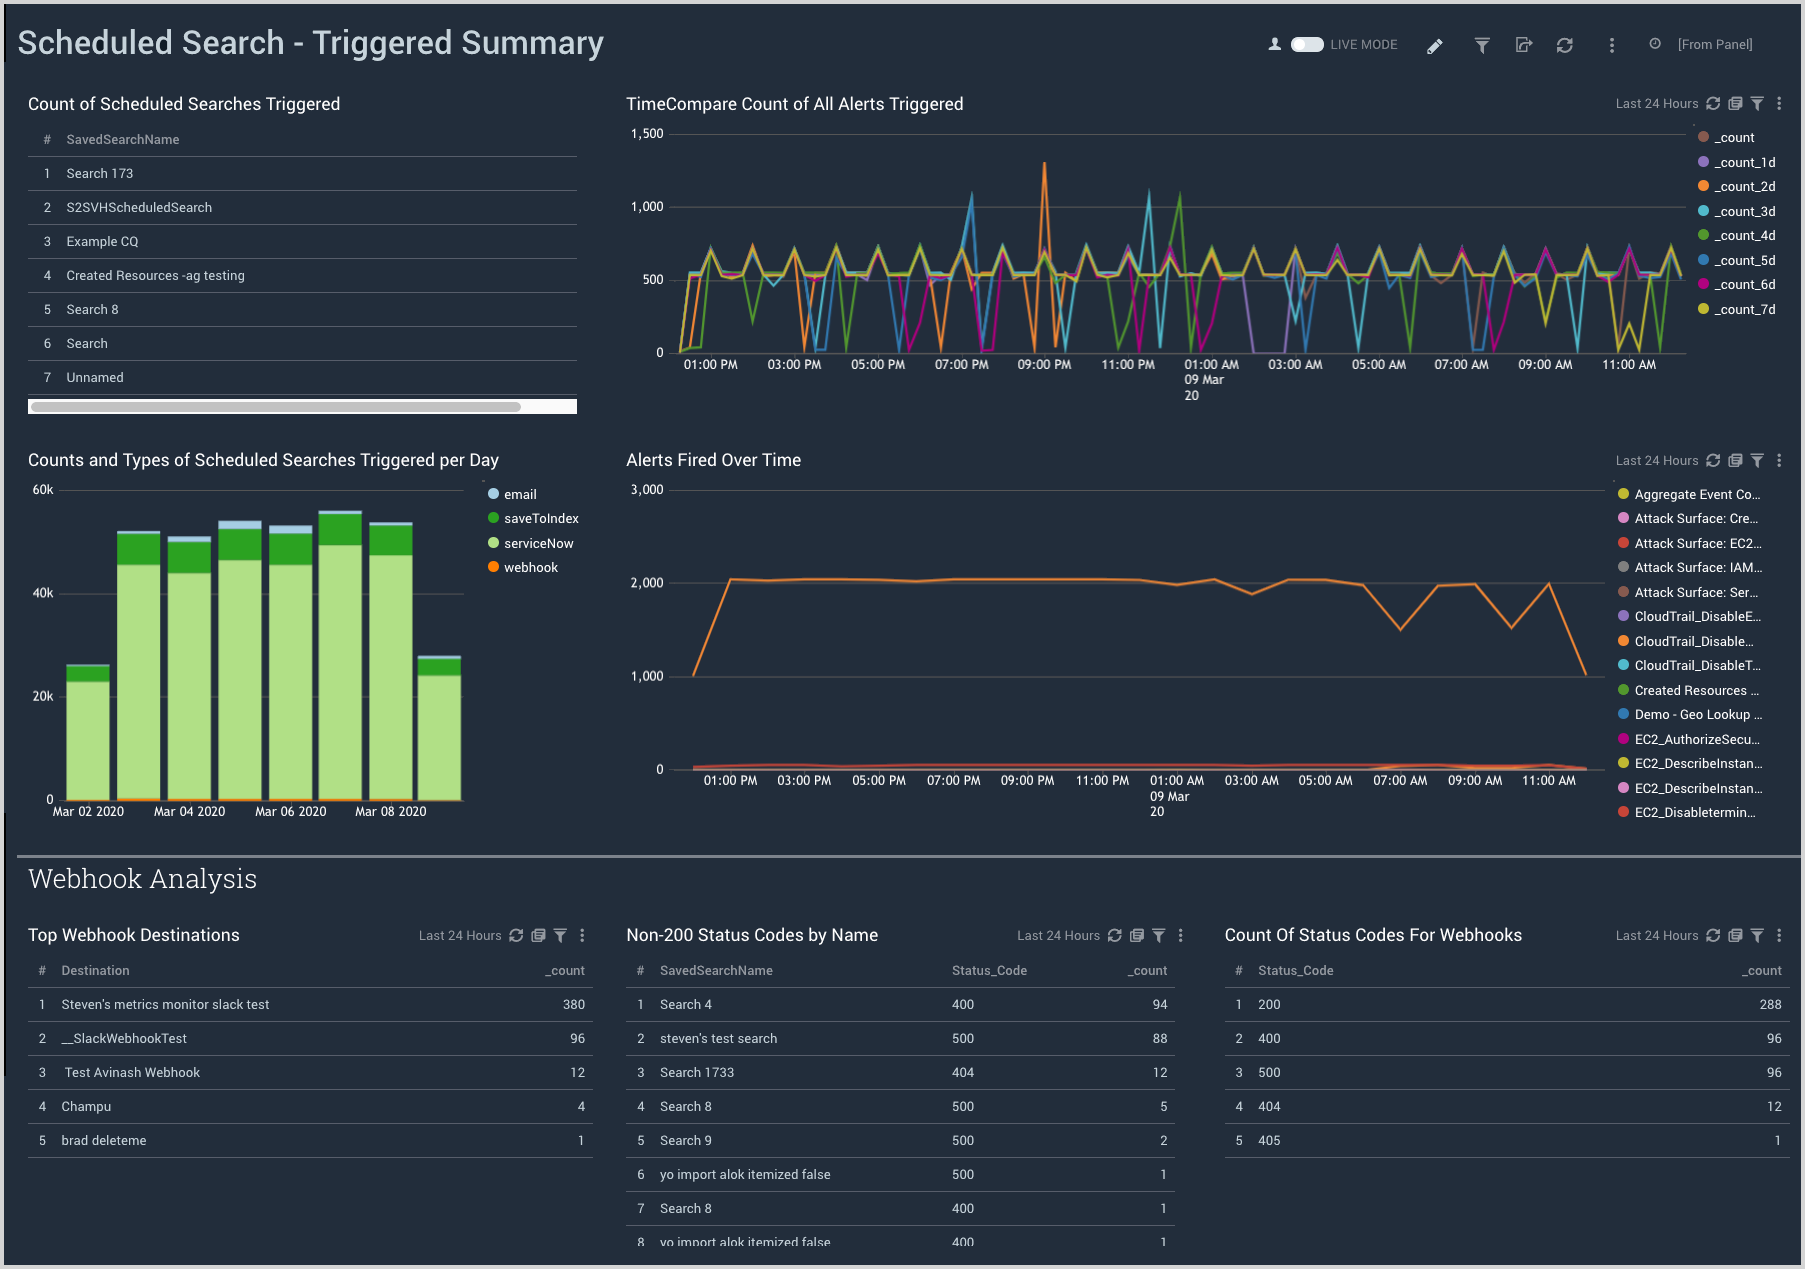
Count of Scheduled Searches Triggered. A listing of scheduled searches that have been triggered and their saved search names.
Counts and Types of Scheduled Searches Triggered per Day. The number of scheduled searches that are triggered on a daily basis, broken down by type.
TimeCompare Count of All Alerts Triggered. A comparison over time of the alerts triggered by scheduled searches.
Alerts Fired Over Time. Trends over time of the alerts fired as a result of scheduled searches.
Top Webhook Destinations. A listing of the top Webhook destinations and their respective counts.
Non-200 Status Codes by Name. Details for non-200 status code results for Webhooks with saved search names and their respective counts.
Count of Status Codes for Webhooks. A listing of status codes for Webhooks and their respective counts.
Upgrade/Downgrade the Sumo Logic Audit app (Optional)
To update the app, do the following:
Next-Gen App: To install or update the app, you must be an account administrator or a user with Manage Apps, Manage Monitors, Manage Fields, Manage Metric Rules, and Manage Collectors capabilities depending upon the different content types part of the app.
- Select App Catalog.
- In the Search Apps field, search for and then select your app.
Optionally, you can identify apps that can be upgraded in the Upgrade available section. - To upgrade the app, select Upgrade from the Manage dropdown.
- If the upgrade does not have any configuration or property changes, you will be redirected to the Preview & Done section.
- If the upgrade has any configuration or property changes, you will be redirected to the Setup Data page.
- In the Configure section of your respective app, complete the following fields.
- Field Name. If you already have collectors and sources set up, select the configured metadata field name (eg _sourcecategory) or specify other custom metadata (eg: _collector) along with its metadata Field Value.
- Click Next. You will be redirected to the Preview & Done section.
Post-update
Your upgraded app will be installed in the Installed Apps folder and dashboard panels will start to fill automatically.
See our Release Notes changelog for new updates in the app.
To revert the app to a previous version, do the following:
- Select App Catalog.
- In the Search Apps field, search for and then select your app.
- To version down the app, select Revert to < previous version of your app > from the Manage dropdown.
Uninstalling the Sumo Logic Audit app (Optional)
To uninstall the app, do the following:
- Select App Catalog.
- In the 🔎 Search Apps field, run a search for your desired app, then select it.
- Click Uninstall.