Sumo Logic Infrequent Data Tier App
The Infrequent Data Tier app provides visibility into the On-demand Search usage and costs associated with Infrequent Data Tier by providing intuitive pre-configured dashboard and searches. Infrequent Data Tiers are an economical, fully managed log analytics solution for high volume, infrequently accessed data. With Infrequent Data Tiers, organizations have a solution that can aggregate, store and analyze verbose sources such as App Debug, CDN, Load Balancer, and other infrequently accessed logs at a dramatically lower price point.
With growing adoption of modern application stacks that leverage micro-services and distributed architectures, organizations are generating more and more machine data. A large part of this data is not required for every day mission-critical operations. However, organizations still need to retain and analyze this data, as it can provide value across multiple groups within a digital enterprise. A cost efficient solution that manages infrequently used data is currently lacking in the market place, forcing customers to either not retain the data or build home-grown solutions that are difficult to maintain, secure, and don’t provide easy access to insights when enterprise needs it.
Log types
The Search Audit Index for Infrequent Data Tier App has the following fields:
- analytics_tier
- capacity_used
- daily_capacity
- data_retrieved_bytes
- data_scanned_bytes
- execution_duration_ms
- is_aggregate
- query
- query_end_time
- query_start_time
- query_type
- remote_ip
- retrieved_message_count
- scanned_message_count
- scanned_partition_count
- session_id
- status_me
You can start using the index by using following query:
_index=sumologic_search_usage_per_query \
analytics_tier="Infrequent"
Sample queries
The following query is from the Data Scanned Over Time panel of the Infrequent Cost dashboard.
_index=sumologic_search_usage_per_query analytics_tier = "Infrequent" !(user_name=*sumologic.com) !(status_message="Query Failed")
| fields data_scanned_bytes, query, is_aggregate, query_type, remote_ip, retrieved_message_count, scanned_message_count, scanned_partition_count, session_id, status_message, user_name
|data_scanned_bytes / 1Gi as sizeInGB
| timeslice 1d
| sum (sizeInGB) as total_data_scanned_GB, count as query_count by _timeslice
| fillmissing timeslice (1d)
Prerequisites
Sumo Logic Infrequent Data Tier App is only available for Enterprise Suite customers.
| Account Type | Account Level |
| Credits | Enterprise Suite |
Collecting Data for the Infrequent Data Tier App
Infrequent Data Tiers enable you to ingest log or machine data for a minimal cost per GB. Your data is then securely stored by Sumo Logic and is instantly available on-demand for interactive analysis without any additional preparation, re-ingestion, or rehydration. This service is ideal when you need to quickly and/or periodically investigate issues, troubleshoot code, configuration problems, or address customer support cases which can rely on searching high volumes of data for insights. This allows you to only pay for the specific data sets that you analyze at a given time.
Infrequent Data Tiers allow you to effectively analyze high volumes of log data that is accessed on a minimal basis. In this data tier, you pay for the amount of data scanned in each search. This on-demand payment model allows you to minimize costs by only paying the data accessed.
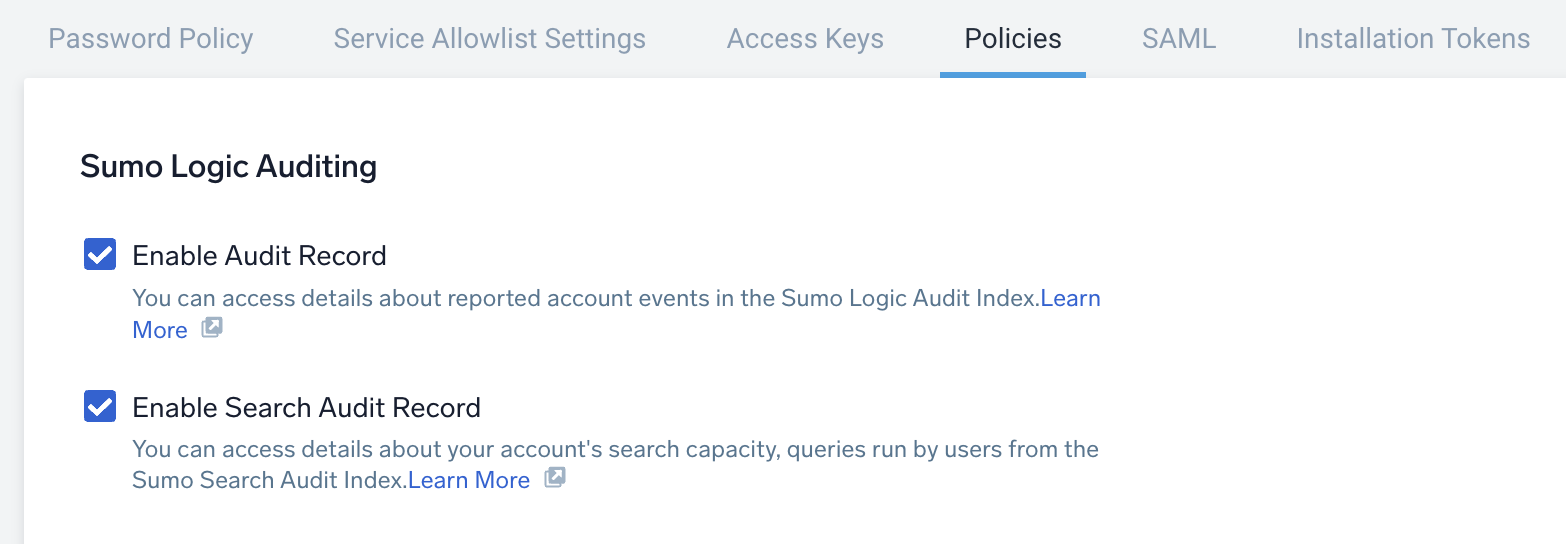
The Search Audit Index must be enabled by an administrator. To enable the Search Audit Index:
- Classic UI. In the main Sumo Logic menu, select Administration > Security > Policies.
New UI. In the top menu select Administration, and then under Account Security Settings select Policies. You can also click the Go To... menu at the top of the screen and select Policies. - Under Sumo Logic Auditing, select Enable Search Audit Record.
You can verify if you already have the Search Audit Index enabled by querying:
_index=sumologic_search_usage_per_query
If no results are returned even for longer time ranges, it means you do not have Search Audit index enabled.
Installing the Infrequent Data Tier app
To install the app:
- Select App Catalog.
- In the Search Apps field, search for and then select your app.
- Optionally, you can scroll down to preview the dashboards included with the app. Then, click Install App (sometimes this button says Add Integration).
- Click Next.
- Look for the dialog confirming that your app was installed successfully.
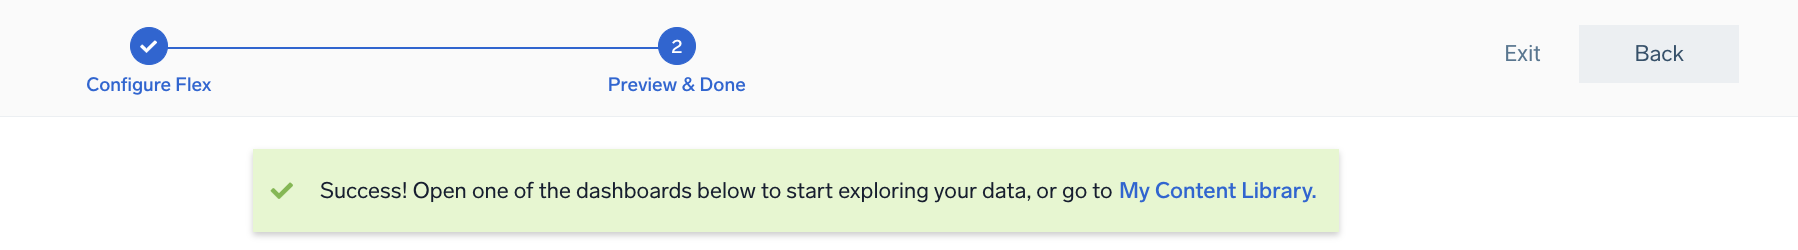
Once an app is installed, it will appear in your Personal folder or the folder that you specified. From here, you can share it with other users in your organization. Dashboard panels will automatically start to fill with data matching the time range query received since you created the panel. Results won't be available immediately, but within about 20 minutes, you'll see completed graphs and maps.
Viewing Infrequent Data Tier dashboards
All dashboards have a set of filters that you can apply to the entire dashboard. Use these filters to drill down and examine the data to a granular level.
- You can change the time range for a dashboard or panel by selecting a predefined interval from a drop-down list, choosing a recently used time range, or specifying custom dates and times. Learn more.
- You can use template variables to drill down and examine the data on a granular level. For more information, see Filtering Dashboards with Template Variables.
- Most Next-Gen apps allow you to provide the scope at the installation time and are comprised of a key (
_sourceCategoryby default) and a default value for this key. Based on your input, the app dashboards will be parameterized with a dashboard variable, allowing you to change the dataset queried by all panels. This eliminates the need to create multiple copies of the same dashboard with different queries.
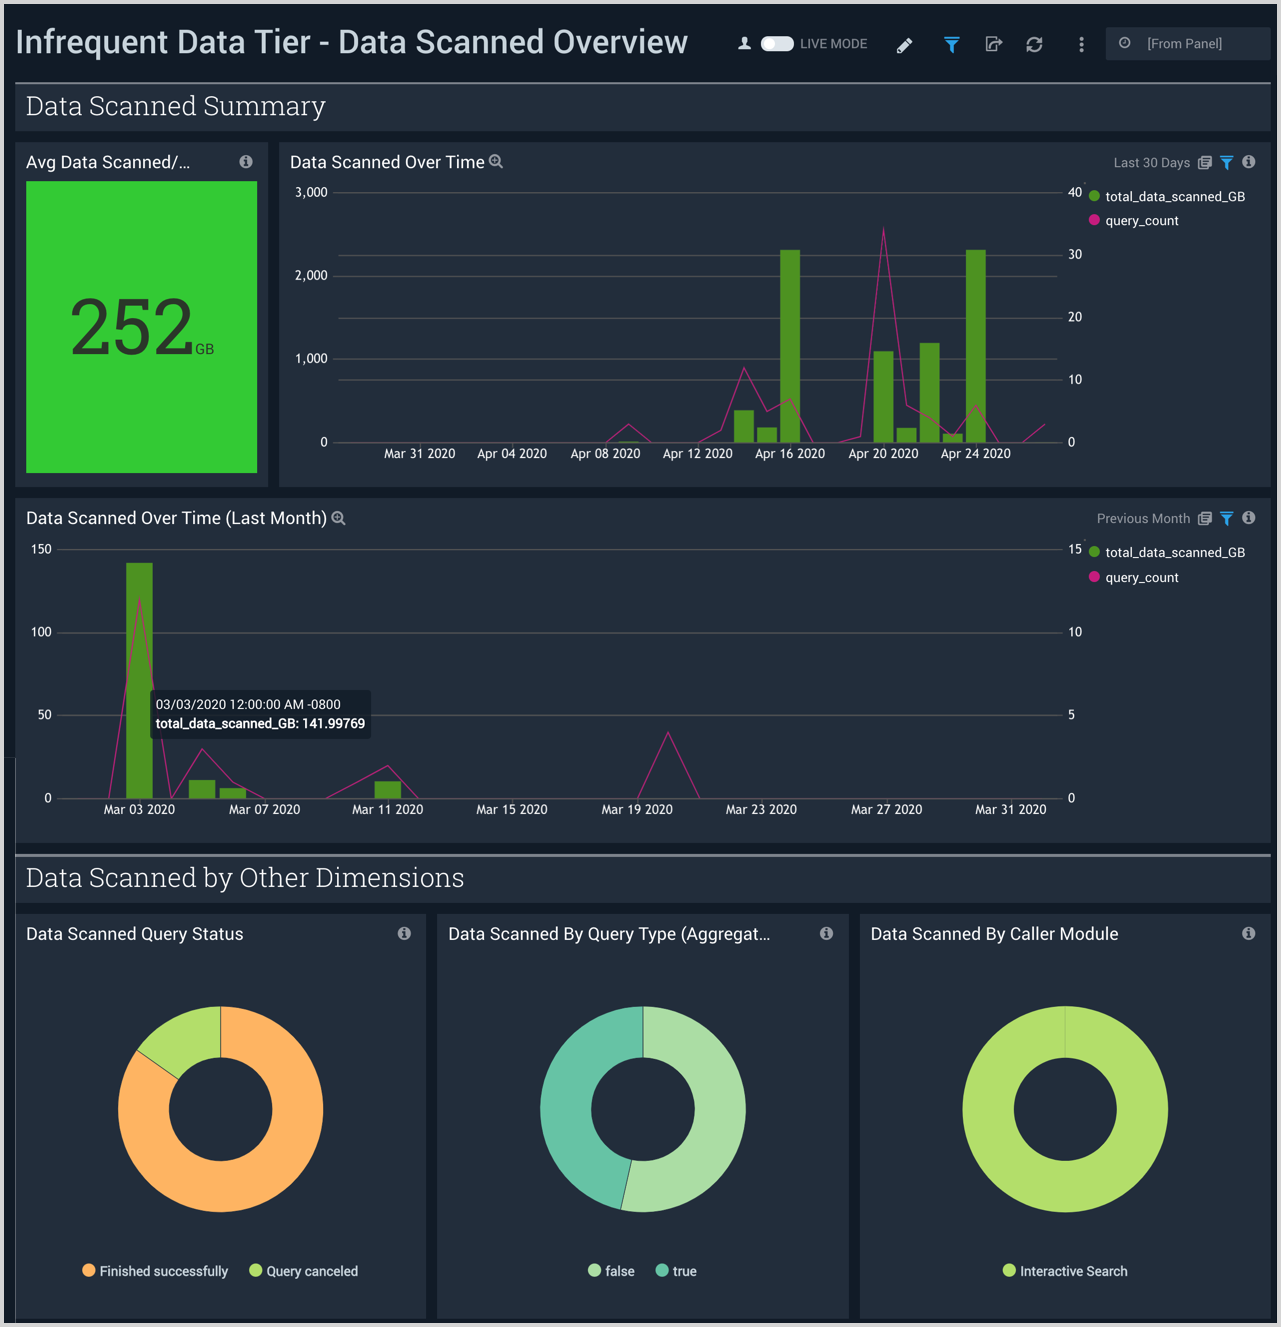
Data Scanned Overview
The Infrequent Data Tier - Data Scanned Overview dashboard provides visibility into the total amount of data scanned by infrequent queries. This allows you to monitor and control on-demand search costs for the Infrequent Tier.
Use this dashboard to:
- Monitor data scan information per day.
- Analyze monthly comparisons of scanned data.
- Understand data scanned by caller module, query type, and query status.
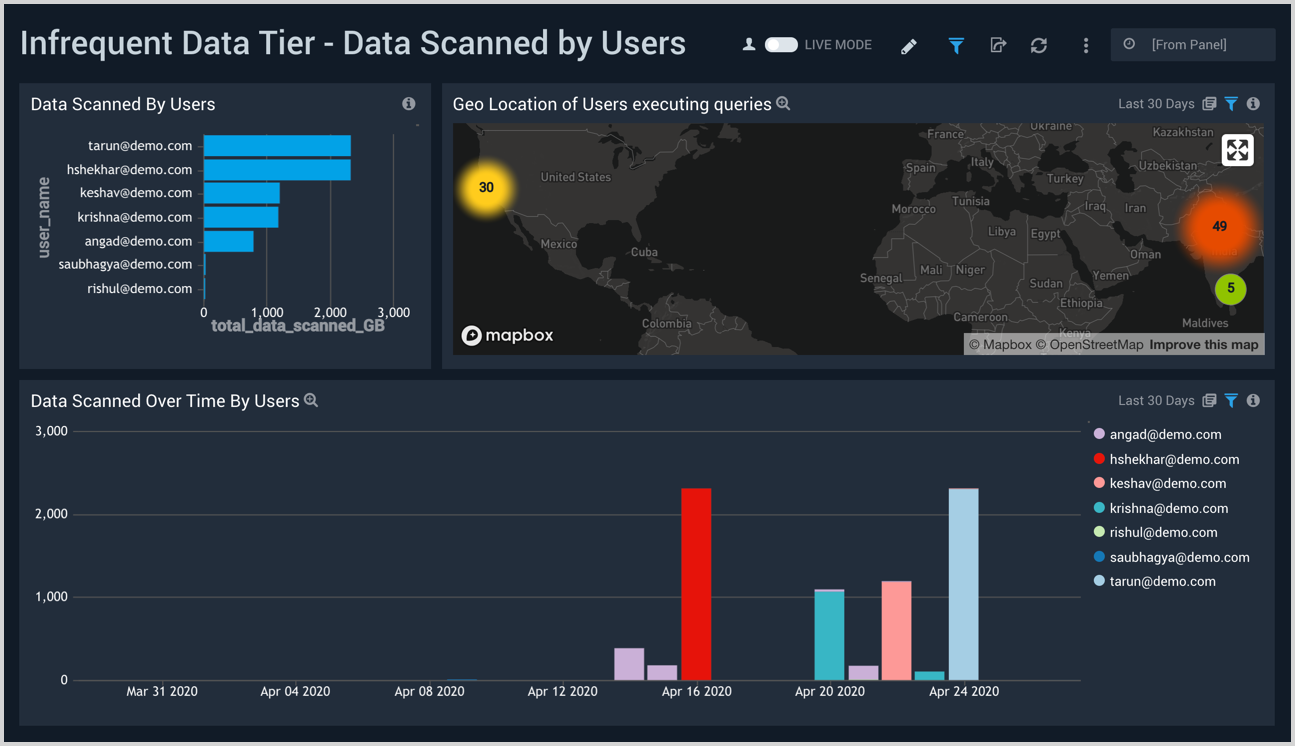
Data Scanned by Users
The Infrequent Data Tier - Data Scanned by Users dashboard provides insights into the amount of infrequent data scanned by specific users, user trends, and the geographic locations of users.
Use this dashboard to:
- Monitor data scan information by user.
- To analyze trends in data scanned by users over a 30 day period.
- Monitor the geographical locations for data scan information.
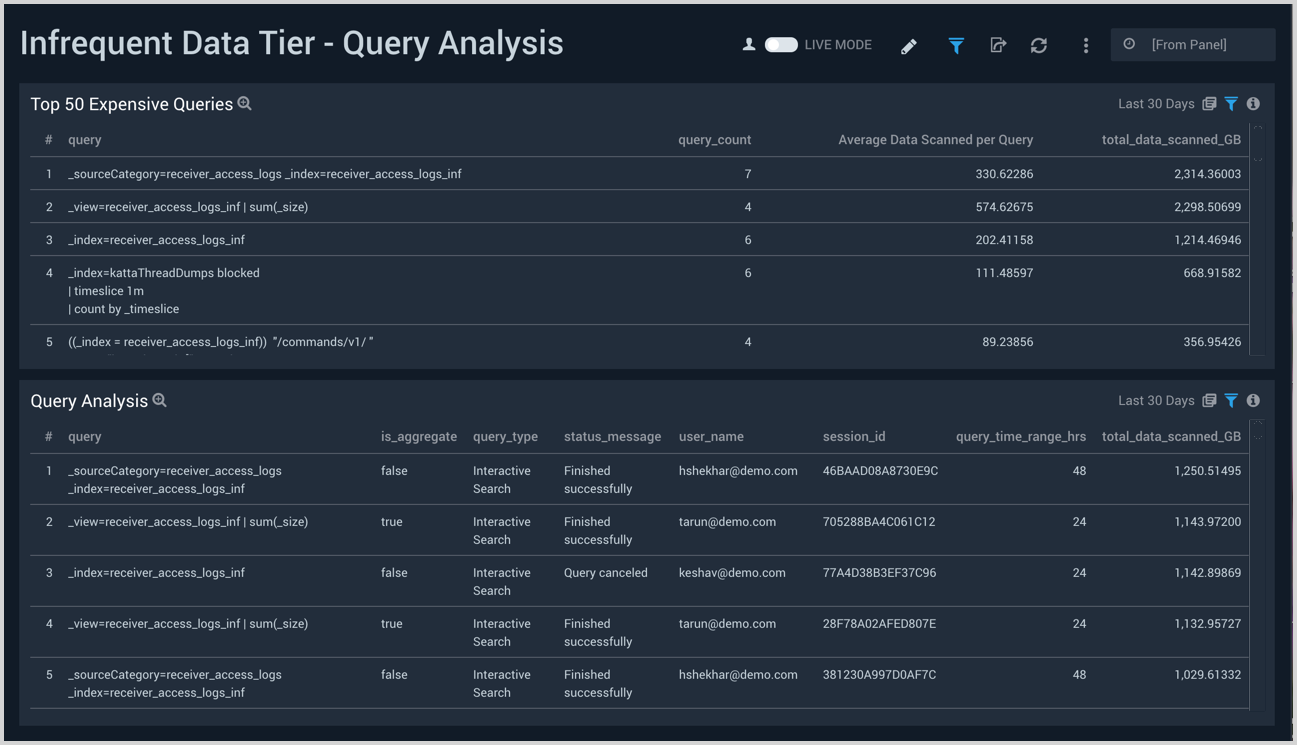
Query Analysis
The Infrequent Data Tier - Query Analysis dashboard provides visibility into the Infrequent Data Tier queries that are most expensive, as well as detailed information on the queries.
Use this dashboard to:
- Identify the most expensive queries on the Infrequent Tier.
- Analyze queries executed against Infrequent Tier.
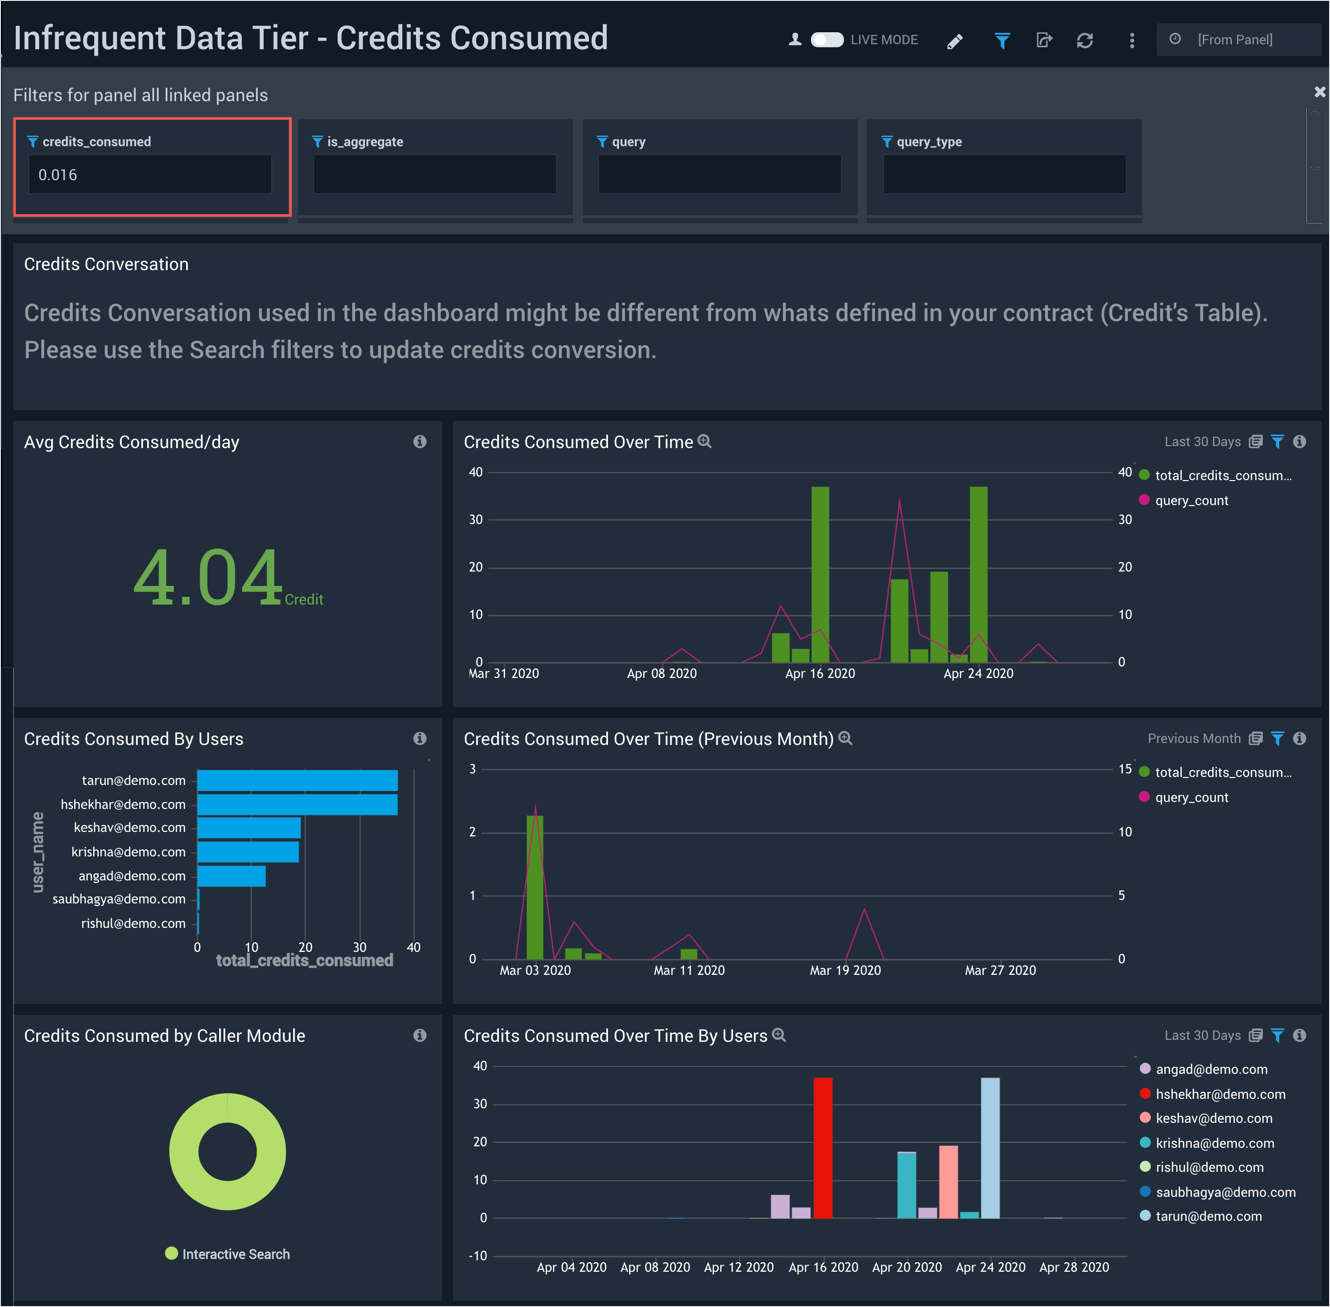
Credits Consumed
The Infrequent Data Tier - Credits Consumed dashboard provides visibility into the total amount of Cloud Flex Credits your organization has consumed with infrequent queries. This allows you to monitor and control on-demand search costs for the Infrequent Tier.
Use this dashboard to:
- Monitor credits consumed per day.
- Monitor credits consumed per user.
- Monitor the geographical locations of credit consumption.
- Identify the most expensive queries on the Infrequent Tier.
Upgrade/Downgrade the Infrequent Data Tier app (Optional)
To update the app, do the following:
Next-Gen App: To install or update the app, you must be an account administrator or a user with Manage Apps, Manage Monitors, Manage Fields, Manage Metric Rules, and Manage Collectors capabilities depending upon the different content types part of the app.
- Select App Catalog.
- In the Search Apps field, search for and then select your app.
Optionally, you can identify apps that can be upgraded in the Upgrade available section. - To upgrade the app, select Upgrade from the Manage dropdown.
- If the upgrade does not have any configuration or property changes, you will be redirected to the Preview & Done section.
- If the upgrade has any configuration or property changes, you will be redirected to the Setup Data page.
- In the Configure section of your respective app, complete the following fields.
- Field Name. If you already have collectors and sources set up, select the configured metadata field name (eg _sourcecategory) or specify other custom metadata (eg: _collector) along with its metadata Field Value.
- Click Next. You will be redirected to the Preview & Done section.
Post-update
Your upgraded app will be installed in the Installed Apps folder and dashboard panels will start to fill automatically.
See our Release Notes changelog for new updates in the app.
To revert the app to a previous version, do the following:
- Select App Catalog.
- In the Search Apps field, search for and then select your app.
- To version down the app, select Revert to < previous version of your app > from the Manage dropdown.
Uninstalling the Infrequent Data Tier app (Optional)
To uninstall the app, do the following:
- Select App Catalog.
- In the 🔎 Search Apps field, run a search for your desired app, then select it.
- Click Uninstall.