Squid Proxy - Classic Collector

The Squid Proxy app is a unified logs and metrics app that helps you monitor activity in Squid Proxy. The preconfigured dashboards provide insight into served and denied requests, performance metrics, IP domain DNS statistics, traffic details, HTTP response codes, URLs experiencing redirects, client errors, server errors, and quality of service data that helps you understand your users’ experience.
This app is tested with the following Squid Proxy versions:
- For Kubernetes environments: Squid Proxy version: 6.0.0
- Non-Kubernetes environments: Squid Proxy version: 6.0.0
Collecting logs and metrics for the Squid Proxy app
This section provides instructions for configuring log and metric collection for the Sumo Logic app for Squid Proxy.
Configure logs and metrics collection for Squid Proxy
Sumo Logic supports the collection of logs and metrics data from Squid Proxy in both Kubernetes and non-Kubernetes environments.
Click on the appropriate tabs below based on the environment where your Squid Proxy clusters are hosted.
- Kubernetes environments
- Non-Kubernetes environments
In Kubernetes environments, we use the Telegraf Operator, which is packaged with our Kubernetes collection. You can learn more about it here. The diagram below illustrates how data is collected from Squid Proxy in Kubernetes environments. In the architecture shown below, there are four services that make up the metric collection pipeline: Telegraf, Telegraf Operator, Prometheus, and Sumo Logic Distribution for OpenTelemetry Collector.
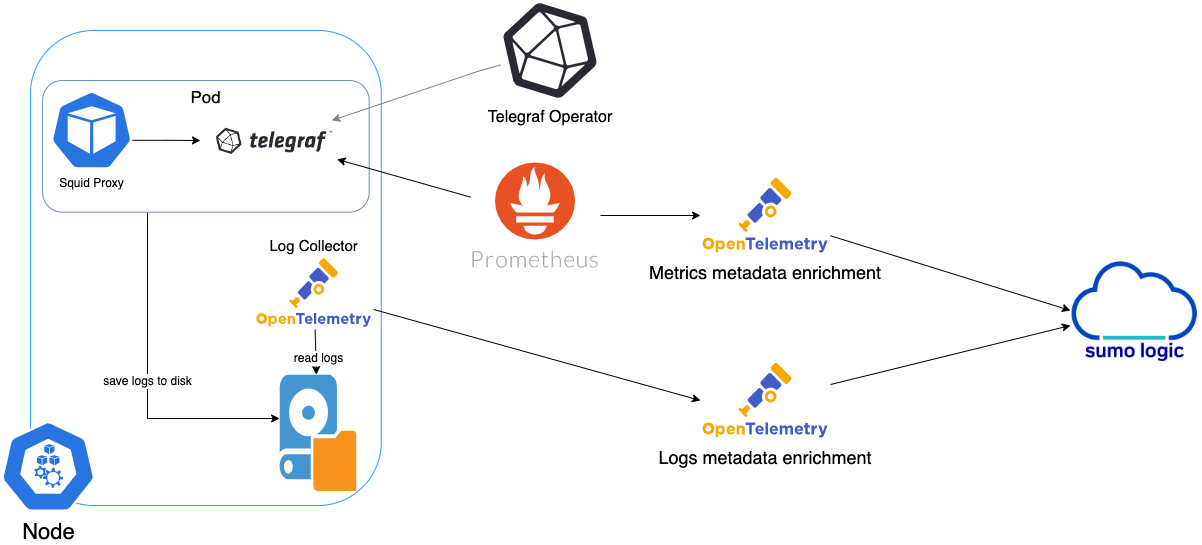
The first service in the pipeline is Telegraf. Telegraf collects metrics from Squid Proxy. Note that we’re running Telegraf in each pod we want to collect metrics from as a sidecar deployment: i.e., Telegraf runs in the same pod as the containers it monitors. Telegraf uses the SNMP input plugin to obtain metrics. For simplicity, the diagram doesn’t show the input plugins. The injection of the Telegraf sidecar container is done by the Telegraf Operator. Prometheus pulls metrics from Telegraf and sends them to Sumo Logic Distribution for OpenTelemetry Collector, which enriches metadata and sends metrics to Sumo Logic.
In the logs pipeline, Sumo Logic Distribution for OpenTelemetry Collector collects logs written to standard out and forwards them to another instance of Sumo Logic Distribution for OpenTelemetry Collector, which enriches metadata and sends logs to Sumo Logic.
It’s assumed that you are using the latest Helm chart version. If not, upgrade using the instructions here.
Configure metrics collection
This section explains the steps to collect Squid Proxy metrics from a Kubernetes environment.
In Kubernetes environments, we use the Telegraf Operator, which is packaged with our Kubernetes collection. You can learn more on this here. Follow the steps listed below to collect metrics from a Kubernetes environment:
- Set up Kubernetes Collection with the Telegraf Operator
- Enable the SNMP agent on Squid Proxy. By default, the SNMP agent will be disabled on the Squid Proxy. To enable the SNMP agent on Squid, edit the configuration file of the Squid Proxy (squid.conf) and add the following section in the ConfigMap that is mounted to Squid Proxy pods:
acl snmppublic snmp_community public
snmp_port 3401
snmp_access allow snmppublic localhost
- Add annotations on your Squid Proxy pods.
Click to expand. On your Squid Proxy Pods, add the following annotations:
annotations:
    telegraf.influxdata.com/class: sumologic-prometheus
    prometheus.io/scrape: "true"
    prometheus.io/port: "9273"
    telegraf.influxdata.com/inputs: |+

[[inputs.snmp]]]
  agents = ["udp://127.0.0.1:3401"]
  name = "squid"
  community = "public"
  [inputs.snmp.tags]
    proxy_cluster="<Squid Proxy_TO_BE_CHANGED>"
    component="proxy"
    environment="env_TO_BE_CHANGED"
    proxy_system="squidproxy"
  [[inputs.snmp.field]]
    name = "uptime"
    oid = "1.3.6.1.4.1.3495.1.1.3.0"
  [[inputs.snmp.field]]
    name = "cacheMemUsage"
    oid = "1.3.6.1.4.1.3495.1.3.1.3.0"
  [[inputs.snmp.field]]
    name = "cacheCpuUsage"
    oid = "1.3.6.1.4.1.3495.1.3.1.5.0"
  [[inputs.snmp.field]]
    name = "cacheClients"
    oid = "1.3.6.1.4.1.3495.1.3.2.1.15.0"
  [[inputs.snmp.field]]
    name = "cacheProtoClientHttpRequests"
    oid = "1.3.6.1.4.1.3495.1.3.2.1.1.0"
  [[inputs.snmp.field]]
    name = "cacheHttpHits"
    oid = "1.3.6.1.4.1.3495.1.3.2.1.2.0"
  [[inputs.snmp.field]]
    name = "cacheHttpErrors"
    oid = "1.3.6.1.4.1.3495.1.3.2.1.3.0"
  [[inputs.snmp.field]]
    name = "uidcacheHttpInKb"
    oid = "1.3.6.1.4.1.3495.1.3.2.1.4.0"
  [[inputs.snmp.field]]
    name = "cacheHttpOutKb"
    oid = "1.3.6.1.4.1.3495.1.3.2.1.5.0"
  [[inputs.snmp.field]]
    name = "cacheServerInKb"
    oid = "1.3.6.1.4.1.3495.1.3.2.1.12.0"
  [[inputs.snmp.field]]
    name = "cacheServerOutKb"
    oid = "1.3.6.1.4.1.3495.1.3.2.1.13.0"
  [[inputs.snmp.field]]
    name = "cacheClients"
    oid = "1.3.6.1.4.1.3495.1.3.2.1.15.0"
  [[inputs.snmp.field]]
    name = "cacheCpuTime"
    oid = "1.3.6.1.4.1.3495.1.3.1.4.0"
  [[inputs.snmp.field]]
    name = "cacheMemMaxSize"
    oid = "1.3.6.1.4.1.3495.1.2.5.1.0"
  [[inputs.snmp.field]]
    name = "cacheServerRequests"
    oid = "1.3.6.1.4.1.3495.1.3.2.1.10.0"
  [[inputs.snmp.field]]
    name = "cacheHttpInKb"
    oid = "1.3.6.1.4.1.3495.1.3.2.1.4.0"
  [[inputs.snmp.field]]
    name = "cacheHttpOutKb"
    oid = "1.3.6.1.4.1.3495.1.3.2.1.5.0"
  [[inputs.snmp.field]]
    name = "cacheNumObjCount"
    oid = "1.3.6.1.4.1.3495.1.3.1.7.0"
  [[inputs.snmp.field]]
    name = "cacheHttpAllSvcTime1"
    oid = "1.3.6.1.4.1.3495.1.3.2.2.1.2.1"
  [[inputs.snmp.field]]
    name = "cacheDnsSvcTime1"
    oid = "1.3.6.1.4.1.3495.1.3.2.2.1.8.1"
  [[inputs.snmp.field]]
    name = "cacheHttpMissSvcTime60"
    oid = "1.3.6.1.4.1.3495.1.3.2.2.1.3.60"
  [[inputs.snmp.field]]
    name = " cacheHttpHitSvcTime60"
    oid = "1.3.6.1.4.1.3495.1.3.2.2.1.5.60"
  [[inputs.snmp.field]]
    name = "cacheIpEntries"
    oid = "1.3.6.1.4.1.3495.1.4.1.1.0"
  [[inputs.snmp.field]]
    name = "cacheIpMisses"
    oid = "1.3.6.1.4.1.3495.1.4.1.6.0"
  [[inputs.snmp.field]]
    name = "cacheVersionId"
    oid = "1.3.6.1.4.1.3495.1.2.3.0"
  [[inputs.snmp.field]]
    name = "cacheSysPageFaults"
    oid = "1.3.6.1.4.1.3495.1.3.1.1.0"
  [[inputs.snmp.field]]
    name = "cacheHttpErrors"
    oid = "1.3.6.1.4.1.3495.1.3.2.1.3.0"
  [[inputs.snmp.field]]
    name = "cacheServerErrors"
    oid = "1.3.6.1.4.1.3495.1.3.2.1.11.0"
  [[inputs.snmp.field]]
    name = "cacheCpuUsage"
    oid = "1.3.6.1.4.1.3495.1.3.1.5.0"
  [[inputs.snmp.field]]
    name = "cacheCpuTime"
    oid = "1.3.6.1.4.1.3495.1.3.1.4.0"
  [[inputs.snmp.field]]
    name = "cacheSysVMsize"
    oid = "1.3.6.1.4.1.3495.1.1.1.0"
  [[inputs.snmp.field]]
    name = "cacheSysNumReads"
    oid = "1.3.6.1.4.1.3495.1.3.1.2.0"
  [[inputs.snmp.field]]
    name = "cacheCurrentUnusedFDescrCnt"
    oid = "1.3.6.1.4.1.3495.1.3.1.10.0"
  [[inputs.snmp.field]]
    name = "cacheCurrentFileDescrCnt"
    oid = "1.3.6.1.4.1.3495.1.3.1.12.0"
  [[inputs.snmp.field]]
    name = "cacheMaxResSize"
    oid = "1.3.6.1.4.1.3495.1.3.1.6.0"
  [[inputs.snmp.field]]
    name = "cacheCurrentResFileDescrCnt"
    oid = "1.3.6.1.4.1.3495.1.3.1.11.0"
  [[inputs.snmp.field]]
    name = "cacheIpRequests"
    oid = "1.3.6.1.4.1.3495.1.4.1.2.0"
  [[inputs.snmp.field]]
    name = "cacheIpHits"
    oid = "1.3.6.1.4.1.3495.1.4.1.3.0"
  [[inputs.snmp.field]]
    name = "cacheFqdnEntries"
    oid = "1.3.6.1.4.1.3495.1.4.2.1.0"
  [[inputs.snmp.field]]
    name = "cacheFqdnRequests"
    oid = "1.3.6.1.4.1.3495.1.4.2.2.0"
  [[inputs.snmp.field]]
    name = "cacheFqdnHits"
    oid = "1.3.6.1.4.1.3495.1.4.2.3.0"
  [[inputs.snmp.field]]
    name = "cacheFqdnMisses"
    oid = "1.3.6.1.4.1.3495.1.4.2.6.0"
  [[inputs.snmp.field]]
    name = "cacheDnsRequests"
    oid = "1.3.6.1.4.1.3495.1.4.3.1.0"
  [[inputs.snmp.field]]
    name = "cacheDnsReplies"
    oid = "1.3.6.1.4.1.3495.1.4.3.2.0"
  [[inputs.snmp.field]]
    name = "cacheDnsNumberServers"
    oid = "1.3.6.1.4.1.3495.1.4.3.3.0"
  [[inputs.snmp.field]]
    name = "version"
    oid = "1.3.6.1.4.1.3495.1.2.3.0"
   is_tag = true
  [[inputs.snmp.field]]
    name = "cacheHttpAllSvcTime5"
    oid = "1.3.6.1.4.1.3495.1.3.2.2.1.2.5"
  [[inputs.snmp.field]]
    name = "cacheHttpMissSvcTime5"
    oid = "1.3.6.1.4.1.3495.1.3.2.2.1.3.5"
  [[inputs.snmp.field]]
   name = "cacheHttpHitSvcTime5"
    oid = "1.3.6.1.4.1.3495.1.3.2.2.1.5.5"
  [[inputs.snmp.field]]
    name = "cacheDnsSvcTime5"
   oid = "1.3.6.1.4.1.3495.1.3.2.2.1.8.5"
If you haven’t defined a farm in Squid Proxy, then enter ‘default’ for proxy_cluster.
Enter in values for the following parameters (marked CHANGEME in the snippet above):
telegraf.influxdata.com/inputs. This contains the required configuration for the Telegraf SNMP Input plugin. Please refer to this doc for more information on configuring the SNMP input plugin for Telegraf. Note: As Telegraf will be run as a sidecar, the host should always be localhost.- In the tags section, which is
[inputs.snmp.tags]environment. This is the deployment environment where the Squid Proxy cluster identified by the value of servers resides. For example: dev, prod, or qa. While this value is optional, we highly recommend setting it.proxy_cluster. Enter a name to identify this Squid Proxy cluster. This farm name will be shown in the Sumo Logic dashboards.
- In the tags section, which is
Do not modify the following values set by this configuration, as it will cause the Sumo Logic app to not function correctly.
-
telegraf.influxdata.com/class: sumologic-prometheus. This instructs the Telegraf operator what output to use. This should not be changed. -
prometheus.io/scrape: "true". This ensures our Prometheus will scrape the metrics. -
prometheus.io/port: "9273". This tells Prometheus what ports to scrape on. This should not be changed. -
telegraf.influxdata.com/inputs- In the tags section, which is
[inputs.snmp.tags]component: “proxy”. This value is used by Sumo Logic apps to identify application components.proxy_system: “squidproxy”- This value identifies the proxy system.
For all other parameters, see this doc for more parameters that can be configured in the Telegraf agent globally.
- In the tags section, which is
- Sumo Logic Kubernetes collection will automatically start collecting metrics from the pods having the labels and annotations defined in the previous step.
- Verify metrics in Sumo Logic.
Configure logs collection
This section explains the steps to collect Squid Proxy logs from a Kubernetes environment.
-
(Recommended Method) Add labels on your Squid Proxy pods to capture logs from standard output. Make sure that the logs from Squid Proxy are sent to stdout. Follow the instructions below to capture Squid Proxy logs from stdout on Kubernetes.
- Apply the following labels to the Squid Proxy pod:
environment="prod_CHANGEME"
component="proxy"
proxy_system="squidproxy"
proxy_cluster="<cluster_CHANGEME>"
Enter in values for the following parameters (marked CHANGE_ME above):
environment. This is the deployment environment where the Squid Proxy cluster identified by the value ofserversresides. For example:- dev, prod, or QA. While this value is optional, we highly recommend setting it.proxy_cluster. Enter a name to identify this Squid Proxy cluster. This farm name will be shown in the Sumo Logic dashboards. If you haven’t defined a cluster in Squid Proxy, then enterdefaultforproxy_cluster.
Do not modify the following values set by this configuration, as it will cause the Sumo Logic app to not function correctly.
component: “proxy”. This value is used by Sumo Logic apps to identify application components.proxy_system: “squidproxy”- This value identifies the proxy system.
For all other parameters, see this doc for more parameters that can be configured in the Telegraf agent globally.
-
The Sumologic-Kubernetes-Collection will automatically capture the logs from stdout and will send the logs to Sumologic. For more information on deploying Sumologic-Kubernetes-Collection, visit here.
-
Verify logs in Sumo Logic.
-
(Optional) Collecting Squid Proxy Logs from a Log File Follow the steps below to capture Squid Proxy logs from a log file on Kubernetes.
- Determine the location of the Squid Proxy log file on Kubernetes. This can be determined from the squid.conf for your Squid Proxy cluster, along with the mounts on the Squid Proxy pods.
- Install the Sumo Logic tailing sidecar operator.
- Add the following annotation in addition to the existing annotations.
annotations:
  tailing-sidecar: sidecarconfig;<mount>:<path_of_Squid Proxy_log_file>/<Squid Proxy_log_file_name>
Example:
annotations:
tailing-sidecar: sidecarconfig;data:/var/log/squid/access.log- Make sure that the Squid Proxy pods are running and annotations are applied by using the command:
kubectl describe pod <Squid_Proxy_pod_name>- Sumo Logic Kubernetes collection will automatically start collecting logs from the pods having the annotations defined above.
- Verify logs in Sumo Logic.
FER to normalize the fields in Kubernetes environments. Labels created in Kubernetes environments are automatically prefixed with pod_labels. To normalize these for our app to work, a Field Extraction Rule named AppObservabilitySquidProxyFER is automatically created for Squid Proxy Application Components.
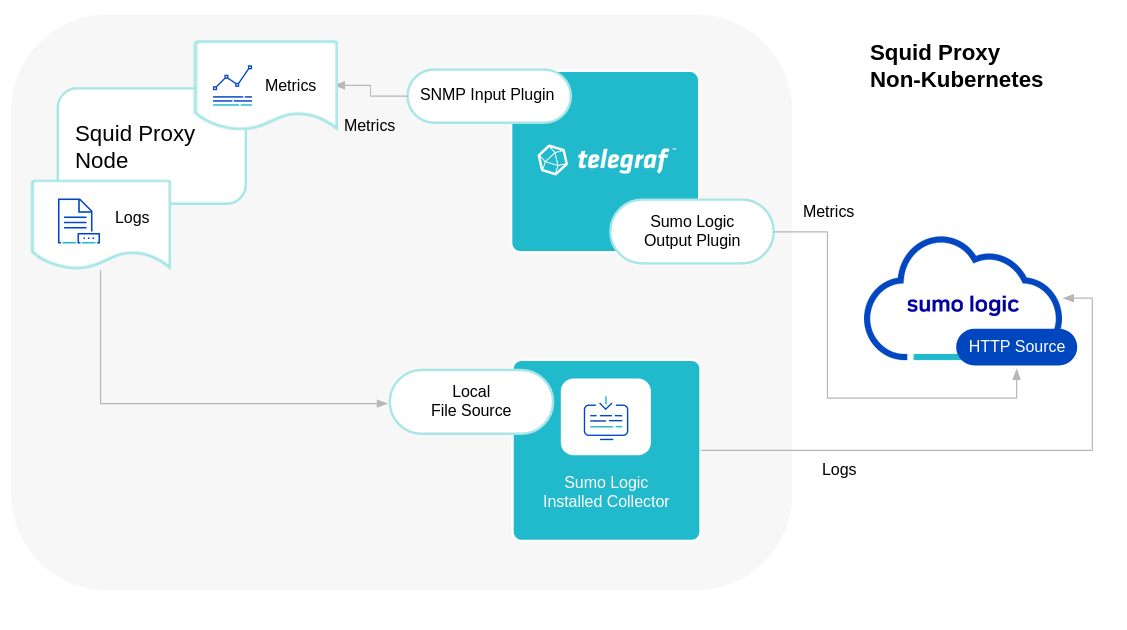
Sumo Logic uses the Telegraf operator for Squid Proxy metric collection and the Installed Collector for collecting Squid Proxy logs. The diagram below illustrates the components of the Squid Proxy collection in a non-Kubernetes environment. Telegraf uses the SNMP input plugin to obtain Squid Proxy metrics and the Sumo Logic output plugin to send the metrics to Sumo Logic. Logs from Squid Proxy are collected by a Local File Source.
The process to set up collection for Squid Proxy data is done through the following steps.
Configure logs collection
Squid Proxy app supports the default access logs and cache logs format.
- Configure logging in Squid Proxy. By default, the squid proxy will write the access log to the log directory that was configured during installation. For example, on Linux, the log directory would be
/var/log/squid/access.log. If the access log is disabled, then you must enable the access log following these instructions. - Configure an Installed Collector. If you have not already done so, install and configure an installed collector for Windows by referring to this documentation.
- Configure a Collector. Use one of the following Sumo Logic Collector options:
- To collect logs directly from the Squid Proxy machine, configure an Installed Collector.
- If you're using a service like Fluentd, or you would like to upload your logs manually, Create a Hosted Collector.
- Configure a local file source. Choose a method:
For an Installed Collector
To collect logs directly from your Squid Proxy machine, use an Installed Collector and a Local File Source.
- Add a Local File Source.
- Configure the Local File Source fields as follows:
- Name. (Required)
- Description. (Optional)
- File Path (Required). Enter the path to your access.log. The files are typically located in /var/log/squid/access.log. If you're using a customized path, check the squid.conf file for this information.
- Source Host. Sumo Logic uses the hostname assigned by the OS unless you enter a different hostname.
- Source Category. Enter any string to tag the output collected from this Source, such as SquidProxy/AccessLog. (The Source Category metadata field is a fundamental building block to organize and label Sources. For details, see Best Practices.)
- Fields. Set the following fields
component = proxy
proxy_system = squidproxy
proxy_cluster = <Your_Squid_Proxy_Cluster_Name> #Enter Default if you do not have one.
environment = <Your_Environment_Name> #For example, Dev, QA, or Prod
- Configure the Advanced section:
- Enable Timestamp Parsing. Select Extract timestamp information from log file entries.
- Time Zone. Automatically detect.
- Timestamp Format. The timestamp format is automatically detected.
- Encoding. Select UTF-8 (Default).
- Enable Multiline Processing.
- Error logs. Select Detect messages spanning multiple lines and Infer Boundaries - Detect message boundaries automatically.
- Access logs. These are single-line logs; uncheck Detect messages spanning multiple lines.
- Click Save.
For a Hosted Collector
If you're using a service like Fluentd, or you would like to upload your logs manually, use a Hosted Collector and an HTTP Source.
- Add an HTTP Source.
- Configure the HTTP Source fields as follows:
- Name. (Required)
- Description. (Optional)
- Source Host. Sumo Logic uses the hostname assigned by the OS unless you enter a different hostname.
- Source Category. Enter any string to tag the output collected from this Source, such as SquidProxy/AccessLog. (The Source Category metadata field is a fundamental building block to organize and label Sources. For details, see Best Practices.)
- Configure the **Advanced **section:
- Enable Timestamp Parsing. Select Extract timestamp information from log file entries.
- Time Zone. For Access logs, use the time zone from the log file. For Error logs, make sure to select the correct time zone.
- Timestamp Format. The timestamp format is automatically detected.
- Enable Multiline Processing.
- Error logs: Select Detect messages spanning multiple lines and Infer Boundaries - Detect message boundaries automatically.
- Access logs: These are single-line logs, uncheck Detect messages spanning multiple lines.
- Click Save.
- When the URL associated with the HTTP Source is displayed, copy the URL so you can add it to the service you are using, such as Fluentd.
Configure metrics collection
- Set up a Sumo Logic HTTP Source.
- Configure a Hosted Collector for Metrics. To create a new Sumo Logic hosted collector, perform the steps in the Create a Hosted Collector documentation.
- Configure an HTTP Logs and Metrics source:
- On the created Hosted Collector on the Collection Management screen, select Add Source.
- Select HTTP Logs & Metrics.
- Name. (Required). Enter a name for the source.
- Description. (Optional).
- Source Category (Recommended). Be sure to follow the Best Practices for Source Categories. A recommended Source Category may be Prod/ProxyServer/SquidProxy/Metrics.
- Select Save.
- Take note of the URL provided once you click Save. You can retrieve it again by selecting the Show URL next to the source on the Collection Management screen.
- Enable SNMP agent on Squid Proxy. By default, the SNMP agent will be disabled on the Squid Proxy. You have to enable it. To enable the SNMP agent on squid, edit the configuration file of the squid proxy (squid.conf) and add the following section:
acl snmppublic snmp_community public
snmp_port 3401
snmp_access allow snmppublic localhost - Set up Telegraf.
- Install Telegraf if you haven’t already, using the steps given in this documentation.
- Configure and start Telegraf. As part of collecting metrics data from Telegraf, we'll use the SNMP input plugin to get data from Telegraf and the Sumo Logic output plugin to send data to Sumo Logic.
Click to expand. Create or modify telegraf.conf and copy and paste the text below:
[[inputs.snmp]]]
  agents = ["udp://127.0.0.1:3401"]
  name = "squid"
  community = "public"
  [inputs.snmp.tags]
   proxy_cluster="<Squid Proxy_TO_BE_CHANGED>"
   component="proxy"
   environment="env_TO_BE_CHANGED"
   proxy_system="squidproxy"

  [[inputs.snmp.field]]
    name = "uptime"
    oid = "1.3.6.1.4.1.3495.1.1.3.0"
  [[inputs.snmp.field]]
    name = "cacheMemUsage"
    oid = "1.3.6.1.4.1.3495.1.3.1.3.0"
  [[inputs.snmp.field]]
    name = "cacheCpuUsage"
    oid = "1.3.6.1.4.1.3495.1.3.1.5.0"
  [[inputs.snmp.field]]
    name = "cacheClients"
    oid = "1.3.6.1.4.1.3495.1.3.2.1.15.0"
  [[inputs.snmp.field]]
    name = "cacheProtoClientHttpRequests"
    oid = "1.3.6.1.4.1.3495.1.3.2.1.1.0"
  [[inputs.snmp.field]]
    name = "cacheHttpHits"
    oid = "1.3.6.1.4.1.3495.1.3.2.1.2.0"
  [[inputs.snmp.field]]
    name = "cacheHttpErrors"
    oid = "1.3.6.1.4.1.3495.1.3.2.1.3.0"
  [[inputs.snmp.field]]
    name = "uidcacheHttpInKb"
    oid = "1.3.6.1.4.1.3495.1.3.2.1.4.0"
  [[inputs.snmp.field]]
    name = "cacheHttpOutKb"
    oid = "1.3.6.1.4.1.3495.1.3.2.1.5.0"
  [[inputs.snmp.field]]
    name = "cacheServerInKb"
    oid = "1.3.6.1.4.1.3495.1.3.2.1.12.0"
  [[inputs.snmp.field]]
    name = "cacheServerOutKb"
    oid = "1.3.6.1.4.1.3495.1.3.2.1.13.0"
  [[inputs.snmp.field]]
    name = "cacheClients"
    oid = "1.3.6.1.4.1.3495.1.3.2.1.15.0"
  [[inputs.snmp.field]]
    name = "cacheCpuTime"
    oid = "1.3.6.1.4.1.3495.1.3.1.4.0"
  [[inputs.snmp.field]]
    name = "cacheMemMaxSize"
    oid = "1.3.6.1.4.1.3495.1.2.5.1.0"
  [[inputs.snmp.field]]
    name = "cacheServerRequests"
    oid = "1.3.6.1.4.1.3495.1.3.2.1.10.0"
  [[inputs.snmp.field]]
    name = "cacheHttpInKb"
    oid = "1.3.6.1.4.1.3495.1.3.2.1.4.0"
  [[inputs.snmp.field]]
    name = "cacheHttpOutKb"
    oid = "1.3.6.1.4.1.3495.1.3.2.1.5.0"
  [[inputs.snmp.field]]
    name = "cacheNumObjCount"
    oid = "1.3.6.1.4.1.3495.1.3.1.7.0"
  [[inputs.snmp.field]]
    name = "cacheHttpAllSvcTime1"
    oid = "1.3.6.1.4.1.3495.1.3.2.2.1.2.1"
  [[inputs.snmp.field]]
    name = "cacheDnsSvcTime1"
    oid = "1.3.6.1.4.1.3495.1.3.2.2.1.8.1"
  [[inputs.snmp.field]]
    name = "cacheHttpMissSvcTime60"
    oid = "1.3.6.1.4.1.3495.1.3.2.2.1.3.60"
  [[inputs.snmp.field]]
    name = " cacheHttpHitSvcTime60"
    oid = "1.3.6.1.4.1.3495.1.3.2.2.1.5.60"
  [[inputs.snmp.field]]
    name = "cacheIpEntries"
    oid = "1.3.6.1.4.1.3495.1.4.1.1.0"
  [[inputs.snmp.field]]
    name = "cacheIpMisses"
    oid = "1.3.6.1.4.1.3495.1.4.1.6.0"
  [[inputs.snmp.field]]
    name = "cacheVersionId"
    oid = "1.3.6.1.4.1.3495.1.2.3.0"
  [[inputs.snmp.field]]
    name = "cacheSysPageFaults"
    oid = "1.3.6.1.4.1.3495.1.3.1.1.0"
  [[inputs.snmp.field]]
    name = "cacheHttpErrors"
    oid = "1.3.6.1.4.1.3495.1.3.2.1.3.0"
  [[inputs.snmp.field]]
    name = "cacheServerErrors"
    oid = "1.3.6.1.4.1.3495.1.3.2.1.11.0"
  [[inputs.snmp.field]]
    name = "cacheCpuUsage"
    oid = "1.3.6.1.4.1.3495.1.3.1.5.0"
  [[inputs.snmp.field]]
    name = "cacheCpuTime"
    oid = "1.3.6.1.4.1.3495.1.3.1.4.0"
  [[inputs.snmp.field]]
    name = "cacheSysVMsize"
    oid = "1.3.6.1.4.1.3495.1.1.1.0"
  [[inputs.snmp.field]]
    name = "cacheSysNumReads"
    oid = "1.3.6.1.4.1.3495.1.3.1.2.0"
  [[inputs.snmp.field]]
    name = "cacheCurrentUnusedFDescrCnt"
    oid = "1.3.6.1.4.1.3495.1.3.1.10.0"
  [[inputs.snmp.field]]
    name = "cacheCurrentFileDescrCnt"
    oid = "1.3.6.1.4.1.3495.1.3.1.12.0"
  [[inputs.snmp.field]]
    name = "cacheMaxResSize"
    oid = "1.3.6.1.4.1.3495.1.3.1.6.0"
  [[inputs.snmp.field]]
    name = "cacheCurrentResFileDescrCnt"
    oid = "1.3.6.1.4.1.3495.1.3.1.11.0"
  [[inputs.snmp.field]]
    name = "cacheIpRequests"
    oid = "1.3.6.1.4.1.3495.1.4.1.2.0"
  [[inputs.snmp.field]]
    name = "cacheIpHits"
    oid = "1.3.6.1.4.1.3495.1.4.1.3.0"
  [[inputs.snmp.field]]
    name = "cacheFqdnEntries"
    oid = "1.3.6.1.4.1.3495.1.4.2.1.0"
  [[inputs.snmp.field]]
    name = "cacheFqdnRequests"
    oid = "1.3.6.1.4.1.3495.1.4.2.2.0"
  [[inputs.snmp.field]]
    name = "cacheFqdnHits"
    oid = "1.3.6.1.4.1.3495.1.4.2.3.0"
  [[inputs.snmp.field]]
    name = "cacheFqdnMisses"
    oid = "1.3.6.1.4.1.3495.1.4.2.6.0"
  [[inputs.snmp.field]]
    name = "cacheDnsRequests"
    oid = "1.3.6.1.4.1.3495.1.4.3.1.0"
  [[inputs.snmp.field]]
    name = "cacheDnsReplies"
    oid = "1.3.6.1.4.1.3495.1.4.3.2.0"
  [[inputs.snmp.field]]
    name = "cacheDnsNumberServers"
    oid = "1.3.6.1.4.1.3495.1.4.3.3.0"
  [[inputs.snmp.field]]
    name = "version"
    oid = "1.3.6.1.4.1.3495.1.2.3.0"
    is_tag = true
  [[inputs.snmp.field]]
    name = "cacheHttpAllSvcTime5"
    oid = "1.3.6.1.4.1.3495.1.3.2.2.1.2.5"
  [[inputs.snmp.field]]
    name = "cacheHttpMissSvcTime5"
    oid = "1.3.6.1.4.1.3495.1.3.2.2.1.3.5"
  [[inputs.snmp.field]]
    name = "cacheHttpHitSvcTime5"
    oid = "1.3.6.1.4.1.3495.1.3.2.2.1.5.5"
  [[inputs.snmp.field]]
    name = "cacheDnsSvcTime5"
    oid = "1.3.6.1.4.1.3495.1.3.2.2.1.8.5"
[[outputs.sumologic]]
    url = "<URL_from_HTTP_Logs_and_Metrics_Source>"
    data_format = "prometheus"
- Enter values for fields annotated with
<VALUE_TO_BE_CHANGED>to the appropriate values. Do not include the brackets (< >) in your final configuration. - In the tags section, which is
[inputs.snmp.tags]: environment. This is the deployment environment where the Squid Proxy server identified by the value of servers resides. For example, dev, prod, or QA. While this value is optional, we highly recommend setting it.proxy_cluster. Enter a name to identify this Squid Proxy cluster. This cluster name will be shown in our dashboards.- In the output plugins section, which is
[[outputs.sumologic]]: URL- This is the HTTP source URL created previously. See this doc for more information on additional parameters for configuring the Sumo Logic Telegraf output plugin.- Do not modify the following values set by this configuration, as it will cause the Sumo Logic app to not function correctly. If you haven’t defined a cluster in Squid Proxy, then enter
defaultforproxy_cluster.data_format: “prometheus”. In the output[[outputs.sumologic]]plugins section. Metrics are sent in the Prometheus format to Sumo Logic.component - “proxy”. In the input[[inputs.snmp]]plugins section. This value is used by Sumo Logic apps to identify application components.proxy_system - “squidproxy”. In the input plugins sections. This value identifies the proxy system.
See this doc for all other parameters that can be configured in the Telegraf agent globally.
After you have finalized your telegraf.conf file, you can start or reload the telegraf service using instructions from this doc.
At this point, Telegraf should start collecting the Squid Proxy metrics and forward them to the Sumo Logic HTTP Source.
- Enter the following options:
- Rule Name. Enter the name as App Observability - Proxy.
- Applied At. Choose Ingest Time.
- Scope. Select Specific Data.
- Scope: Enter the following keyword search expression.
pod_labels_environment=* pod_labels_component=proxy pod_labels_proxy_cluster=* pod_labels_proxy_system=* - Parse Expression. Enter the following parse expression:
if (!isEmpty(pod_labels_environment), pod_labels_environment, "") as environment
| pod_labels_component as component
| pod_labels_proxy_system as proxy_system
| pod_labels_proxy_cluster as proxy_cluster - Click Save to create the rule.
Installing the Squid Proxy app
To install the app, do the following:
Next-Gen App: To install or update the app, you must be an account administrator or a user with Manage Apps, Manage Monitors, Manage Fields, Manage Metric Rules, and Manage Collectors capabilities depending upon the different content types part of the app.
- Select App Catalog.
- In the 🔎 Search Apps field, run a search for your desired app, then select it.
- Click Install App.
note
Sometimes this button says Add Integration.
- Click Next in the Setup Data section.
- In the Configure section of your respective app, complete the following fields.
- Field Name. If you already have collectors and sources set up, select the configured metadata field name (eg _sourcecategory) or specify other custom metadata (eg: _collector) along with its metadata Field Value.
- Is K8S deployment involved. Specify if resources being monitored are partially or fully deployed on Kubernetes (K8s)
- Click Next. You will be redirected to the Preview & Done section.
Post-installation
Once your app is installed, it will appear in your Installed Apps folder, and dashboard panels will start to fill automatically.
Each panel slowly fills with data matching the time range query received since the panel was created. Results will not immediately be available but will be updated with full graphs and charts over time.
As part of the app installation process, the following fields will be created by default:
componentenvironmentproxy_systemproxy_clusterpod
Additionally, if you're using Squid Proxy in the Kubernetes environment, the following additional fields will be created by default during the app installation process:
pod_labels_componentpod_labels_environmentpod_labels_proxy_systempod_labels_proxy_cluster
Viewing the Squid Proxy dashboards
All dashboards have a set of filters that you can apply to the entire dashboard. Use these filters to drill down and examine the data to a granular level.
- You can change the time range for a dashboard or panel by selecting a predefined interval from a drop-down list, choosing a recently used time range, or specifying custom dates and times. Learn more.
- You can use template variables to drill down and examine the data on a granular level. For more information, see Filtering Dashboards with Template Variables.
- Most Next-Gen apps allow you to provide the scope at the installation time and are comprised of a key (
_sourceCategoryby default) and a default value for this key. Based on your input, the app dashboards will be parameterized with a dashboard variable, allowing you to change the dataset queried by all panels. This eliminates the need to create multiple copies of the same dashboard with different queries.
Overview
The Squid Proxy (Classic) - Overview dashboard provides an at-a-glance view of the activity and health of the Squid Proxy clusters and servers by monitoring uptime, number of current clients, latency, bandwidth, destination locations, error and denied requests, and URLs accessed.
Use this dashboard to:
- Gain insights into information about the destination location your intranet frequently visits by region.
- Gain insights into your Squid Proxy health using Latency, HTTP Errors, and Status codes of Squid Proxy Servers.
- Get insights into information about the Uptime and bandwidth of Squid Proxy servers.
- Get insights into information about the web browsing behavior of users using Top accessed URLs, denied URLs, 4xx errors URLs, 5xx errors URLs, and top remote hosts.

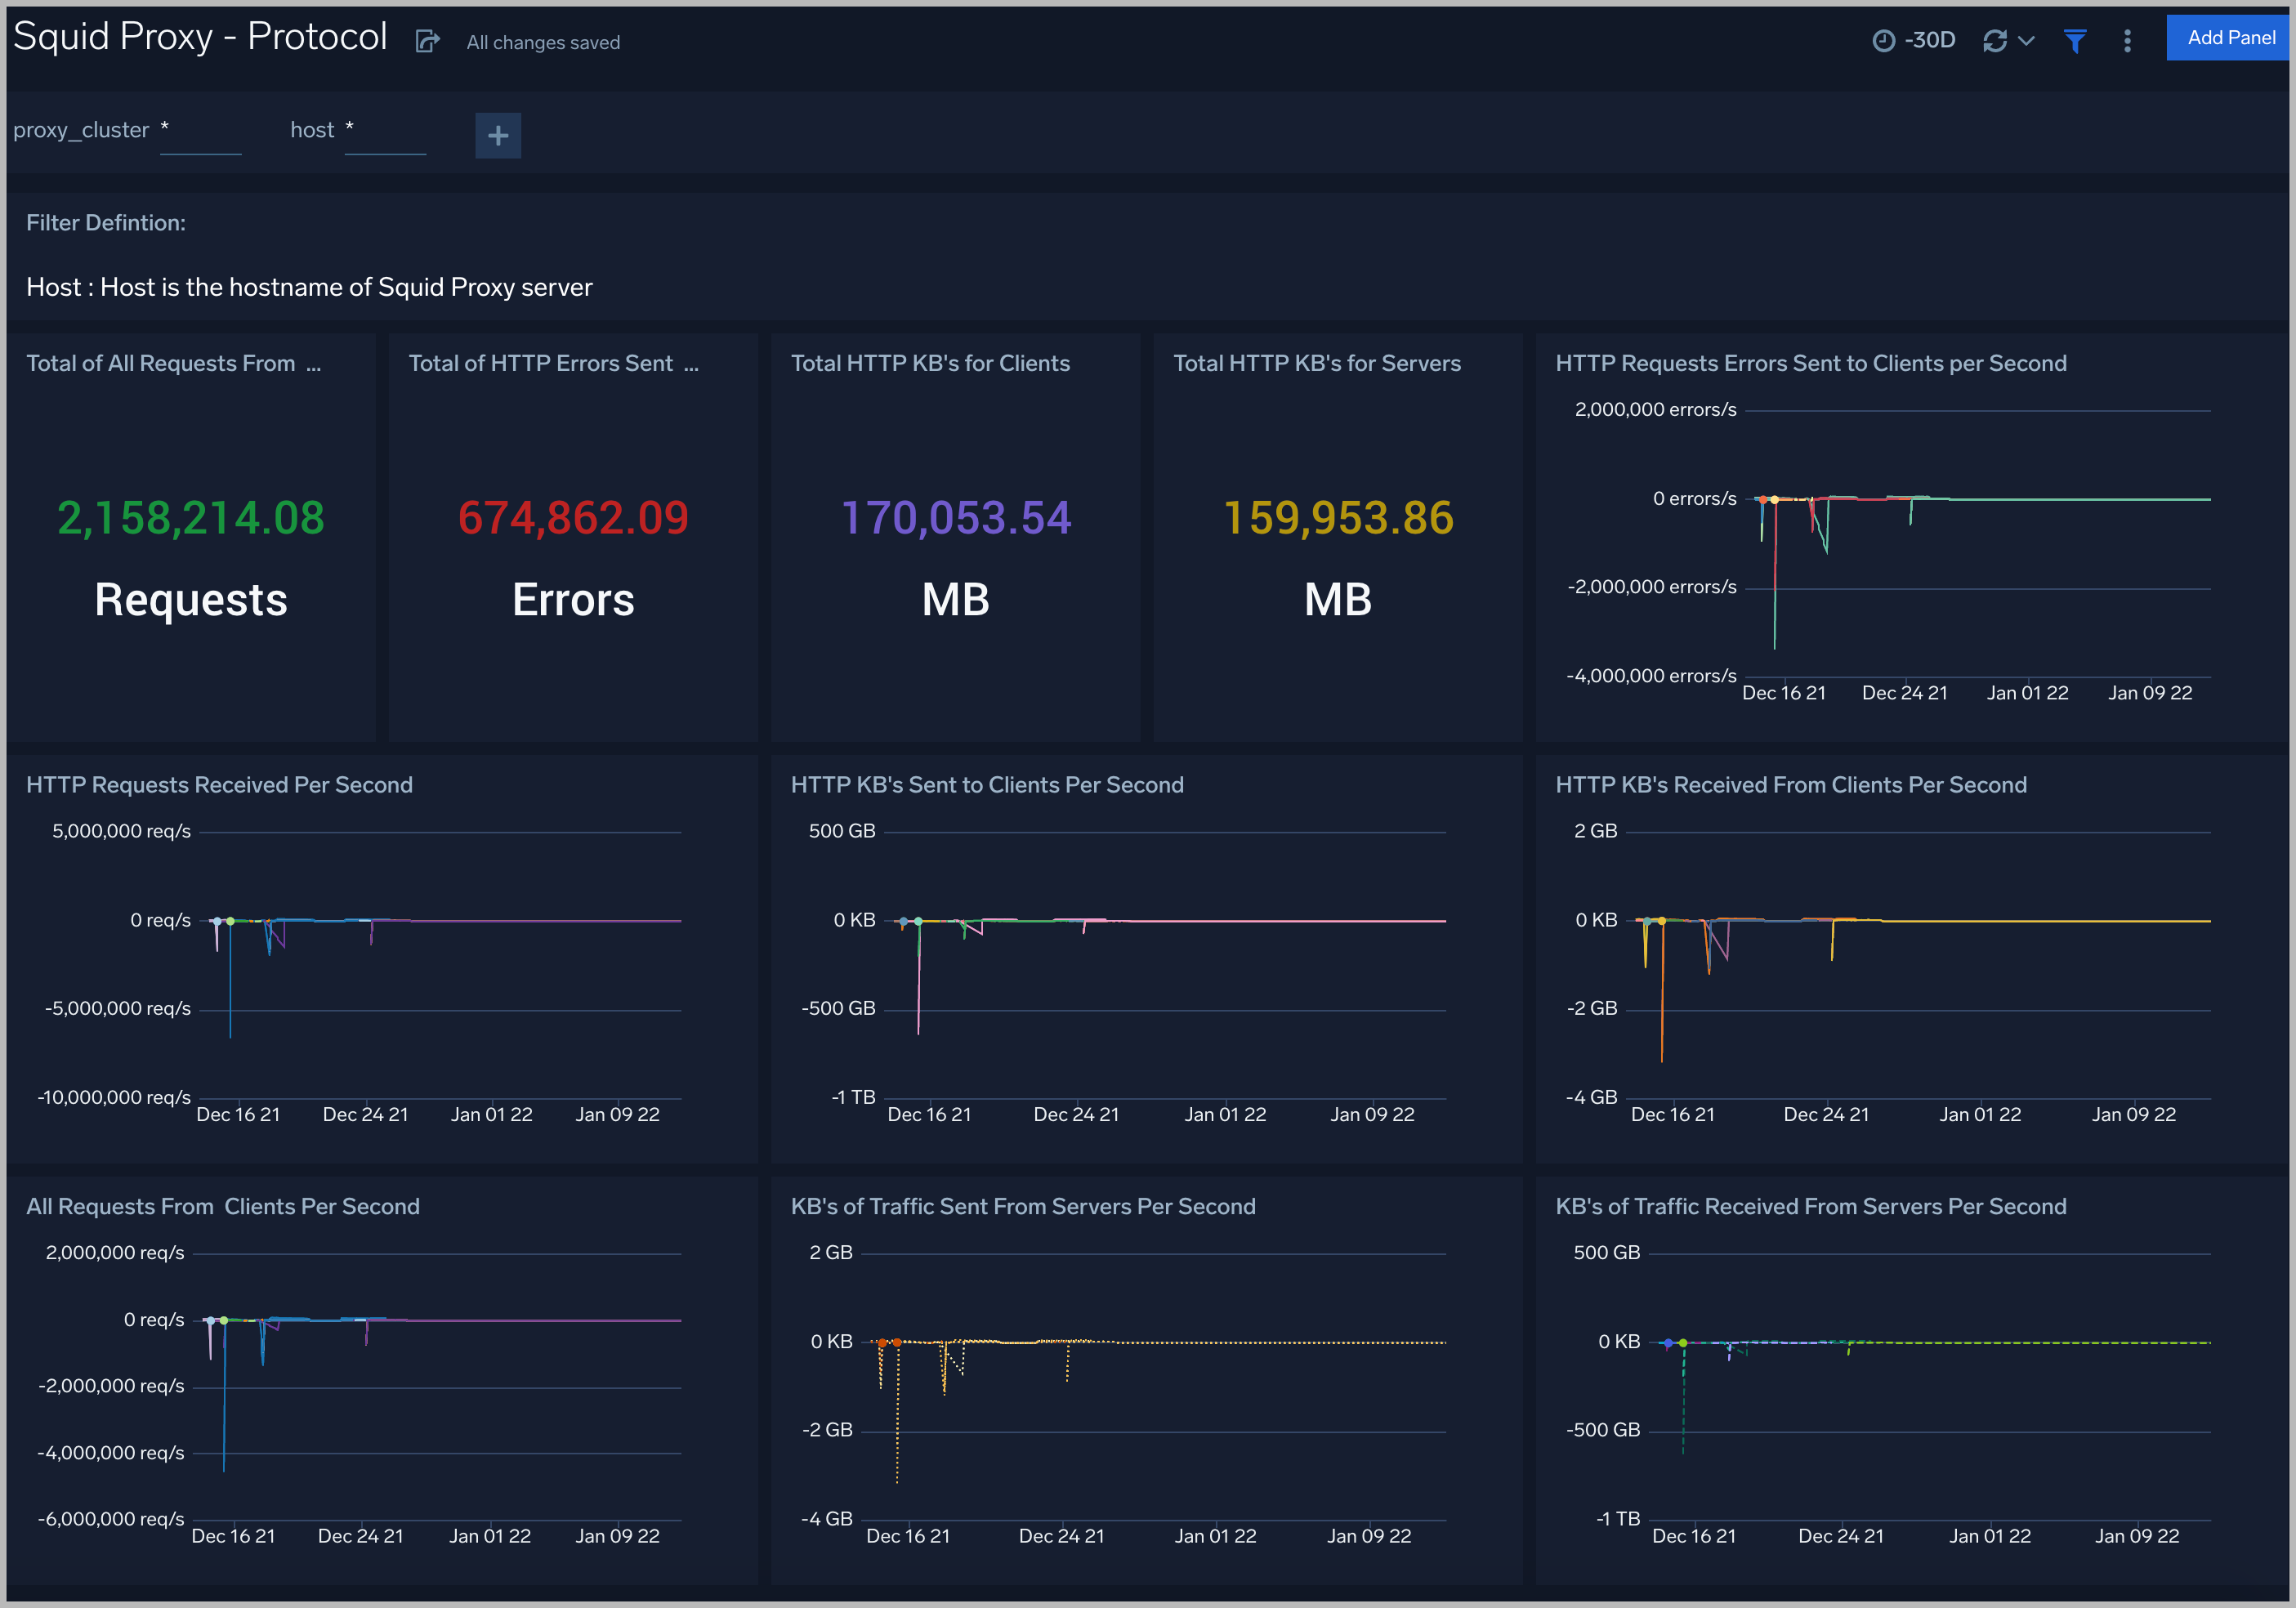
Protocol
The Squid Proxy (Classic) - Protocol dashboard provides insight into the protocols of clusters: the number of HTTP requests, HTTP errors, total bytes transferred, the number of HTTP requests per second, and the number of HTTP bytes per second.
Use this dashboard to:
- Get detailed information about the total number of requests from clients, the total number of HTTP errors sent to clients, the total number of bytes transferred on servers, total number of bytes sent to clients
- Get insights into information about HTTP requests, HTTP errors, and bandwidth transferred over time.
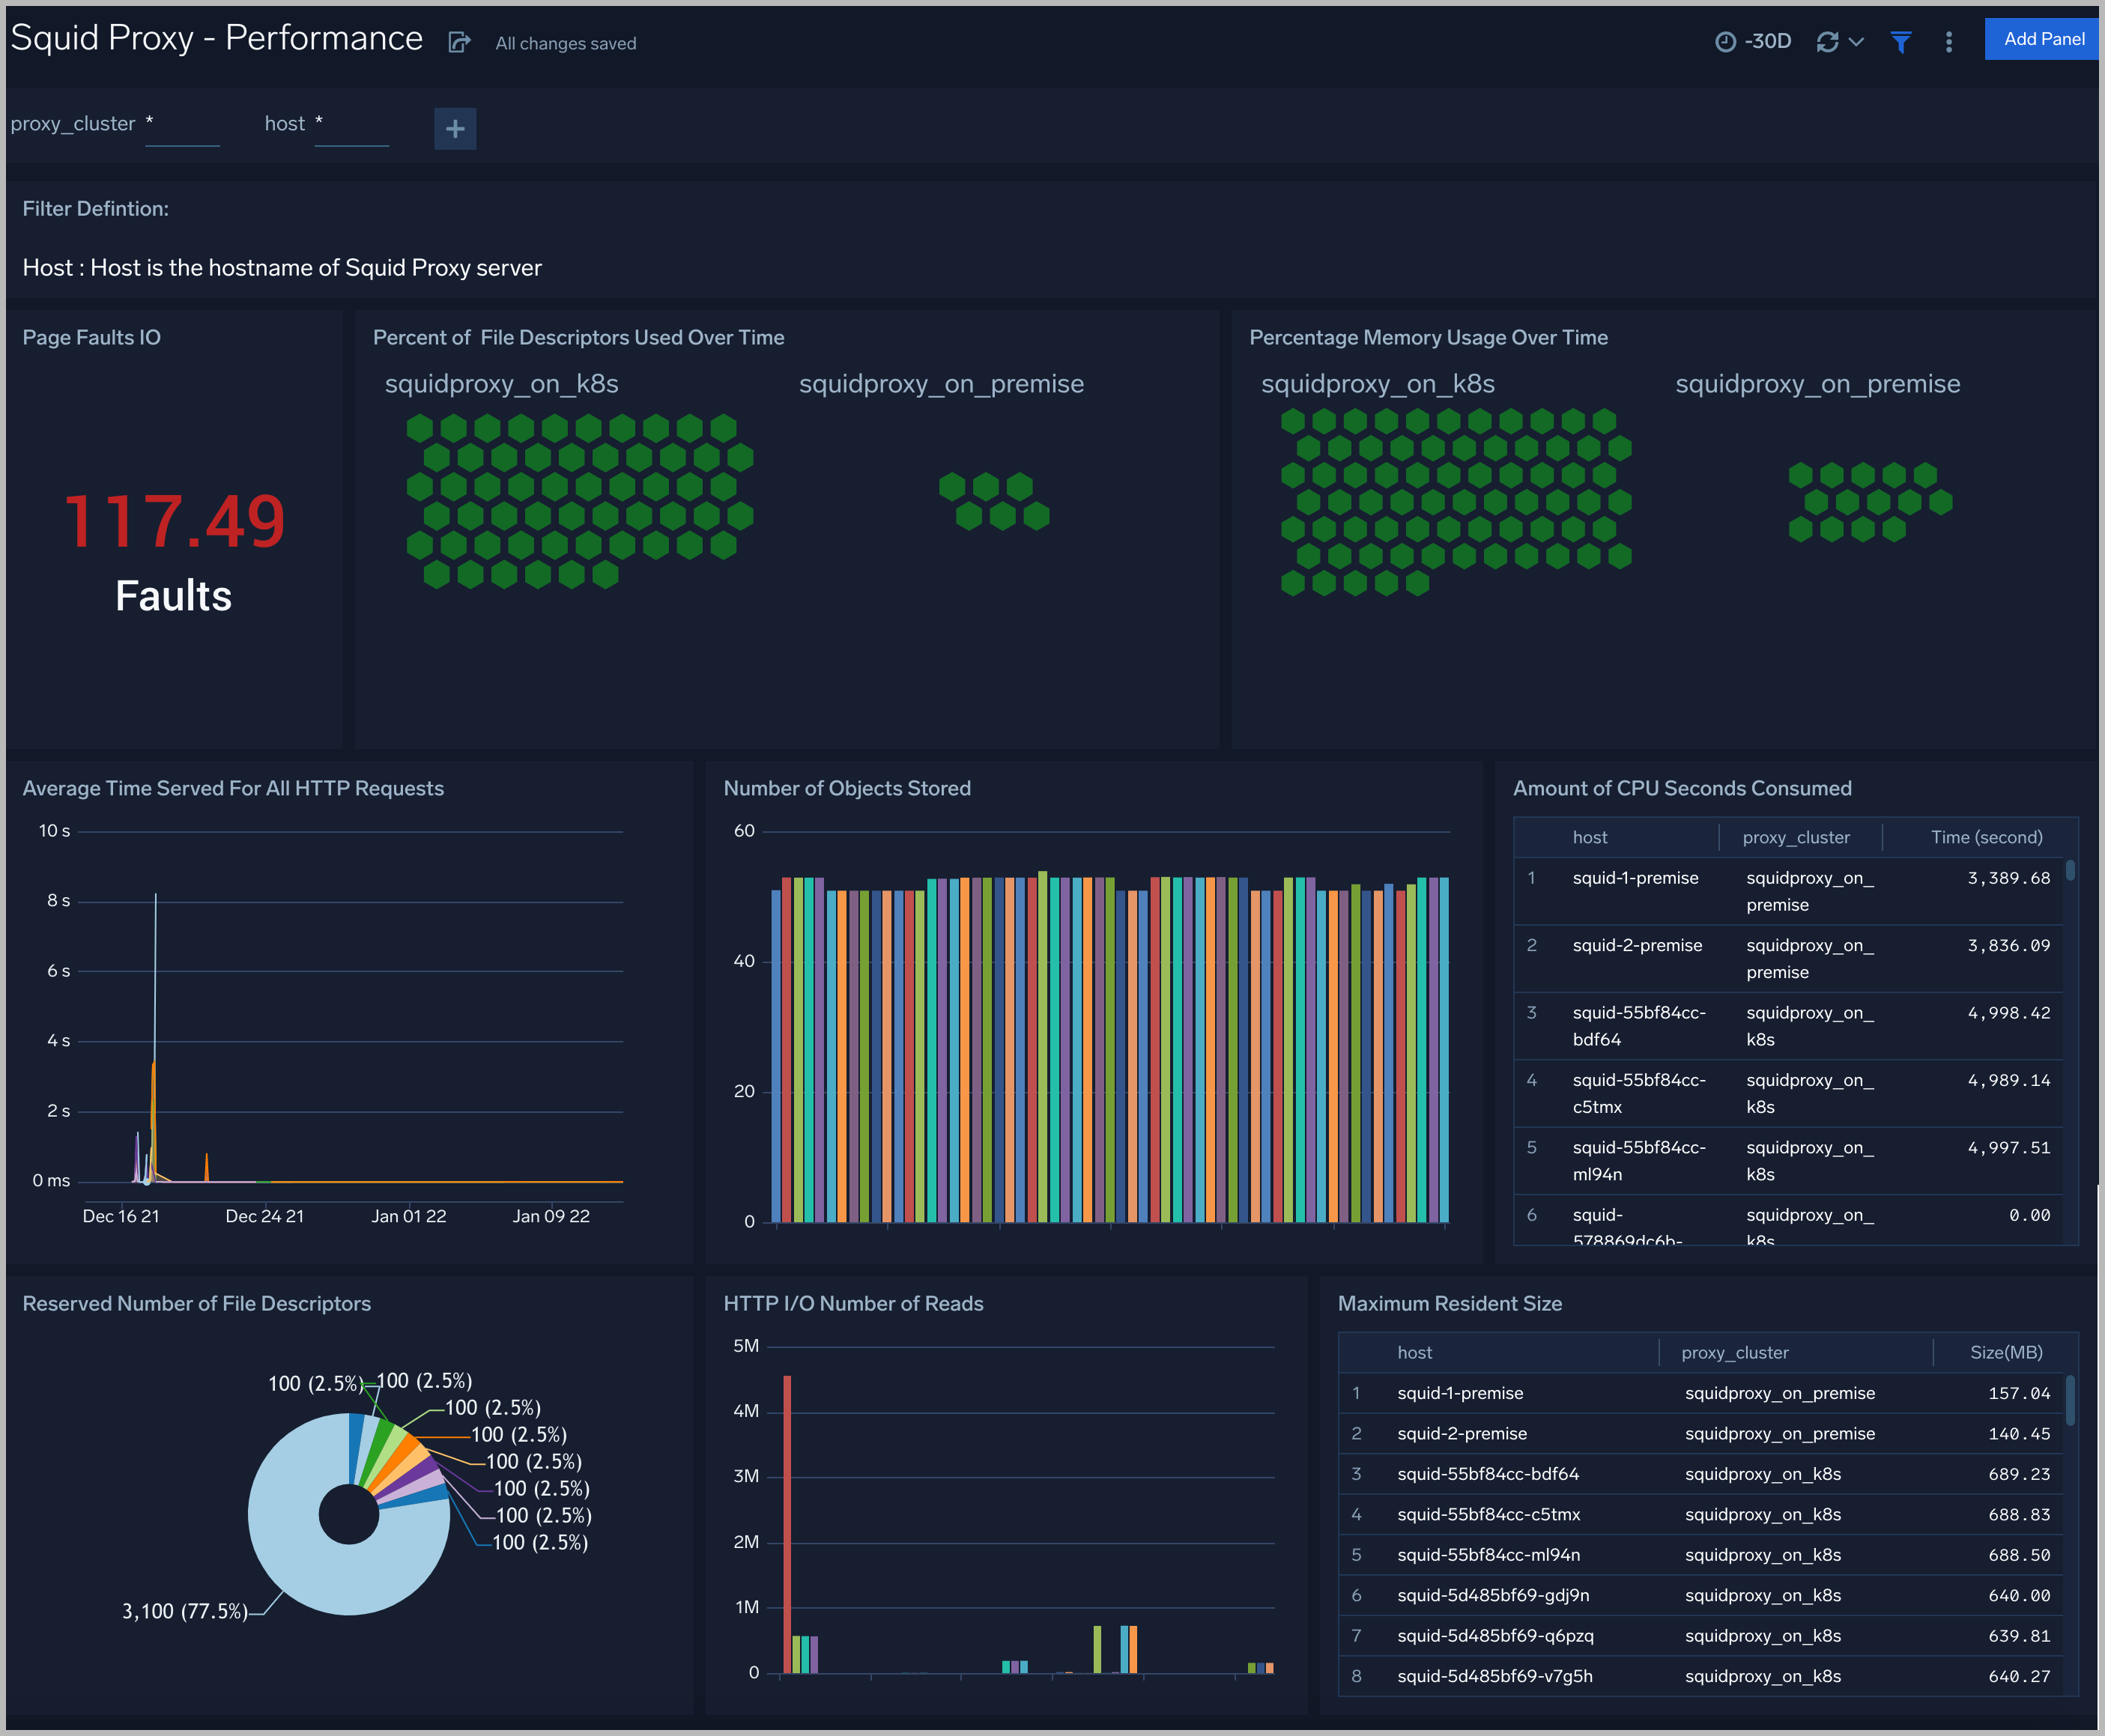
Performance
The Squid Proxy (Classic) - Performance dashboard provides insight into the workload of clusters, the number of page faults, the percent of file descriptors used, the number of memory used, the time for all HTTP requests, the number of objects in the cache, and the CPU time.
Use this dashboard to:
- Gain insights into the workload of squid proxy servers, such as the percentage of file descriptors used, memory usage, and CPU time consumed.
- Gain insights into the read and write status of Squid Proxy servers, such as Page Faults IO, HTTP I/O number of reading, the number of objects stored, and the average response time.
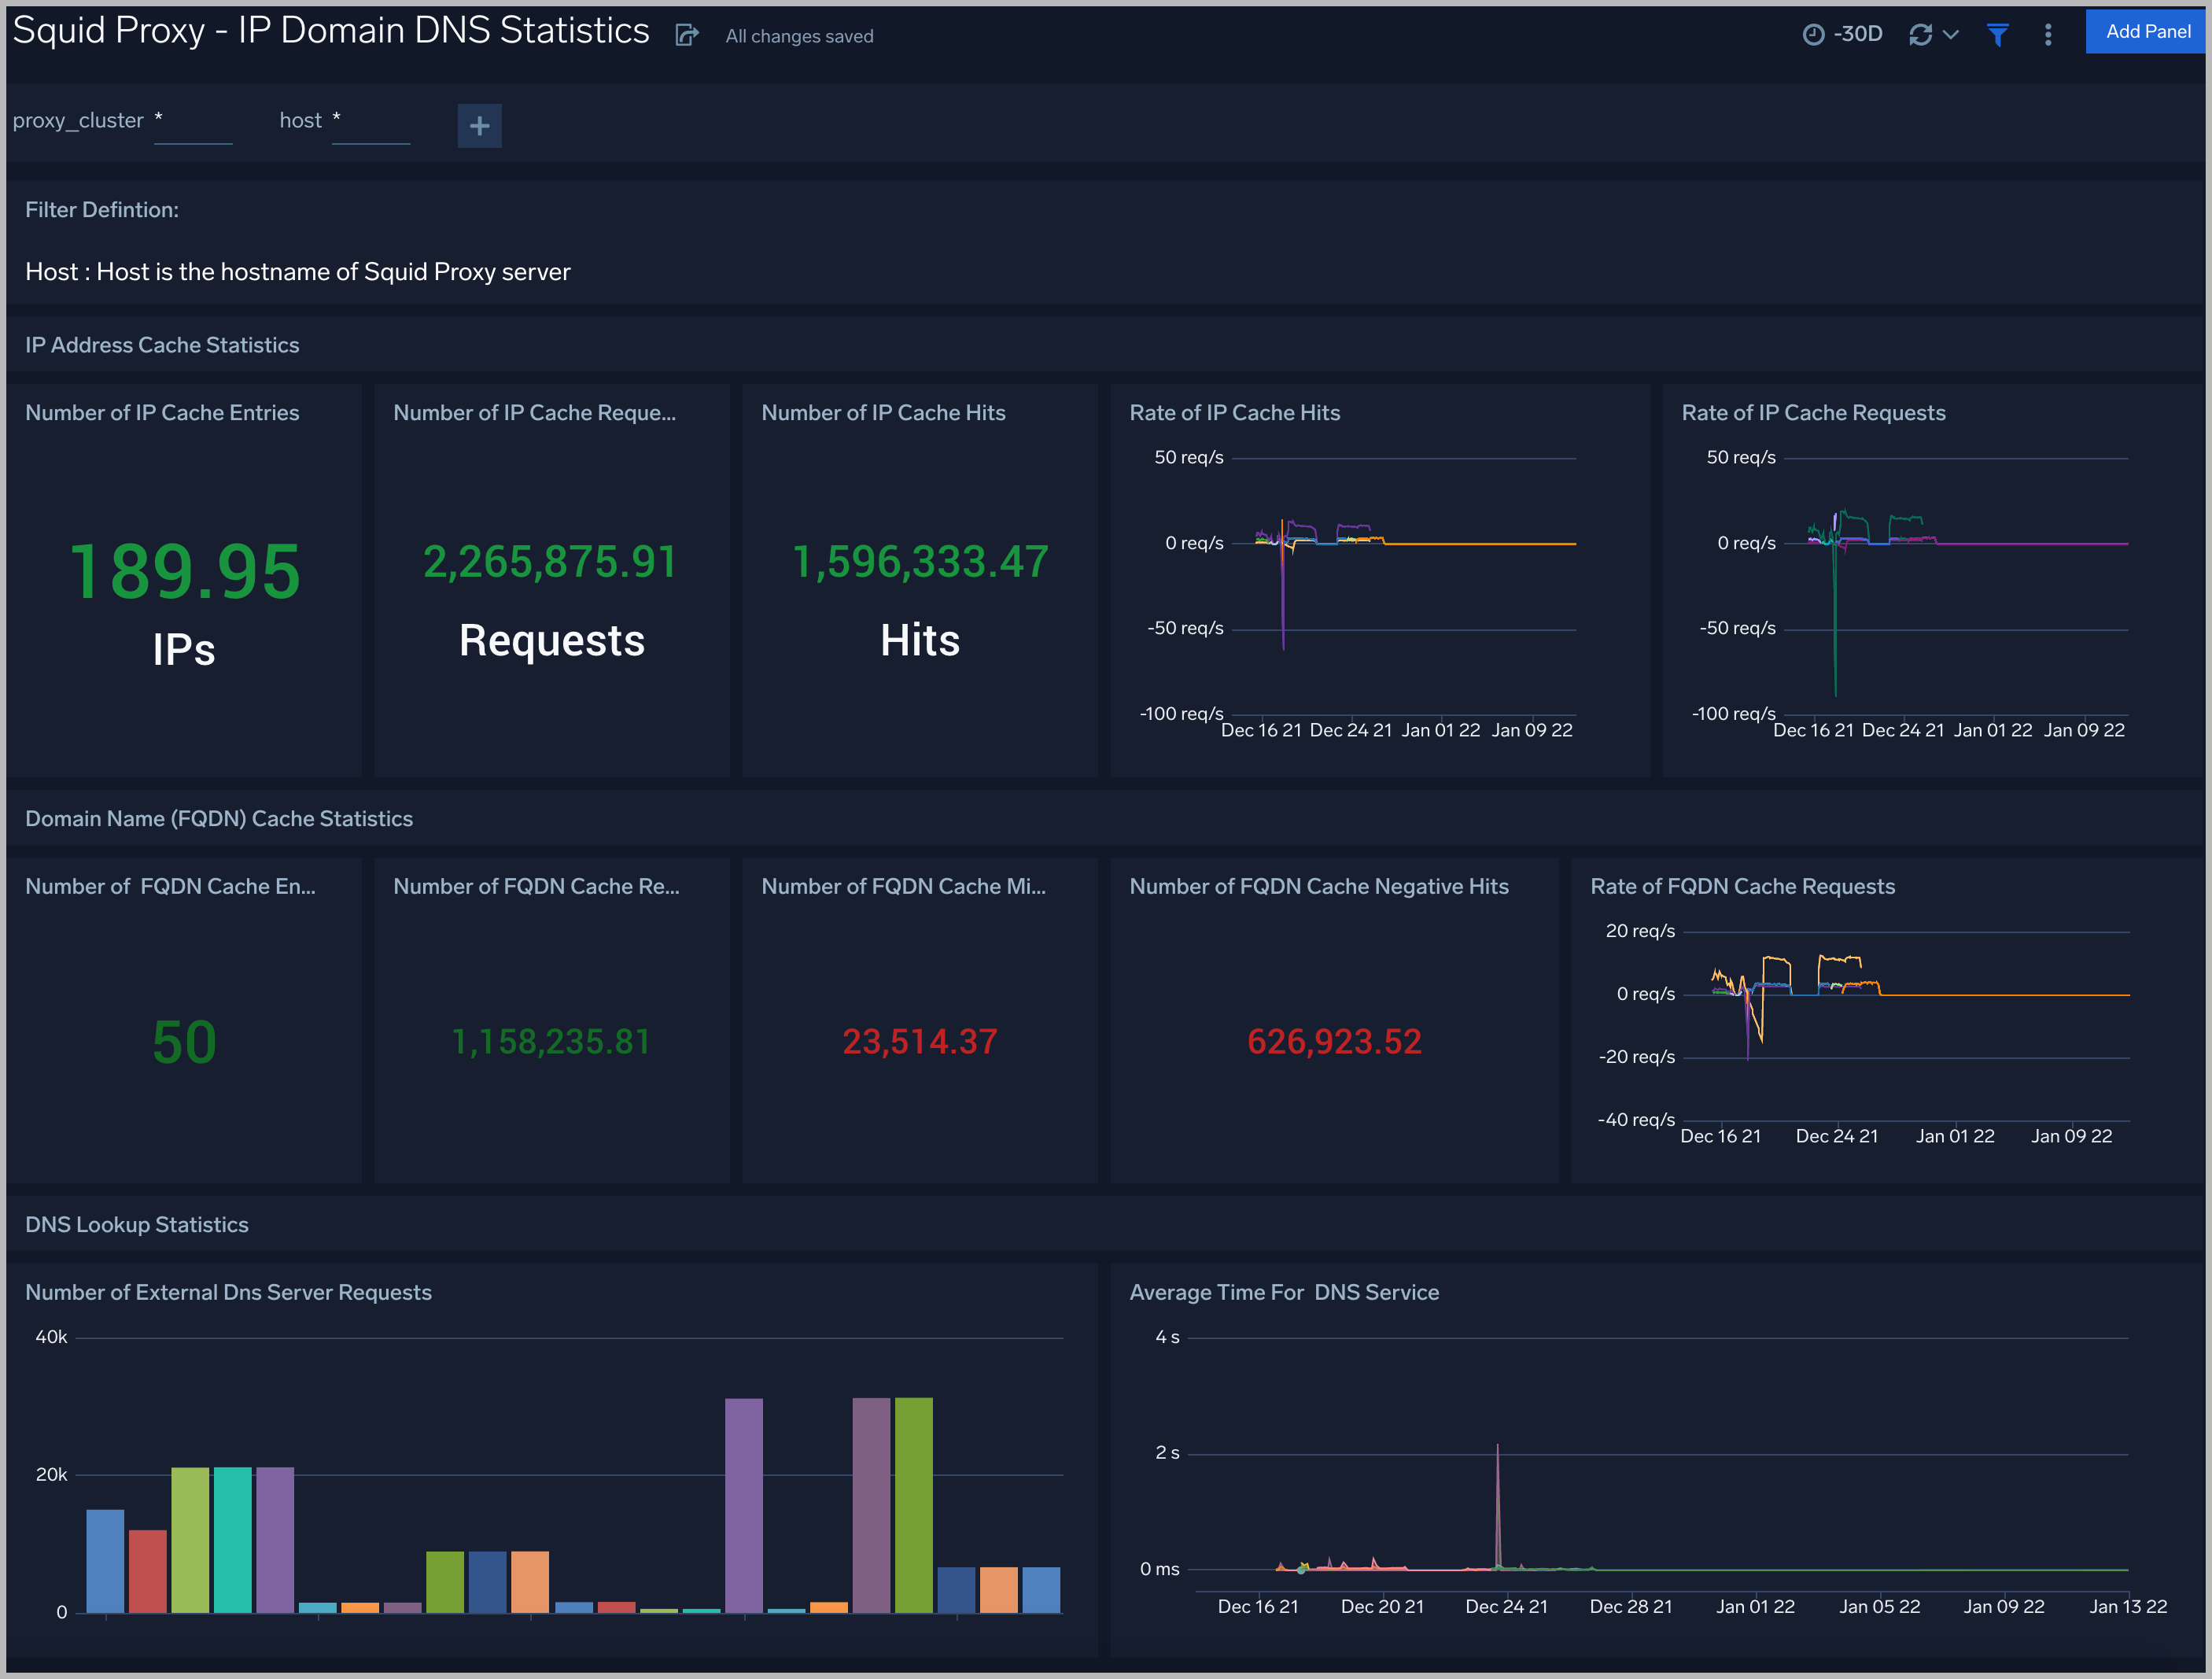
IP Domain DNS Statistics
The Squid Proxy (Classic) - IP Domain DNS Statistics dashboard provides a high-level view of the number of IPs, the number of FQDNs, the rate of requests cached according to FQDNs, the rate of requests cached according to IPs, the number of DNS queries, and the time for DNS queries.
Use this dashboard to:
- Gain insights into IP access statistics: IP Cache Entries, Number and rate of IP Cache requests, Number and rate of IP Cache hits.
- Gain insights into Domain Name (FQDN) statistics: FQDN Cache Entries, Number of FQDN Cache misses, Number and rate of FQDN Cache requests, Number of FQDN Cache Negative Hits.
- Gain insights into DNS Lookup statistics: Number of External DNS Server Requests, Average Time for the DNS Service, Number of External DNS Server Replies.
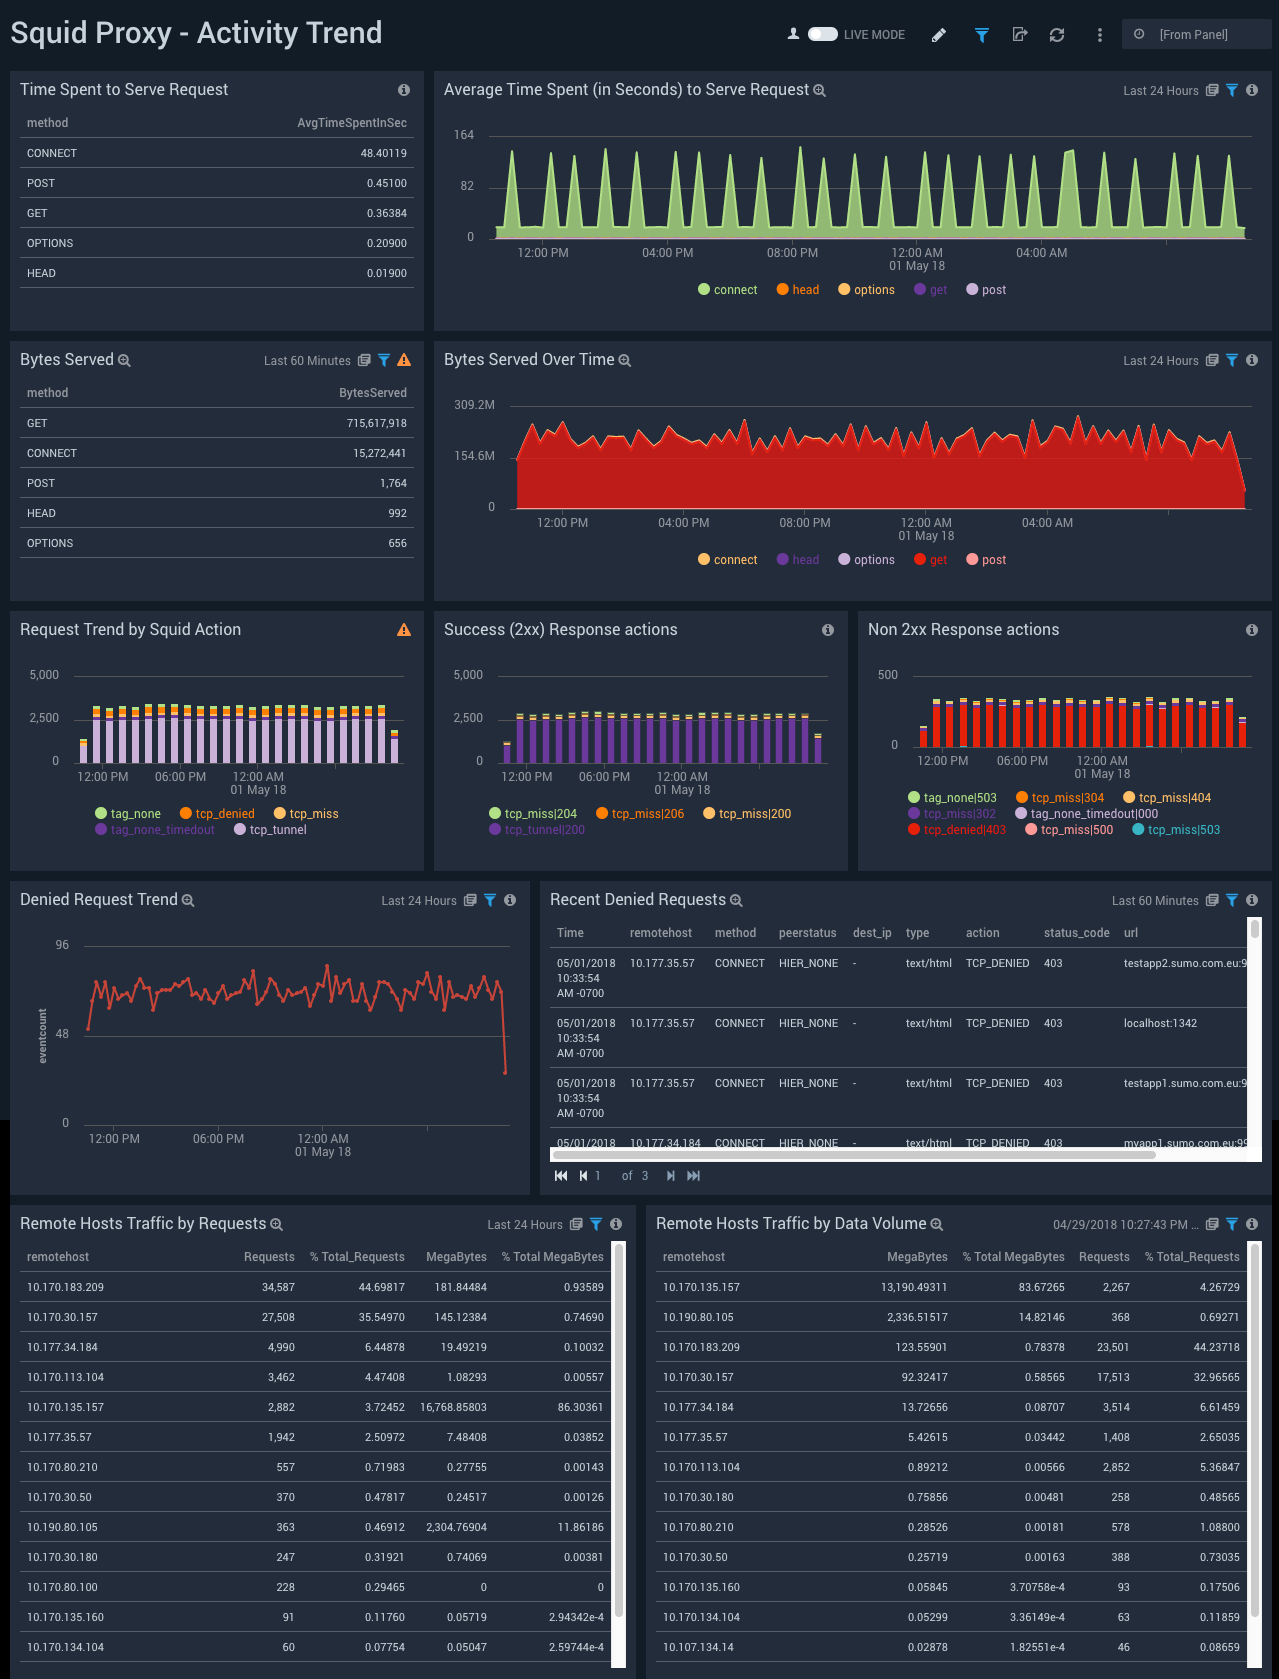
Activity Trend
The Squid Proxy (Classic) - Activity Trend dashboard provides trends around denied request trend, action trend, time spent to serve, success and non-success response, and remote hosts.
Use this dashboard to:
- Gain insights into the average time it takes to serve a request and the kind of method the request was.
- Gain insights into the average time spent to serve requests, the megabytes served, the trends in requests by actions, and the count of successful 2xx and non-2xx response actions.
- Gain insights into the trends in the number of denied requests, the remote hosts' traffic by requests, and the remote hosts' traffic by data volume.
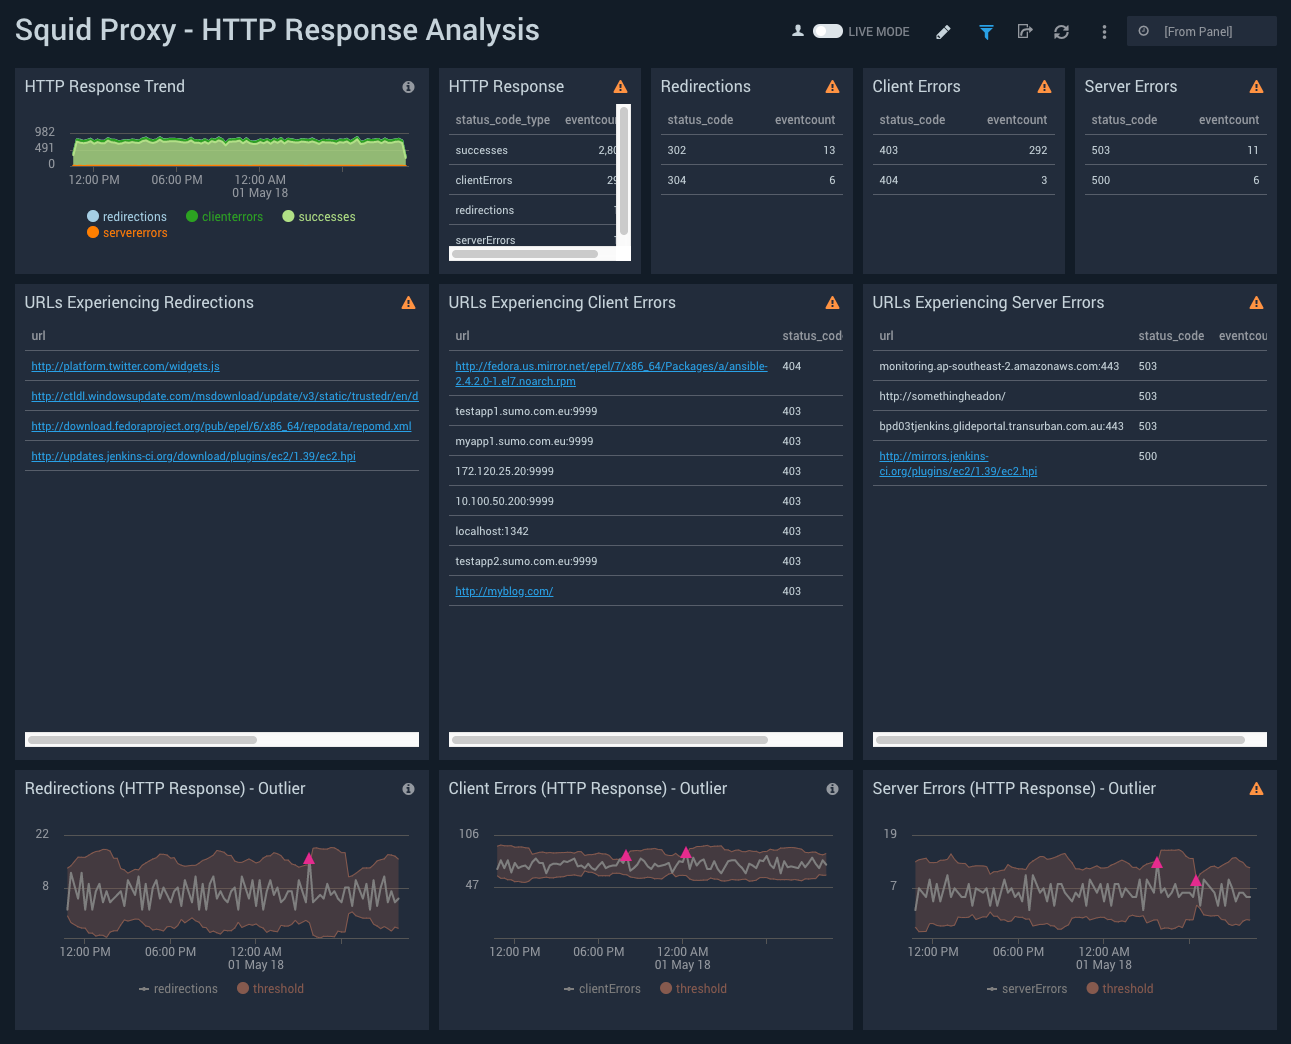
HTTP Response Analysis
The Squid Proxy (Classic) - HTTP Response Analysis dashboard provides insights into HTTP response, HTTP code, the number of client errors, server errors, redirection outliers, and URLs experiencing server errors.
Use this dashboard to:
- Gain insights into the count of HTTP responses, such as redirections, successes, client errors, or server errors, on an area chart.
- Gain insights into client error URLs with information fields: URL, status code, and event count.
- Get detailed information on any outliers in redirection, client error, and server error events on a line chart with thresholds.
Quality of Service
The Squid Proxy (Classic) - Quality of Service dashboard provides insights into latency, the response time of requests according to HTTP action, and the response time according to location.
Use this dashboard to:
- To identify locations with slow average request response times.
- Gain insights into the response times according to HTTP actions.

Create monitors for Squid Proxy app
From your App Catalog:
- From the Sumo Logic navigation, select App Catalog.
- In the Search Apps field, search for and then select your app.
- Make sure the app is installed.
- Navigate to What's Included tab and scroll down to the Monitors section.
- Click Create next to the pre-configured monitors. In the create monitors window, adjust the trigger conditions and notifications settings based on your requirements.
- Scroll down to Monitor Details.
- Under Location click on New Folder.
note
By default, monitor will be saved in the root folder. So to make the maintenance easier, create a new folder in the location of your choice.
- Enter Folder Name. Folder Description is optional.
tip
Using app version in the folder name will be helpful to determine the versioning for future updates.
- Click Create. Once the folder is created, click on Save.
Squid Proxy alerts
| Alert Type (Metrics/Logs) | Alert Name | Alert Description | Trigger Type (Critical / Warning) | Alert Condition | Recover Condition |
|---|---|---|---|---|---|
| Logs | Squid Proxy - High Client (HTTP 4xx) Error Rate | This alert fires when there are too many HTTP requests (>5%) with a response status of 4xx. | Critical | > 0 | <=0 |
| Logs | Squid Proxy - High Server (HTTP 5xx) Error Rate | This alert fires when there are too many HTTP requests (>5%) with a response status of 5xx. | Critical | >0 | <=0 |
| Metrics | Squid Proxy - High Latency | This alert fires when latency on a node in a Squid Proxy cluster is higher than 3 seconds. | Critical | >=3 | <3 |
| Logs | Squid Proxy - High Denied Request | This alert fires when there are too many HTTP denied requests (>5%) | Critical | >0 | <=0 |