Varnish - Classic Collector

The Sumo Logic app for Varnish provides dashboards that help you analyze log and metric events generated by Varnish servers. This app allows you to identify traffic sources, monitor and improve application and website workflows, and understand how customers use your product.
This app is tested with the following versions:
- For Kubernetes environments: Varnish Version 6.4.
- Non-Kubernetes environments: Varnish Version 6.0.7.
Sample log messages
- Kubernetes environments
- Non-Kubernetes environments
{
  "timestamp": 1625219282000,
  "log": "187.255.220.191 - - [01/Jul/2021:15:15:53 +0700] "GET /_includes/wp/blog/wp-content/themes/sumologic/style.css HTTP/1.1" 200 33229114 "http://www.greylock.com" "Mozilla/5.0 (Macintosh; U; Intel Mac OS X 10_6_7; en-us) AppleWebKit/533.21.1 (KHTML, like Gecko) Chrome/19.0.1084.30 Safari/536.5""
  "stream": "stdout",
  "time": "2021-07-02T09:21:20.005706219Z"
}
187.255.220.191 - - [01/Jul/2021:15:15:53 +0700] \
"GET /_includes/wp/blog/wp-content/themes/sumologic/sty
Collecting logs and metrics for Varnish
This section provides instructions for configuring log and metric collection for the Sumo Logic app for Varnish.
Configuring log and metric collection for the Varnish app includes the following tasks:
Configure logs and metrics collection
Instructions below show how to configure Kubernetes and non-Kubernetes environments.
- For Kubernetes environments
- For Non-Kubernetes environments
The Sumo Logic app for Varnish has been tested for Varnish Version: 6.4.
In Kubernetes environments, we use the Telegraf Operator, which is packaged with our Kubernetes collection. You can learn more about it here. The diagram below illustrates how data is collected from Varnish in a Kubernetes environment. In the architecture shown below, there are four services that make up the metric collection pipeline: Telegraf, Telegraf Operator, Prometheus, and Sumo Logic Distribution for OpenTelemetry Collector.
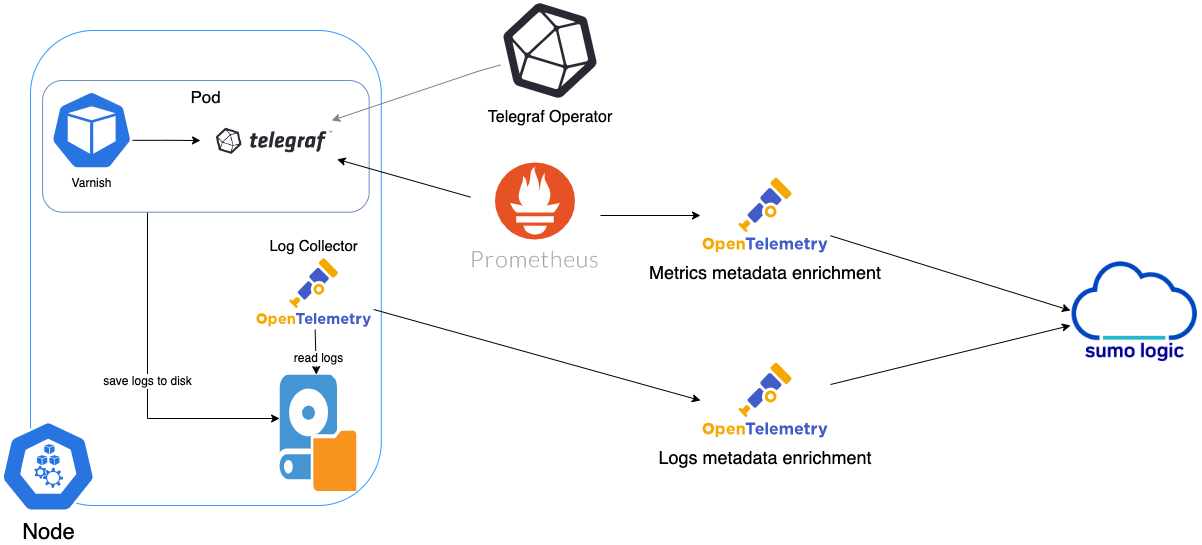
The first service in the pipeline is Telegraf. Telegraf collects metrics from Varnish. Note that we’re running Telegraf in each pod we want to collect metrics from as a sidecar deployment, for example, Telegraf runs in the same pod as the containers it monitors. Telegraf uses the Varnish input plugin to obtain metrics. For simplicity, the diagram doesn’t show the input plugins. The injection of the Telegraf sidecar container is done by the Telegraf Operator. Prometheus pulls metrics from Telegraf and sends them to Sumo Logic Distribution for OpenTelemetry Collector, which enriches metadata and sends metrics to Sumo Logic.
In the logs pipeline, Sumo Logic Distribution for OpenTelemetry Collector collects logs written to standard out and forwards them to another instance of Sumo Logic Distribution for OpenTelemetry Collector, which enriches metadata and sends logs to Sumo Logic.
It’s assumed that you are using the latest Helm chart version. If not, upgrade using the instructions here.
Configure metrics collection
This section explains the steps to collect Varnish metrics from a Kubernetes environment.
- Set up Kubernetes Collection with the Telegraf Operator.
- On your Varnish Pods, add the following annotations:
annotations:
  telegraf.influxdata.com/class: sumologic-prometheus
  prometheus.io/scrape: "true"
  prometheus.io/port: "9273"
  telegraf.influxdata.com/inputs: |+
  [[inputs.varnish]]
   use_sudo = true
   binary = "/usr/bin/varnishstat"
   stats = ["*"]
   [inputs.varnish.tags]
    component="cache"
    environment="dev_CHANGME"
    cache_system="varnish"
    cache_cluster="varnish_on_k8s_CHANGEME"
Enter in values for the following parameters (marked CHANGEME in the snippet above):
telegraf.influxdata.com/inputs. This contains the required configuration for the Telegraf Varnish input plugin. Please refer to this doc for more information on configuring the Varnish input plugin for Telegraf. Note: As Telegraf will be run as a sidecar, the host should always be localhost.- In the input plugins section, which is
[[inputs.varnish]]binary. The default location of the Varnish stat binary. Please override as per your configuration.use_sudo. If running as a restricted user, prepend sudo for additional access.stats. Stats may also be set to["*"], which will collect all stats. See this doc for more information on additional parameters for configuring the Varnish input plugin for Telegraf.
- In the tags section, which is
[inputs.varnish.tags]environment. This is the deployment environment where the Varnish cluster identified by the value of servers resides. For example: dev, prod, or qa. While this value is optional, we highly recommend setting it.cache_cluster. Enter a name to identify this Varnish cluster. This cluster name will be shown in the Sumo Logic dashboards.
- In the input plugins section, which is
Do not modify the following values set by this configuration, as it will cause the Sumo Logic app to not function correctly.
telegraf.influxdata.com/class: sumologic-prometheus. This instructs the Telegraf operator what output to use. This should not be changed.prometheus.io/scrape: "true". This ensures our Prometheus will scrape the metrics.prometheus.io/port: "9273". This tells Prometheus what ports to scrape on. This should not be changed.telegraf.influxdata.com/inputs- In the tags section,
[inputs.varnish.tags]component: “cache”. This value is used by Sumo Logic apps to identify application components.cache_system: “varnish”. This value identifies the web server system.
- In the tags section,
For all other parameters, see this doc for more parameters that can be configured in the Telegraf agent globally.
- Sumo Logic Kubernetes collection will automatically start collecting metrics from the pods having the labels and annotations defined in the previous step.
- Verify metrics in Sumo Logic.
Configure logs collection
This section explains the steps to collect Varnish logs from a Kubernetes environment.
- (Recommended Method) Add labels on your Varnish pods to capture logs from standard output. Follow the instructions below to capture Varnish logs from stdout on Kubernetes.
- Apply the following labels to the Varnish pods:
environment: "prod_CHANGEME"
component: "cache"
cache_system: "varnish"
cache_cluster: "varnish_on_k8s_CHANGEME"- Enter the values for the following parameters (marked
CHANGEMEin the snippet above):
environment. This is the deployment environment where the Varnish cluster identified by the value ofserversresides. For example: dev, prod, or qa. While this value is optional,l we highly recommend setting it.cache_cluster. Enter a name to identify this Varnish cluster. This cluster name will be shown in the Sumo Logic dashboards.
Do not modify the following values set by this configuration, as it will cause the Sumo Logic app to not function correctly.
component: “cache”. This value is used by Sumo Logic apps to identify application components.cache_system: “varnish”. This value identifies the cache system.
For all other parameters, see this doc for more parameters that can be configured in the Telegraf agent globally.
- (Optional) Collecting Varnish Logs from a Log File. Follow the steps below to capture Varnish logs from a log file on Kubernetes.
- Install the Sumo Logic tailing sidecar operator.
- Add the following annotation in addition to the existing annotations.
Example:annotations:
tailing-sidecar: sidecarconfig;<mount>:<path_of_Varnish_log_file>/<Varnish_log_file_name>annotations:
tailing-sidecar: sidecarconfig;data: /var/log/varnish/varnishncsa.log- Make sure that the Varnish pods are running and annotations are applied by using the command:
kubectl describe pod <Varnish_pod_name>- Sumo Logic Kubernetes collection will automatically start collecting logs from the pods having the annotations defined above.
- Verify logs in Sumo Logic.
FER to normalize the fields in Kubernetes environments. Labels created in Kubernetes environments automatically are prefixed with pod_labels. To normalize these for our app to work, a Field Extraction Rule named AppObservabilityVarnishFER is automatically created for Varnish Application Components.
We use the Telegraf operator for Varnish metric collection and the Sumo Logic Installed Collector for collecting Varnish logs. The diagram below illustrates the components of the Varnish collection in a non-Kubernetes environment.
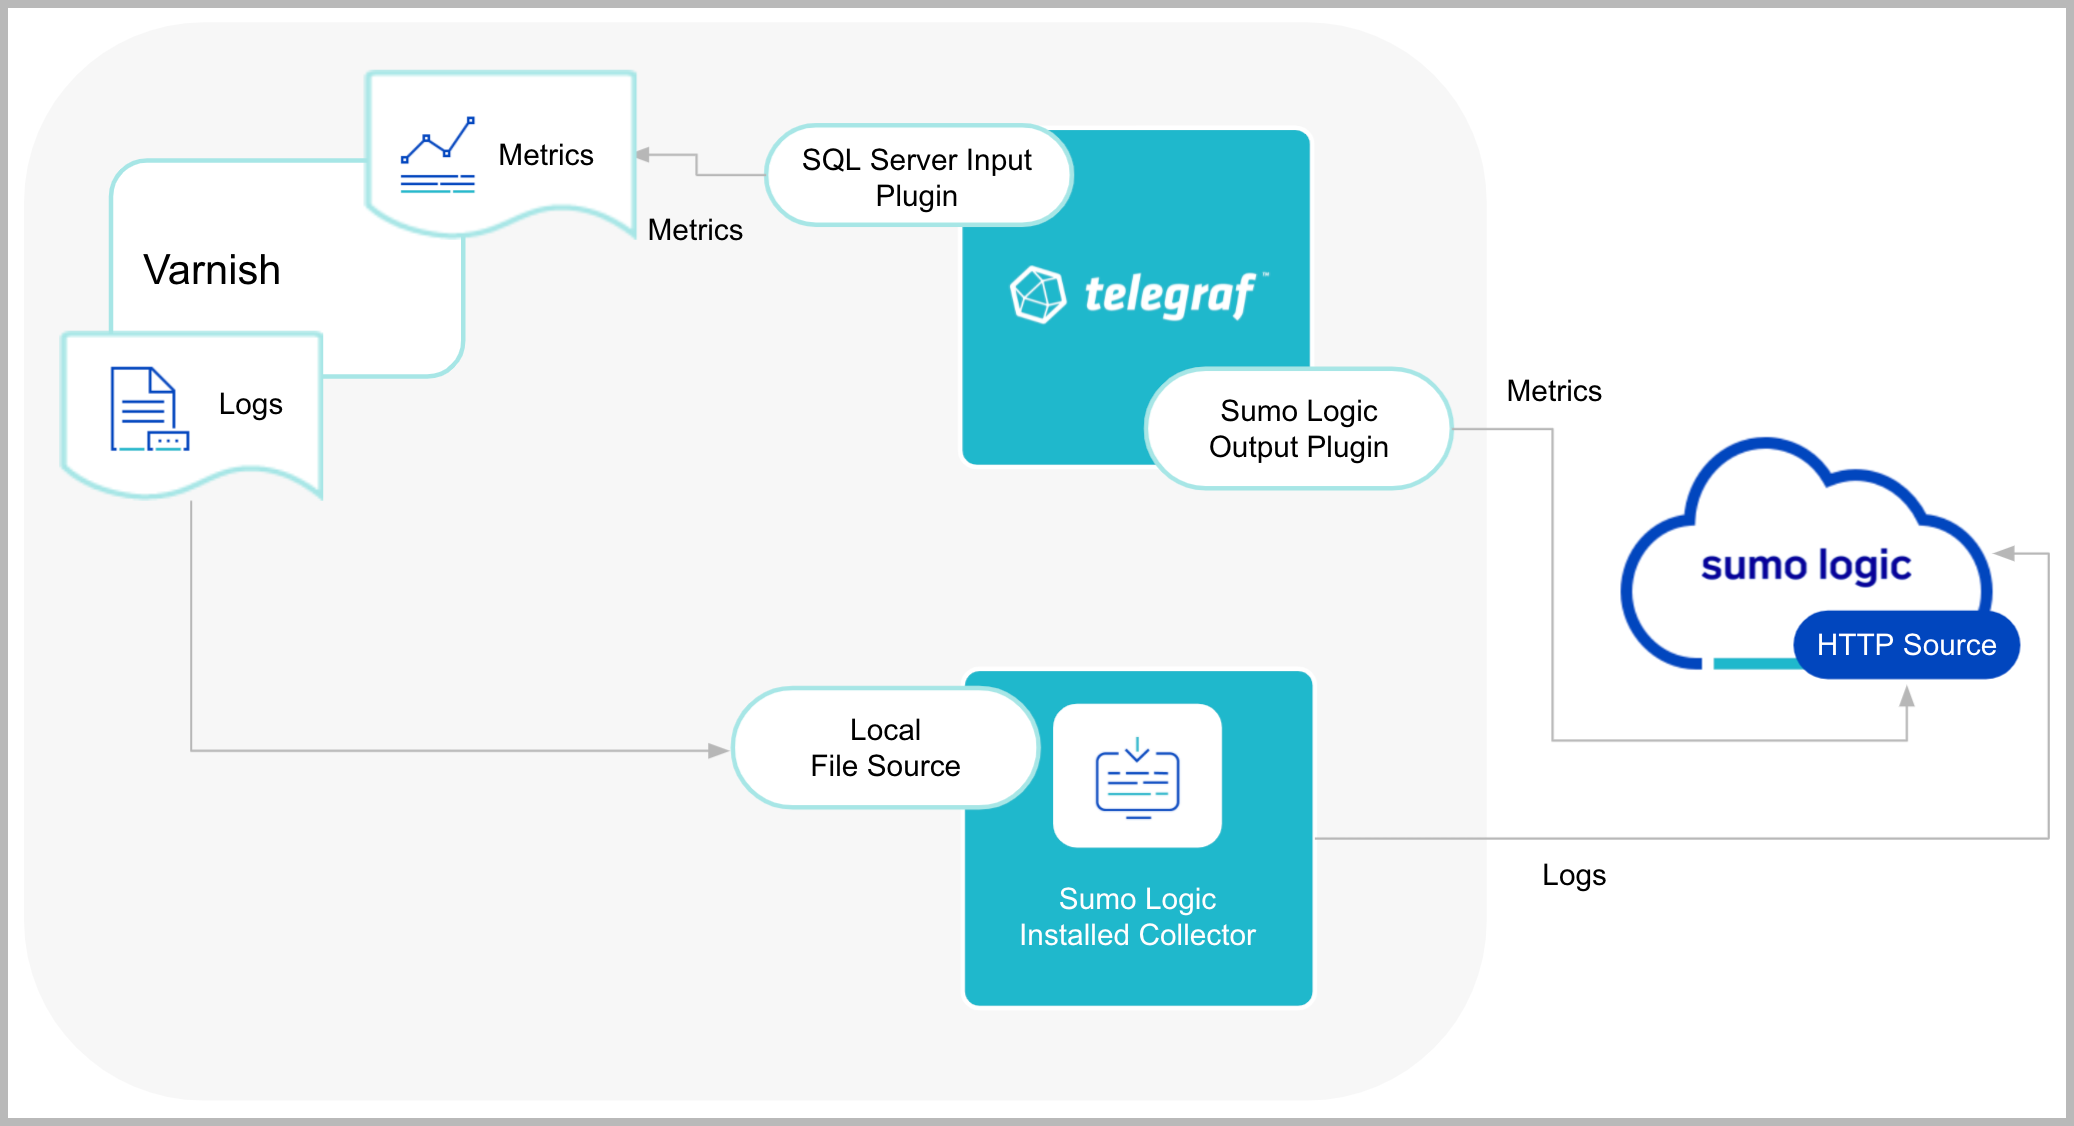
Telegraf runs on the same system as Varnish and uses the Varnish input plugin to obtain Varnish metrics, and the Sumo Logic output plugin to send the metrics to Sumo Logic. Logs from Varnish, on the other hand, are sent to a Sumo Logic Local File source.
Configure metrics collection
This section provides instructions for configuring metrics collection for the Sumo Logic app for Varnish.
- Configure a Hosted Collector. To create a new Sumo Logic hosted collector, perform the steps in theCreate a Hosted Collector section of the Sumo Logic documentation.
- Configure an HTTP Logs and Metrics Source. Create a new HTTP Logs and Metrics Source in the hosted collector created above by following the instructions given in this document. Make a note of the HTTP Source URL.
- Install Telegraf. Use the following steps to install Telegraf.
- Configure and start Telegraf. As part of collecting metrics data from Telegraf, we will use the Varnish input plugin to get data from Telegraf and the Sumo Logic output plugin to send data to Sumo Logic.
Create or modify telegraf.conf and copy and paste the text below:
 use_sudo = true
  binary = "/usr/bin/varnishstat"
  stats = ["*"]
  [inputs.varnish.tags]
   component="cache"
   environment="dev_CHANGME"
   cache_system="varnish"
   cache_cluster="varnish_on_premise_CHANGEME"

  url = "<URL Created in Step 3_CHANGEME>"
  data_format = "prometheus"
Please enter values for the following parameters (marked CHANGEME above):
- In the input plugins section, which is
[[inputs.varnish]]binary- The default location of the Varnish stat binary. Please override as per your configuration.use_sudo- If running as a restricted user, prepend sudo for additional access.stats- Stats may also be set to ["*"], which will collect all stats. Please see this doc for more information on additional parameters for configuring the Varnish input plugin for Telegraf.- In the tags section, which is
[inputs.varnish.tags]environment. This is the deployment environment where the Varnish cluster identified by the value of servers resides. For example, dev, prod, or qa. While this value is optional, we highly recommend setting it.cache_cluster. Enter a name to identify this Varnish cluster. This cluster name will be shown in the Sumo Logic dashboards.
- In the output plugins section, which is
[[outputs.sumologic]]url- This is the HTTP source URL created in step 3. Please see this doc for more information on additional parameters for configuring the Sumo Logic Telegraf output plugin.
Do not modify the following values set by this Telegraf configuration, as it will cause the Sumo Logic app to not function correctly.
data_format=“prometheus”. In the output plugins section, which is[[outputs.sumologic]]. Metrics are sent in the Prometheus format to Sumo LogicComponent=“cache”. In the input plugins section, which is[[inputs.varnish]]- This value is used by Sumo Logic apps to identify application components.cache_system: “varnish”. In the input plugins sections. In other words, this value identifies the cache system- For all other parameters, see this doc for more parameters that can be configured in the Telegraf agent globally.
Once you have finalized your telegraf.conf file, you can start or reload the telegraf service using instructions from the doc.
At this point, Varnish metrics should start flowing into Sumo Logic.
Configure logs collection
This section provides instructions for configuring log collection for Varnish running on a non-Kubernetes environment for the Sumo Logic app for Varnish.
By default, Varnish logs are stored in a log file. Sumo Logic supports collecting logs via a local log file. Local log files can be collected via Installed collectors. An installed collector will require you to allow outbound traffic to Sumo Logic endpoints for collection to work. For detailed requirements for installed collectors, see this page.
- Configure logging in Varnish. Varnish supports logging via the following methods: local text log files. For details, please visit this page. For the dashboards to work properly, please set the below-specified log format as explained here:
%h %l %u %t \"%r\" %s %b \"%{Referer}i\" \"%{User-agent}i\"
- Configure Varnish to log to a Local file. By default, any installation of varnishd will not write any request logs to disk. Instead, Varnish has an in-memory log and supplies tools to tap into this log and write to disk. To configure logging to a local file, follow the steps on this page. By default, Varnish logs are stored in /var/log/varnish/varnishncsa.log. For customized options, please visit this page. Logs from the Varnish log file can be collected via a Sumo Logic Installed collector and a Local File Source as explained in the next section.
- Configuring a Collector. To add an installed collector, perform the steps given in the Configure an Installed Collector document.
- Configuring a Source: To add a Local File Source for Varnish, do the following. To collect logs directly from your Varnish machine, use an Installed Collector and a Local File Source.
- Add a Local File Source.
- Configure the Local File Source fields as follows:
- Name. (Required)
- Description. (Optional)
- File Path (Required). Enter the path to your error.log or access.log. The files are typically located in /var/log/varnish/varnishncsa.log.
- Source Host. Sumo Logic uses the hostname assigned by the OS unless you enter a different hostname.
- Source Category. Enter any string to tag the output collected from this Source, such as Varnish/Logs. (The Source Category metadata field is a fundamental building block to organize and label Sources. For details, see Best Practices.)
- Fields. Set the following fields:
component = cachecache_system = varnishcache_cluster = <Your_Varnish_Cluster_Name>environment = <Environment_Name>, such as Dev, QA, or Prod.
- Configure the Advanced section:
- Enable Timestamp Parsing. Select Extract timestamp information from log file entries.
- Time Zone. Choose the option, Ignore time zone from log file and instead use, and then select your Varnish Server’s time zone.
- Timestamp Format. The timestamp format is automatically detected.
- Encoding. Select UTF-8 (Default).
- Enable Multiline Processing. Detect messages spanning multiple lines
- Infer Boundaries - Detect message boundaries automatically
- Click Save.
At this point, Varnish logs should start flowing into Sumo Logic.
Installing the Varnish app
To install the app, do the following:
Next-Gen App: To install or update the app, you must be an account administrator or a user with Manage Apps, Manage Monitors, Manage Fields, Manage Metric Rules, and Manage Collectors capabilities depending upon the different content types part of the app.
- Select App Catalog.
- In the 🔎 Search Apps field, run a search for your desired app, then select it.
- Click Install App.
note
Sometimes this button says Add Integration.
- Click Next in the Setup Data section.
- In the Configure section of your respective app, complete the following fields.
- Field Name. If you already have collectors and sources set up, select the configured metadata field name (eg _sourcecategory) or specify other custom metadata (eg: _collector) along with its metadata Field Value.
- Is K8S deployment involved. Specify if resources being monitored are partially or fully deployed on Kubernetes (K8s)
- Click Next. You will be redirected to the Preview & Done section.
Post-installation
Once your app is installed, it will appear in your Installed Apps folder, and dashboard panels will start to fill automatically.
Each panel slowly fills with data matching the time range query received since the panel was created. Results will not immediately be available but will be updated with full graphs and charts over time.
As part of the app installation process, the following fields will be created by default:
componentenvironmentcache_systemcache_clusterpod
Additionally, if you're using Varnish in the Kubernetes environment, the following additional fields will be created by default during the app installation process:
pod_labels_componentpod_labels_environmentpod_labels_cache_systempod_labels_cache_cluster
Viewing Varnish dashboards
All dashboards have a set of filters that you can apply to the entire dashboard. Use these filters to drill down and examine the data to a granular level.
- You can change the time range for a dashboard or panel by selecting a predefined interval from a drop-down list, choosing a recently used time range, or specifying custom dates and times. Learn more.
- You can use template variables to drill down and examine the data on a granular level. For more information, see Filtering Dashboards with Template Variables.
- Most Next-Gen apps allow you to provide the scope at the installation time and are comprised of a key (
_sourceCategoryby default) and a default value for this key. Based on your input, the app dashboards will be parameterized with a dashboard variable, allowing you to change the dataset queried by all panels. This eliminates the need to create multiple copies of the same dashboard with different queries.
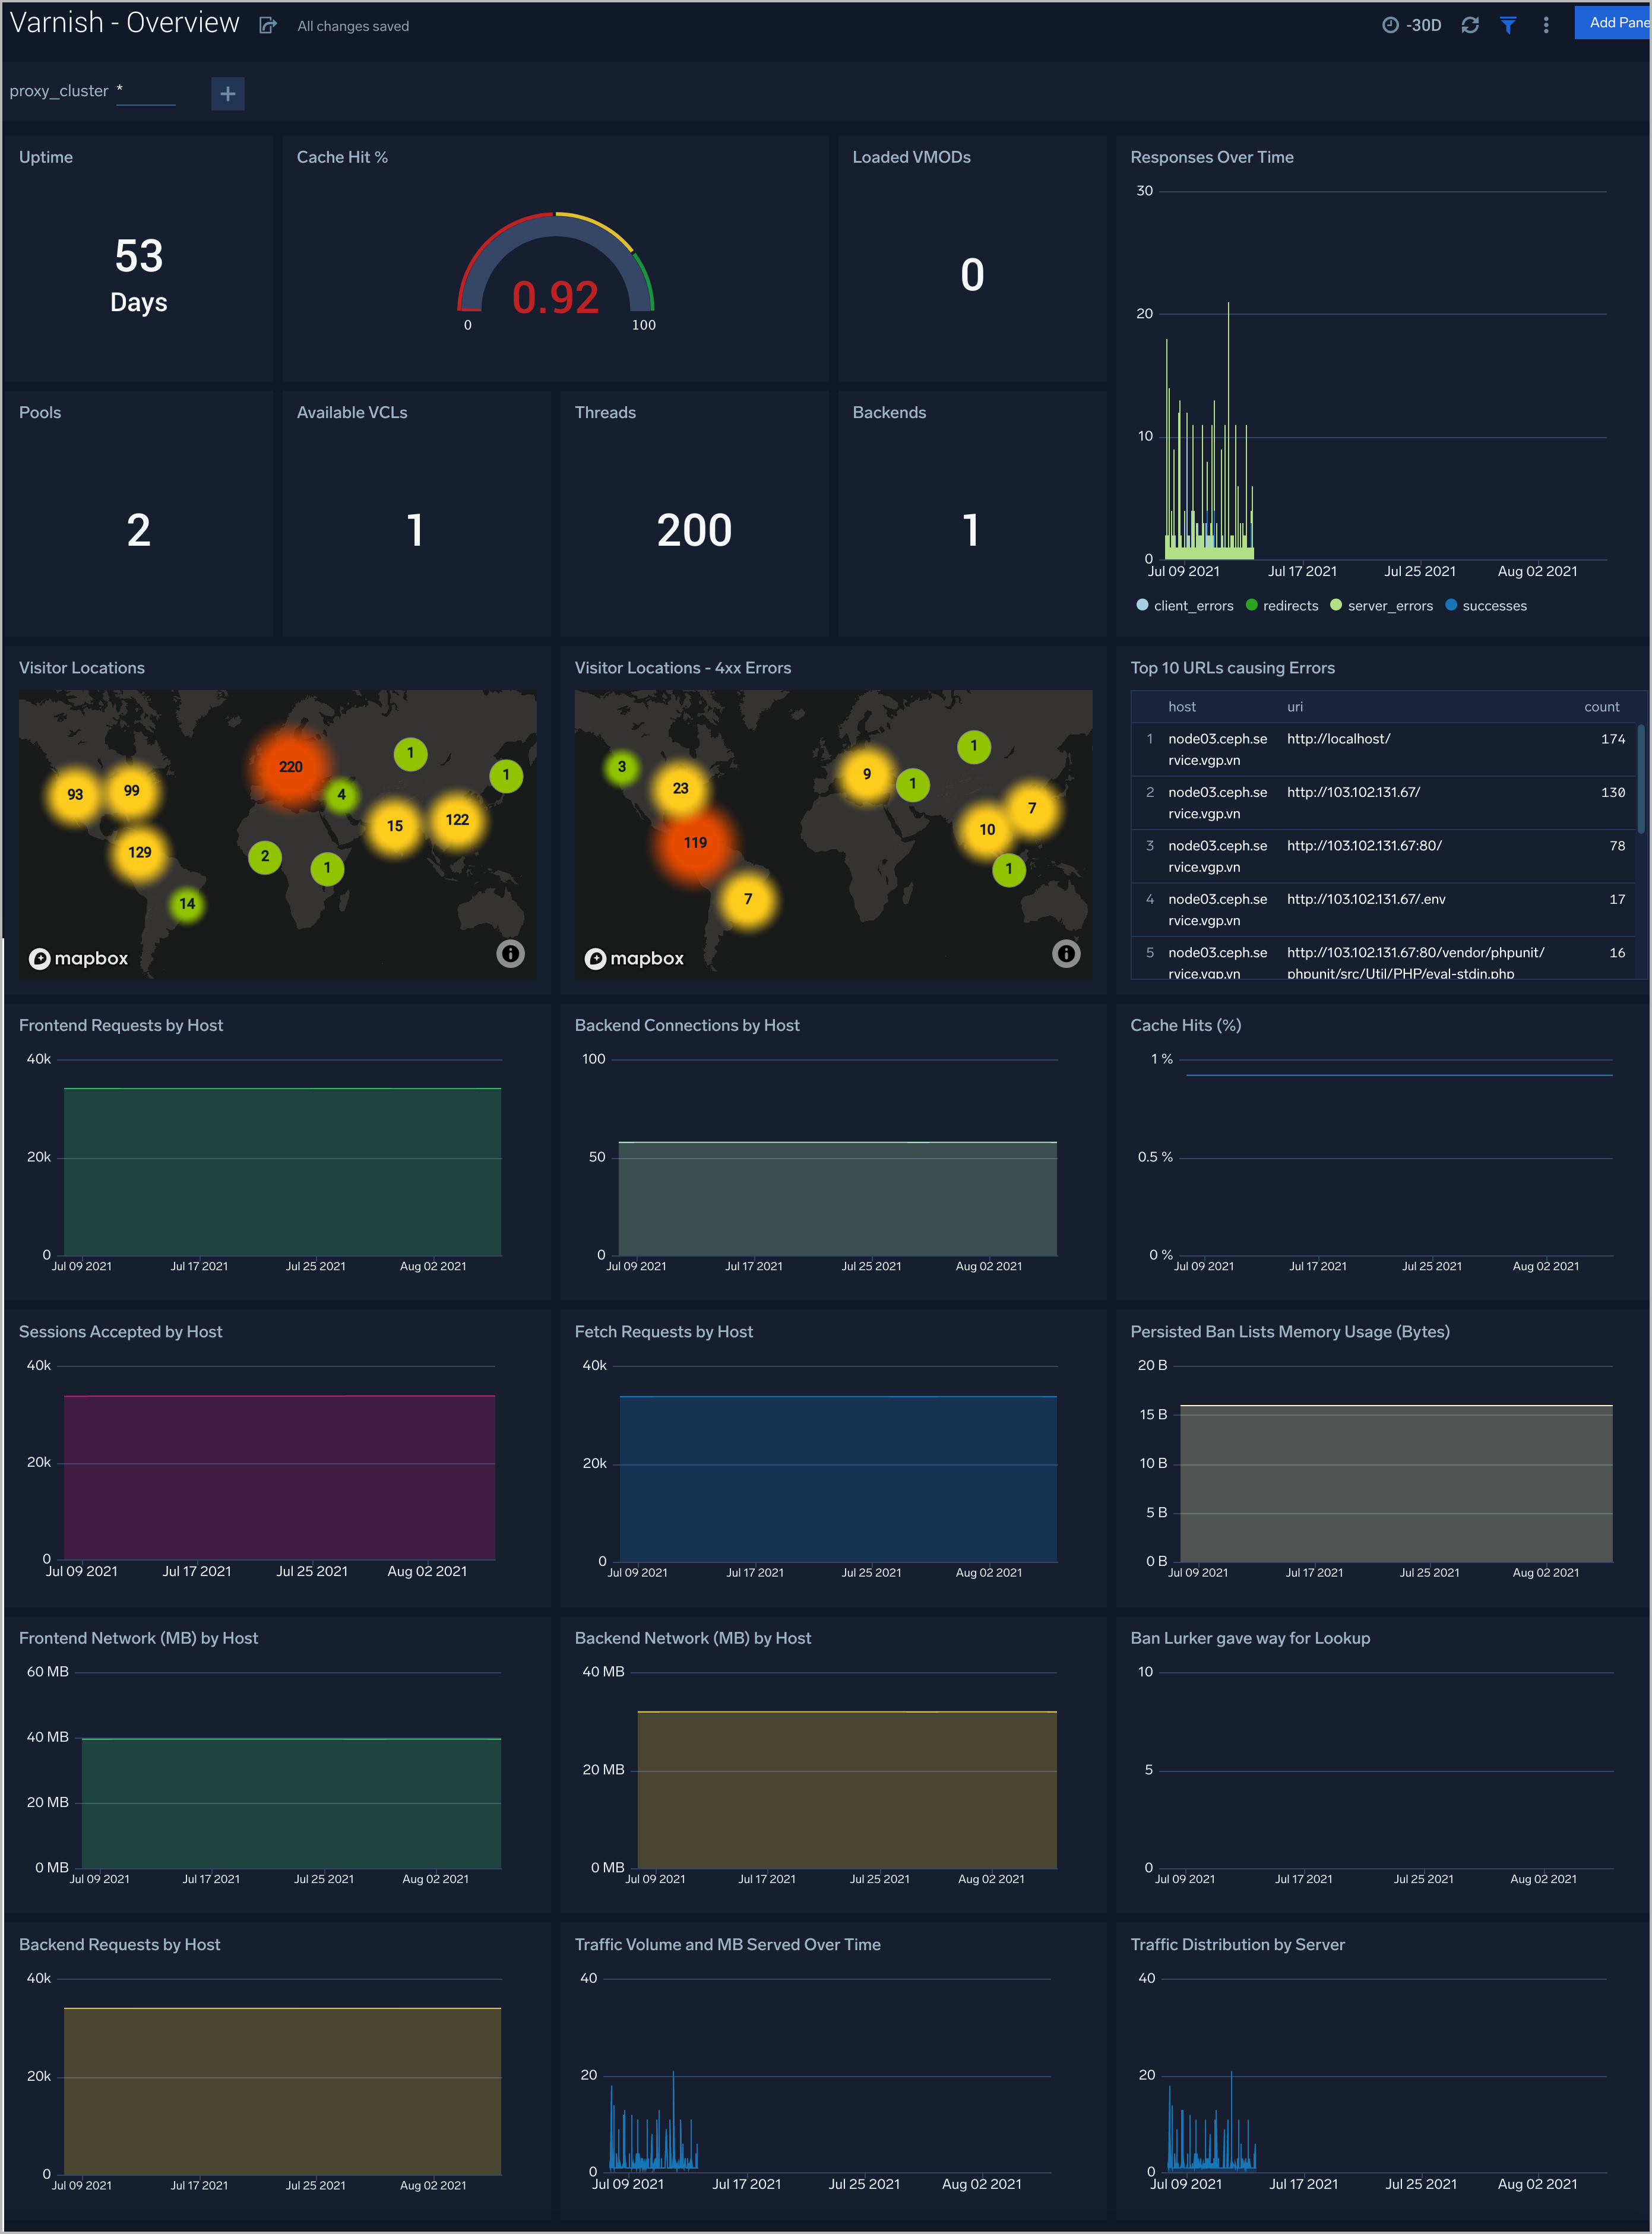
Overview
The Varnish (Classic) - Overview dashboard provides a high-level view of the activity and health of Varnish servers on your network. Dashboard panels display visual graphs and detailed information on visitor geographic locations, traffic volume and distribution, responses over time, and time comparisons for visitor locations and uptime, cache hit, requests, and VLC.
Use this dashboard to:
- Analyze Request backend, frontend, VLCs, Pool, Thread, VMODs, and cache hit rate.
- Analyze the HTTP request for the status code.
- Gain insights into Network traffic for your Varnish server.
- Gain insights into the origin of traffic location by region. This can help you allocate computer resources to different regions according to their needs.
- Gain insights into Client, Server Responses on Varnish Server. This helps you identify errors in the Varnish Server.
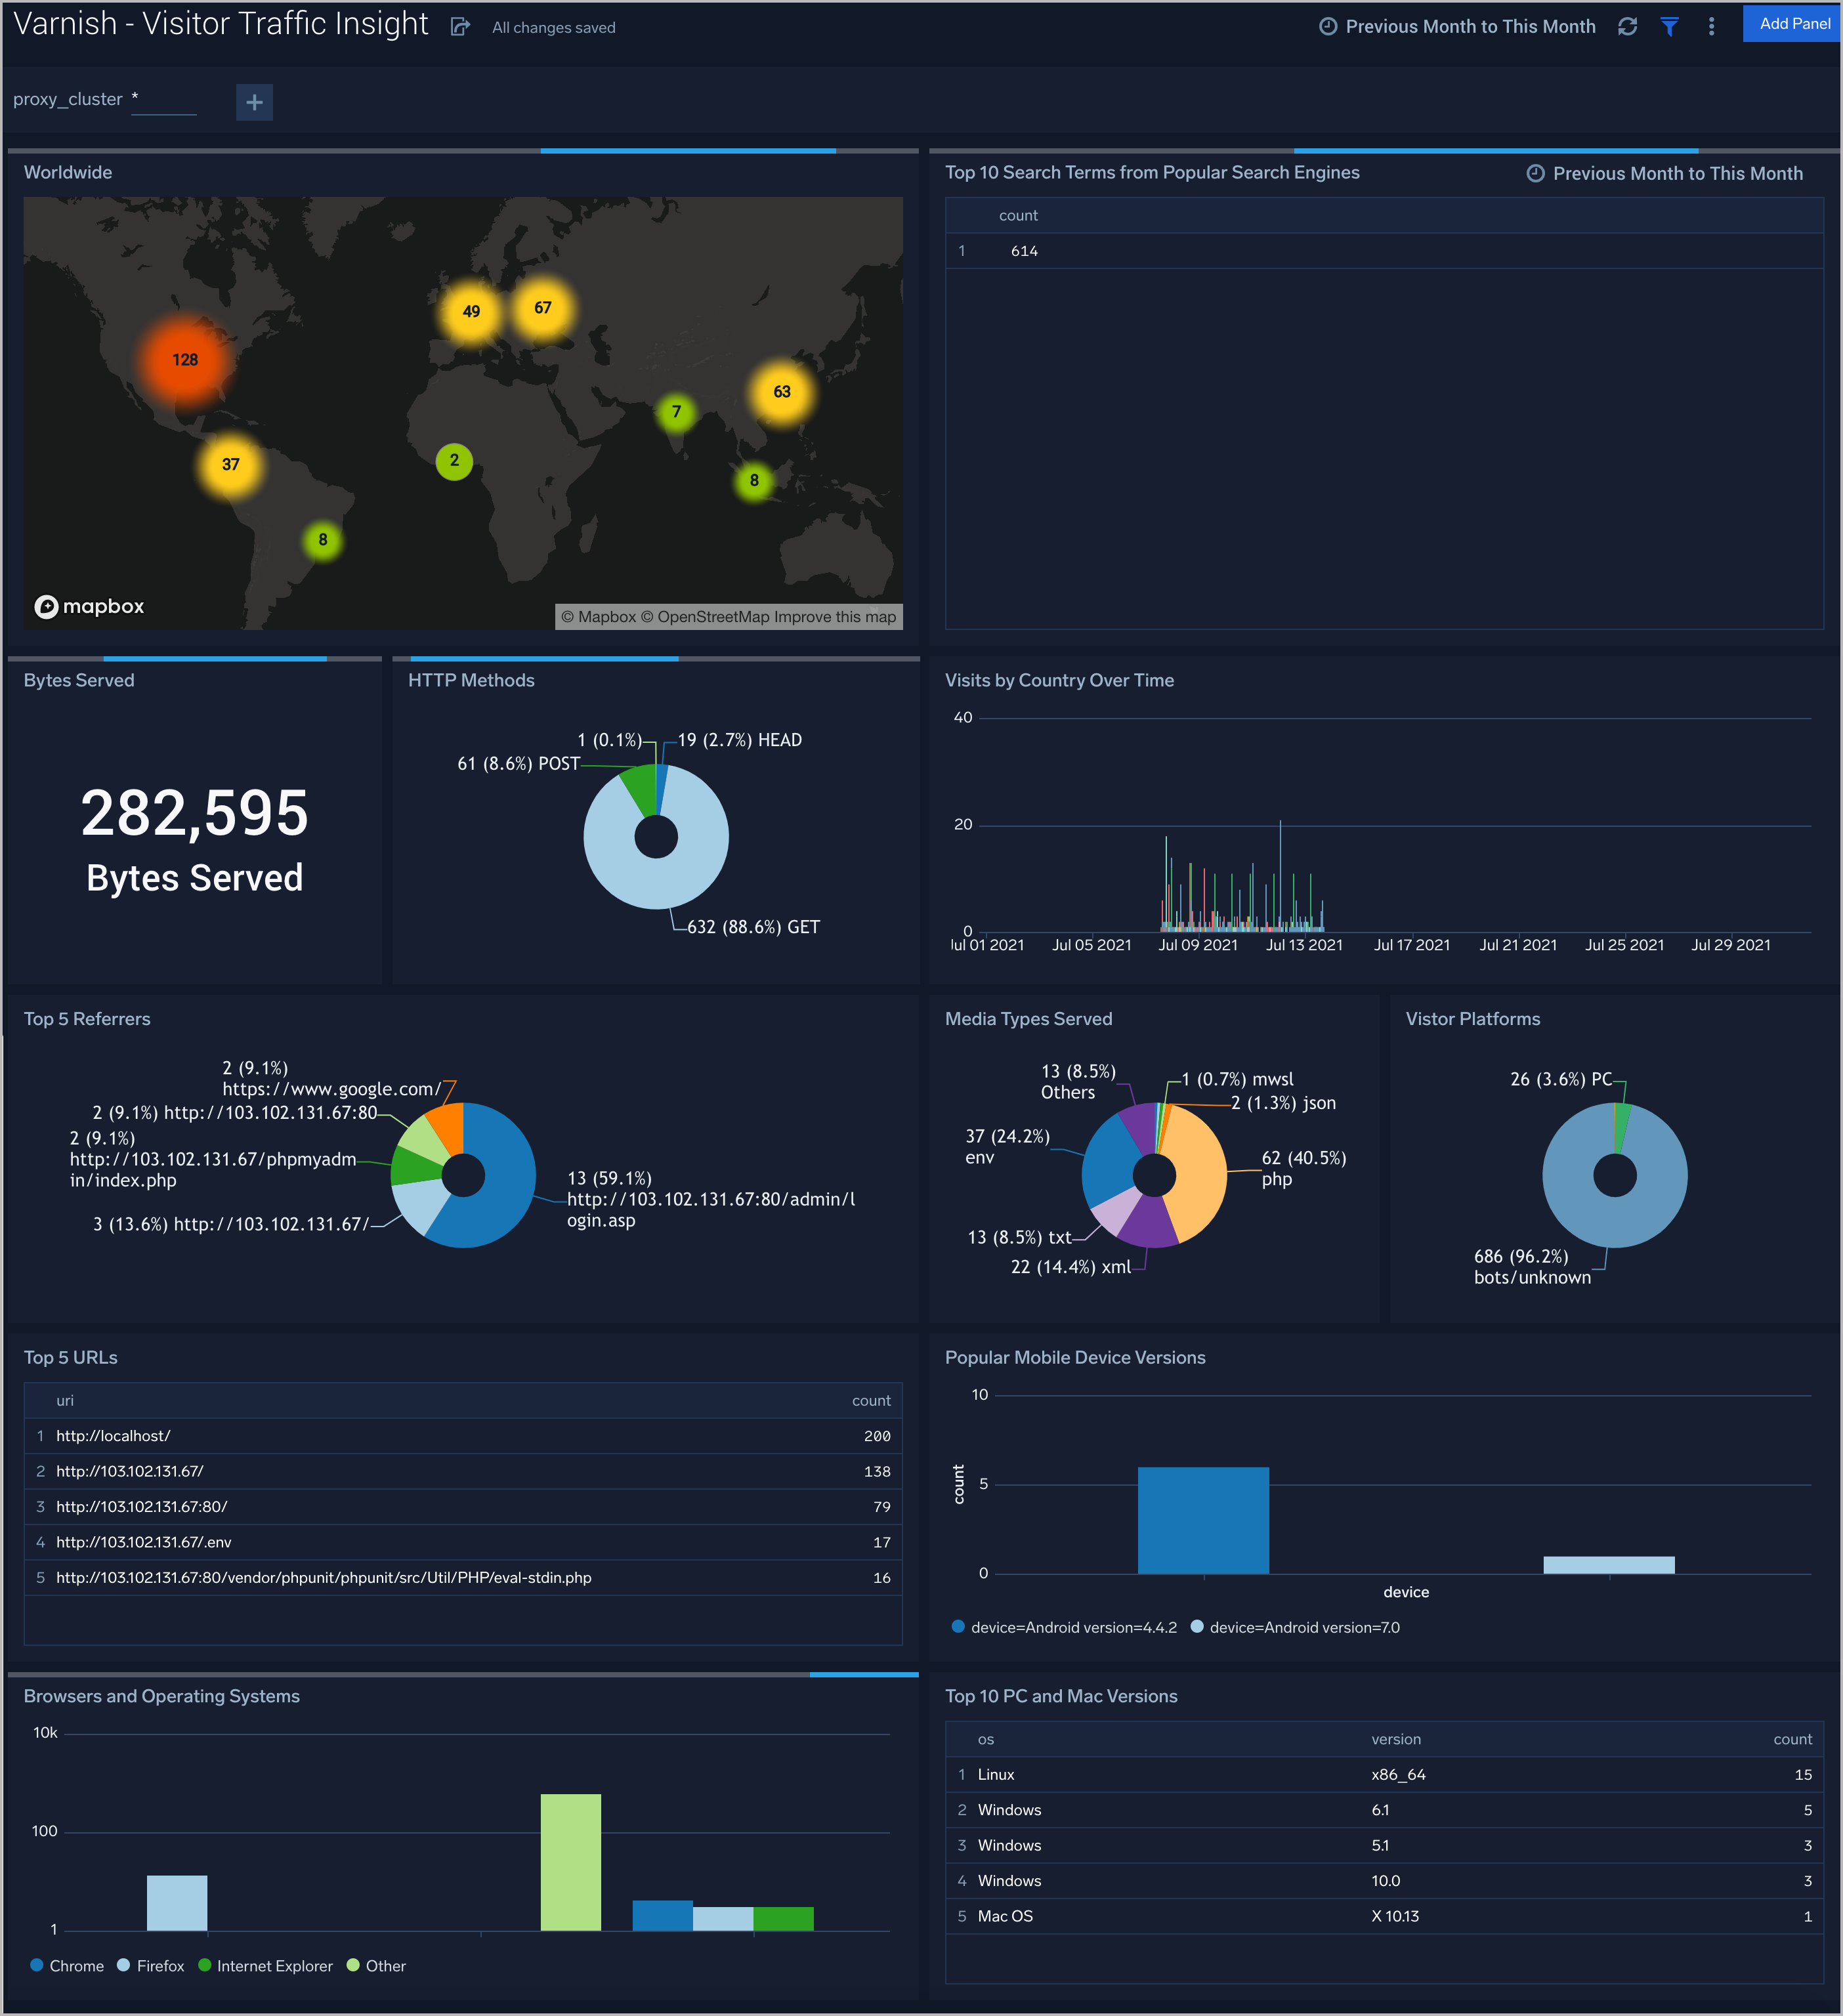
Visitor Traffic Insight
The Varnish (Classic) - Visitor Traffic Insight dashboard provides detailed information on the top documents accessed, top referrers, top search terms from popular search engines, and the media types served.
Use this dashboard to:
- Gain insights into visitor traffic.
- Identify top URLs visited.
- Determine visitor locations.
- Platforms, browsers, PC, Mac versions are used by the visitors to access.
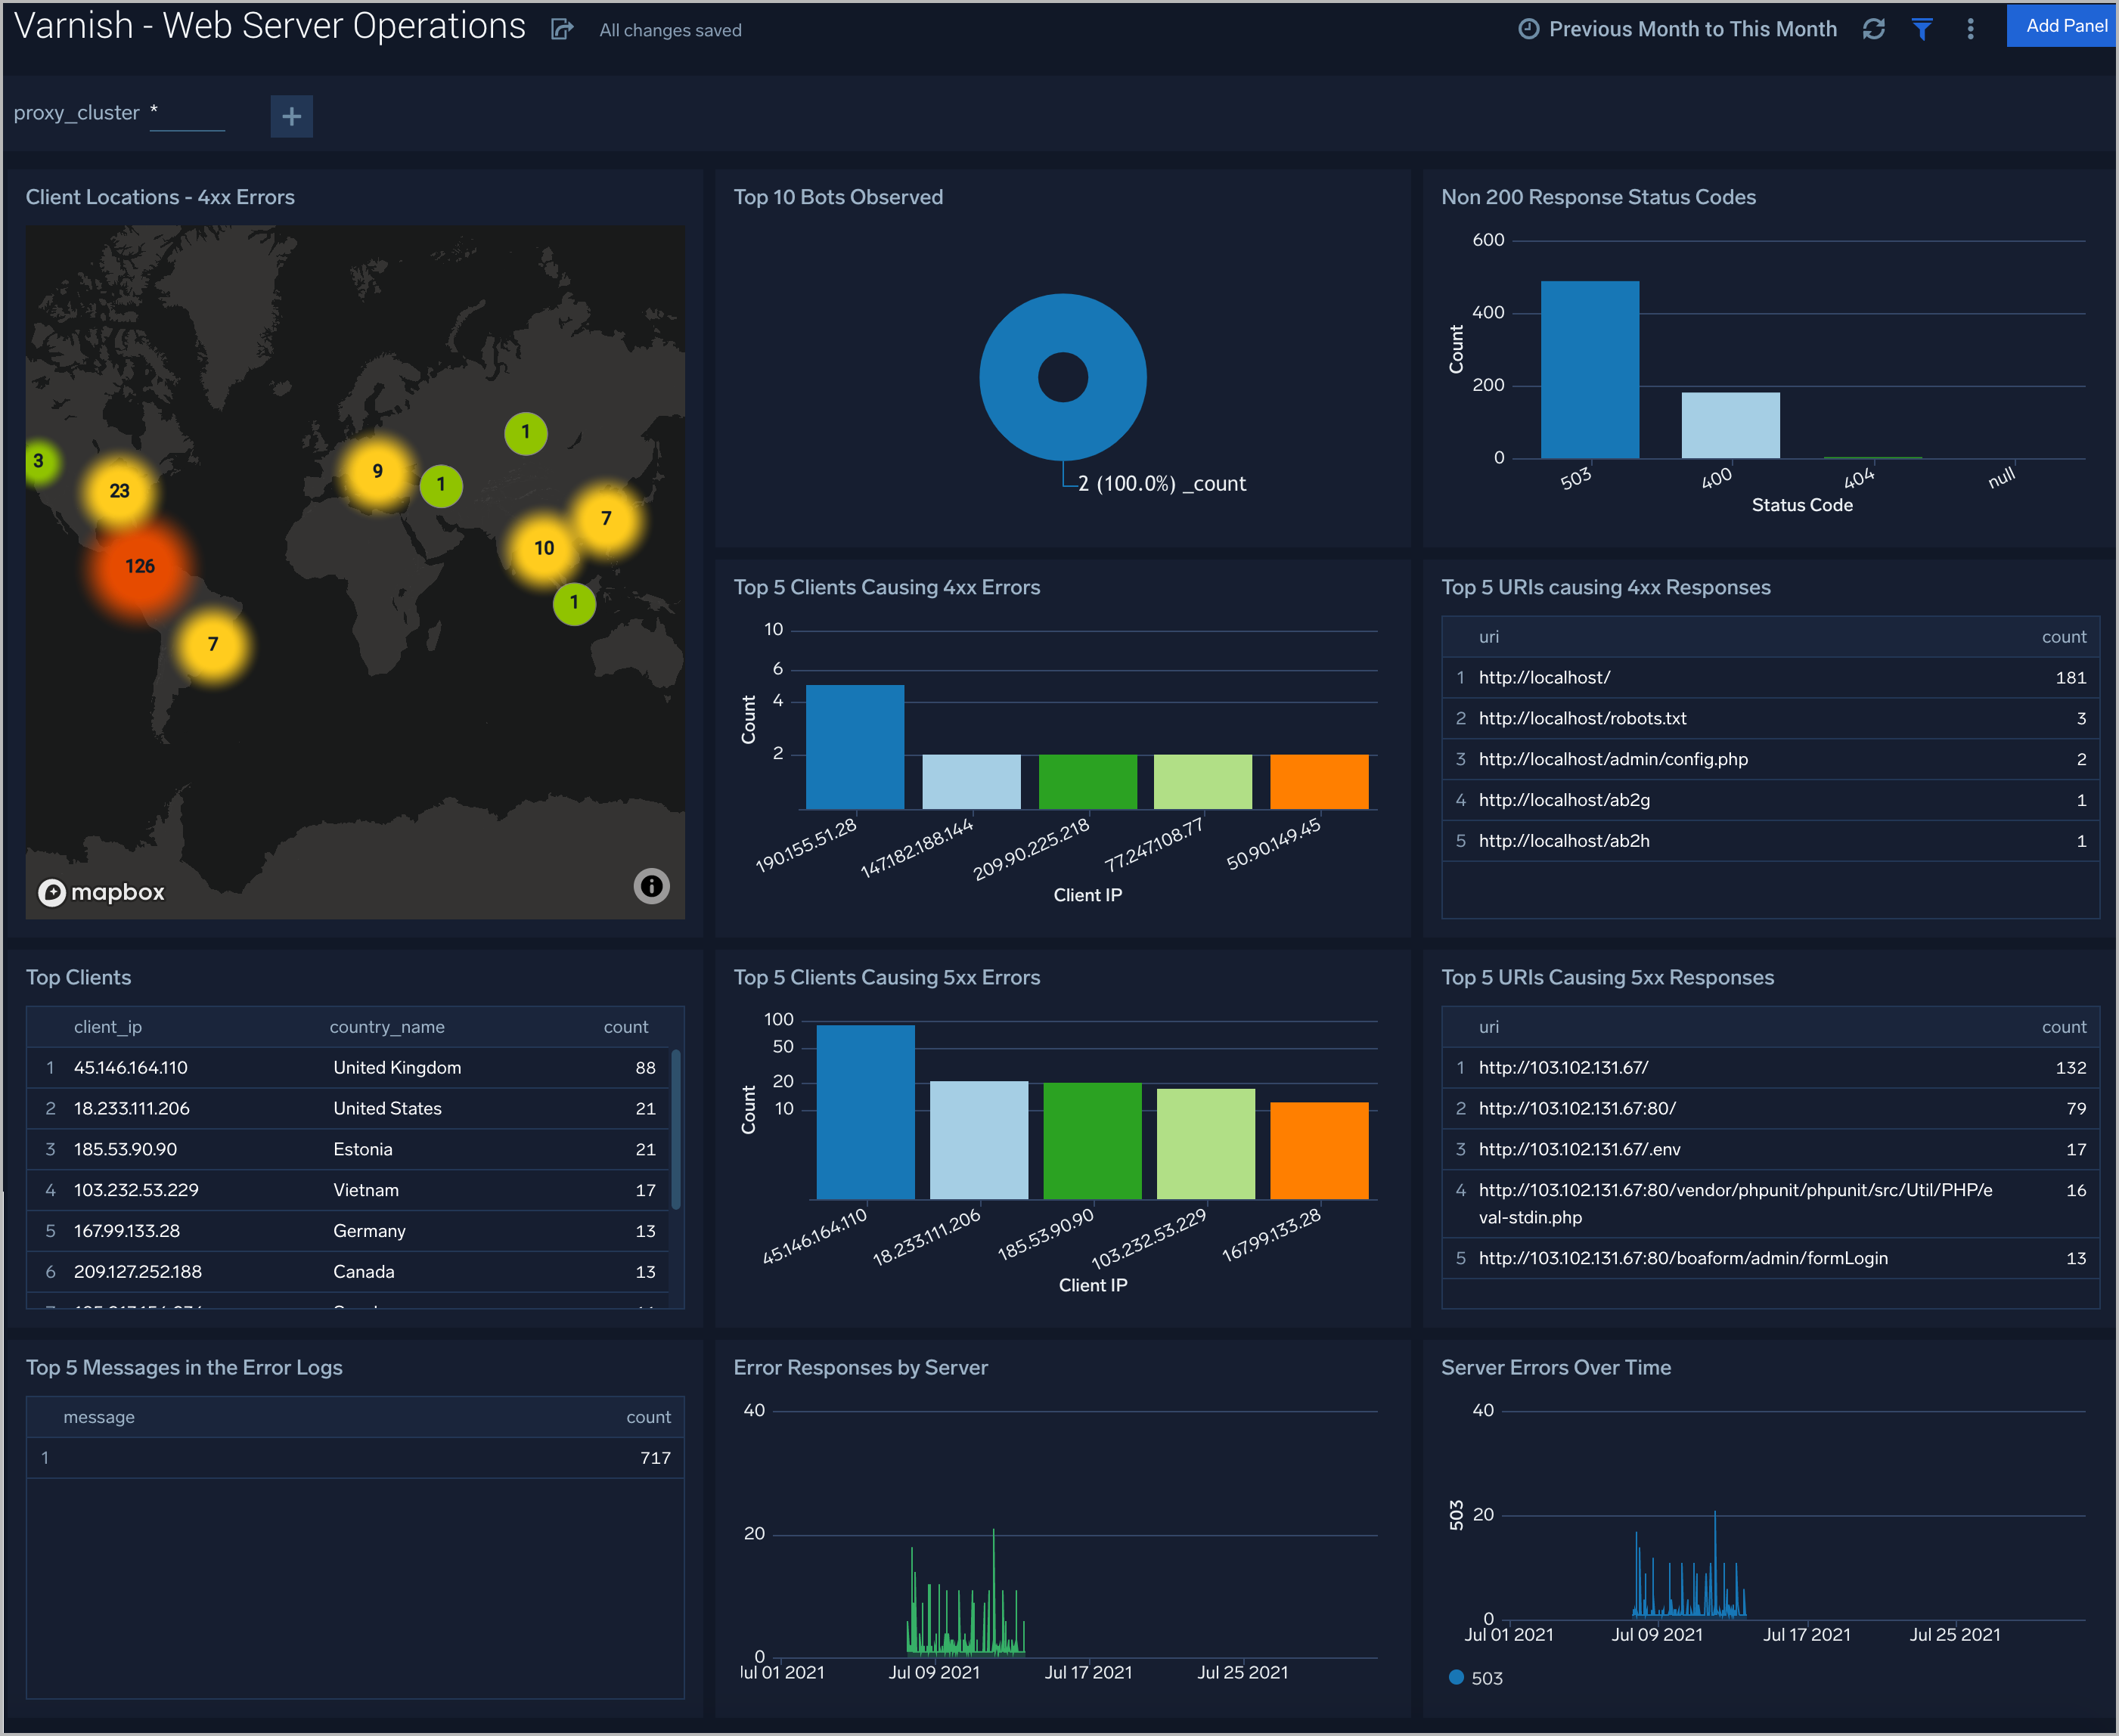
Web Server Operations
The Varnish (Classic) - Web Server Operations dashboard provides a high-level view combined with detailed information on the top ten bots, geographic locations, and data for clients with high error rates, server errors over time, and non-200 response code status codes. Dashboard panels also show server error logs, error log levels, error responses by the server, and the top URLs responsible for 404 responses.
Use this dashboard to:
- Determine failures in responding.
- Identify visitor locations with 4xx errors.
- Gain insights into Clients causing a lot of 4xx errors.
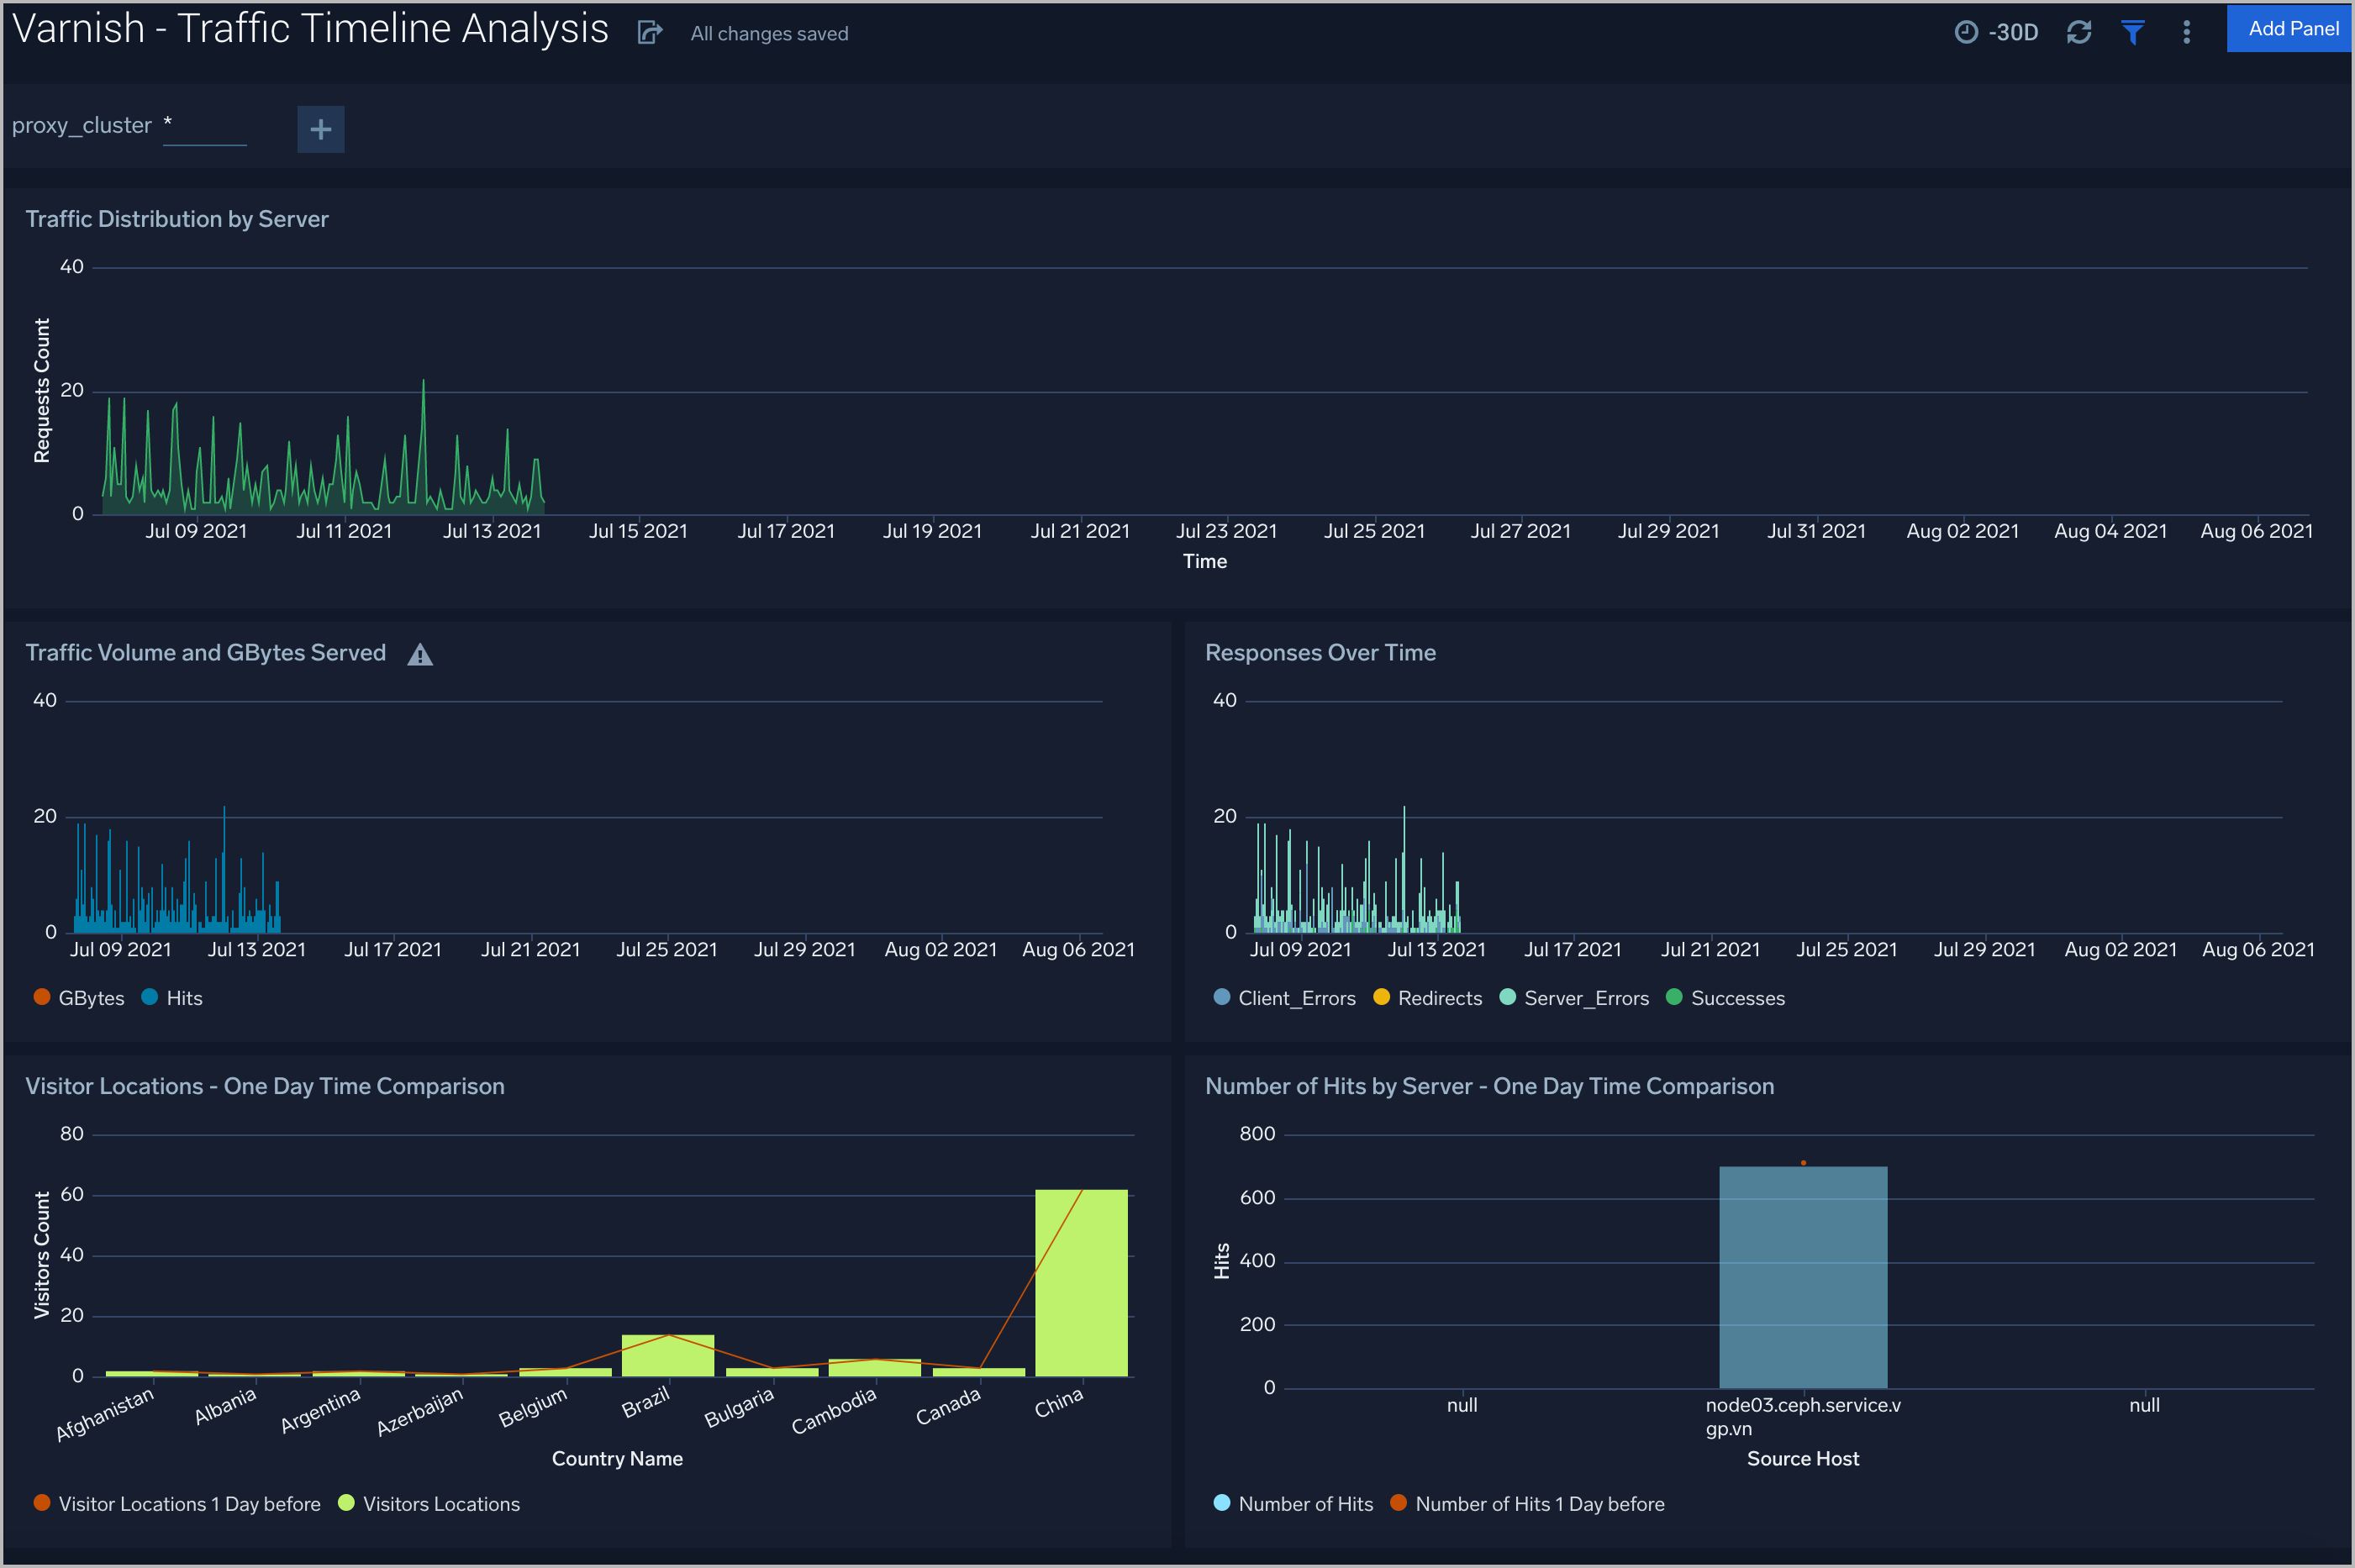
Traffic Timeline Analysis
The Varnish (Classic) - Traffic Timeline Analysis dashboard provides a high-level view of the activity and health of Varnish servers on your network. Dashboard panels display visual graphs and detailed information on traffic volume and distribution, responses over time, as well as time comparisons for visitor locations and server hits.
Use this dashboard to:
- To understand the traffic distribution across servers, provide insights for resource planning by analyzing data volume and bytes served.
- Gain insights into the origin of traffic location by region. This can help you allocate compute resources to different regions according to their needs.
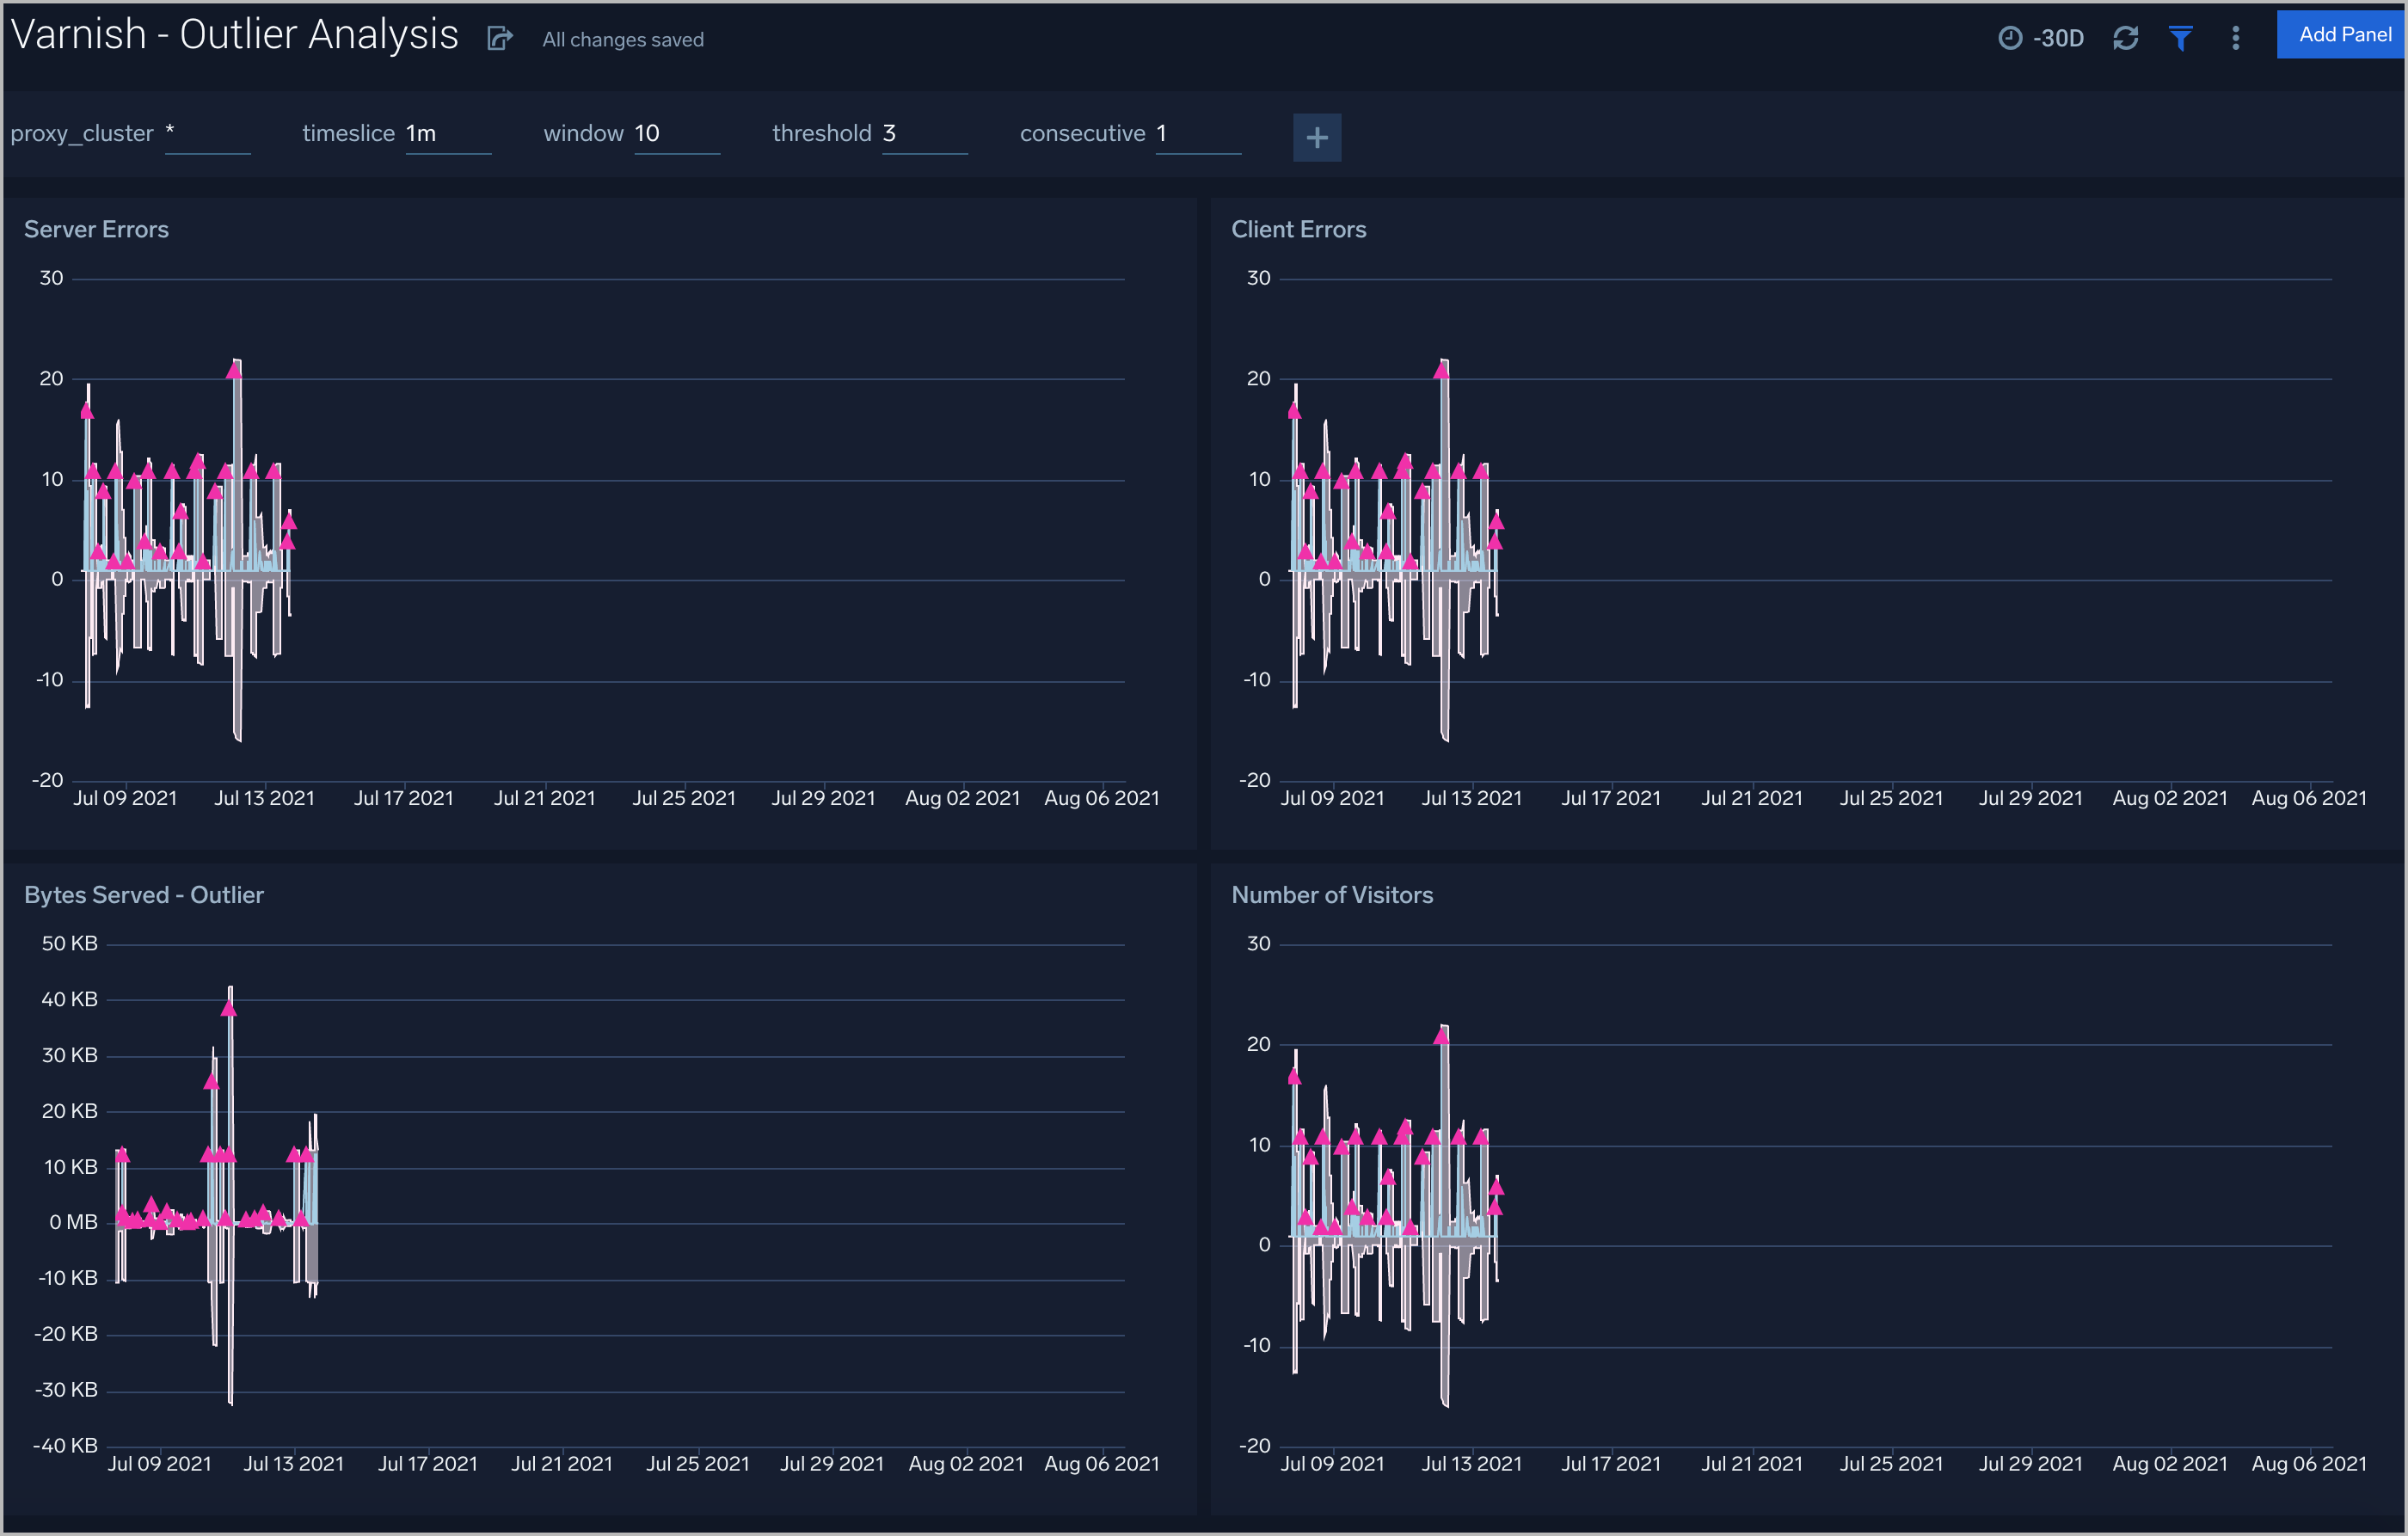
Outlier Analysis
The Varnish (Classic) - Outlier Analysis dashboard provides a high-level view of Varnish server outlier metrics for bytes served, the number of visitors, and server errors. You can select the time interval over which outliers are aggregated, then hover the cursor over the graph to display detailed information for that point in time.
Use this dashboard to:
- Detect outliers in your infrastructure with Sumo Logic’s machine learning algorithm.
- To identify outliers in incoming traffic and the number of errors encountered by your servers.
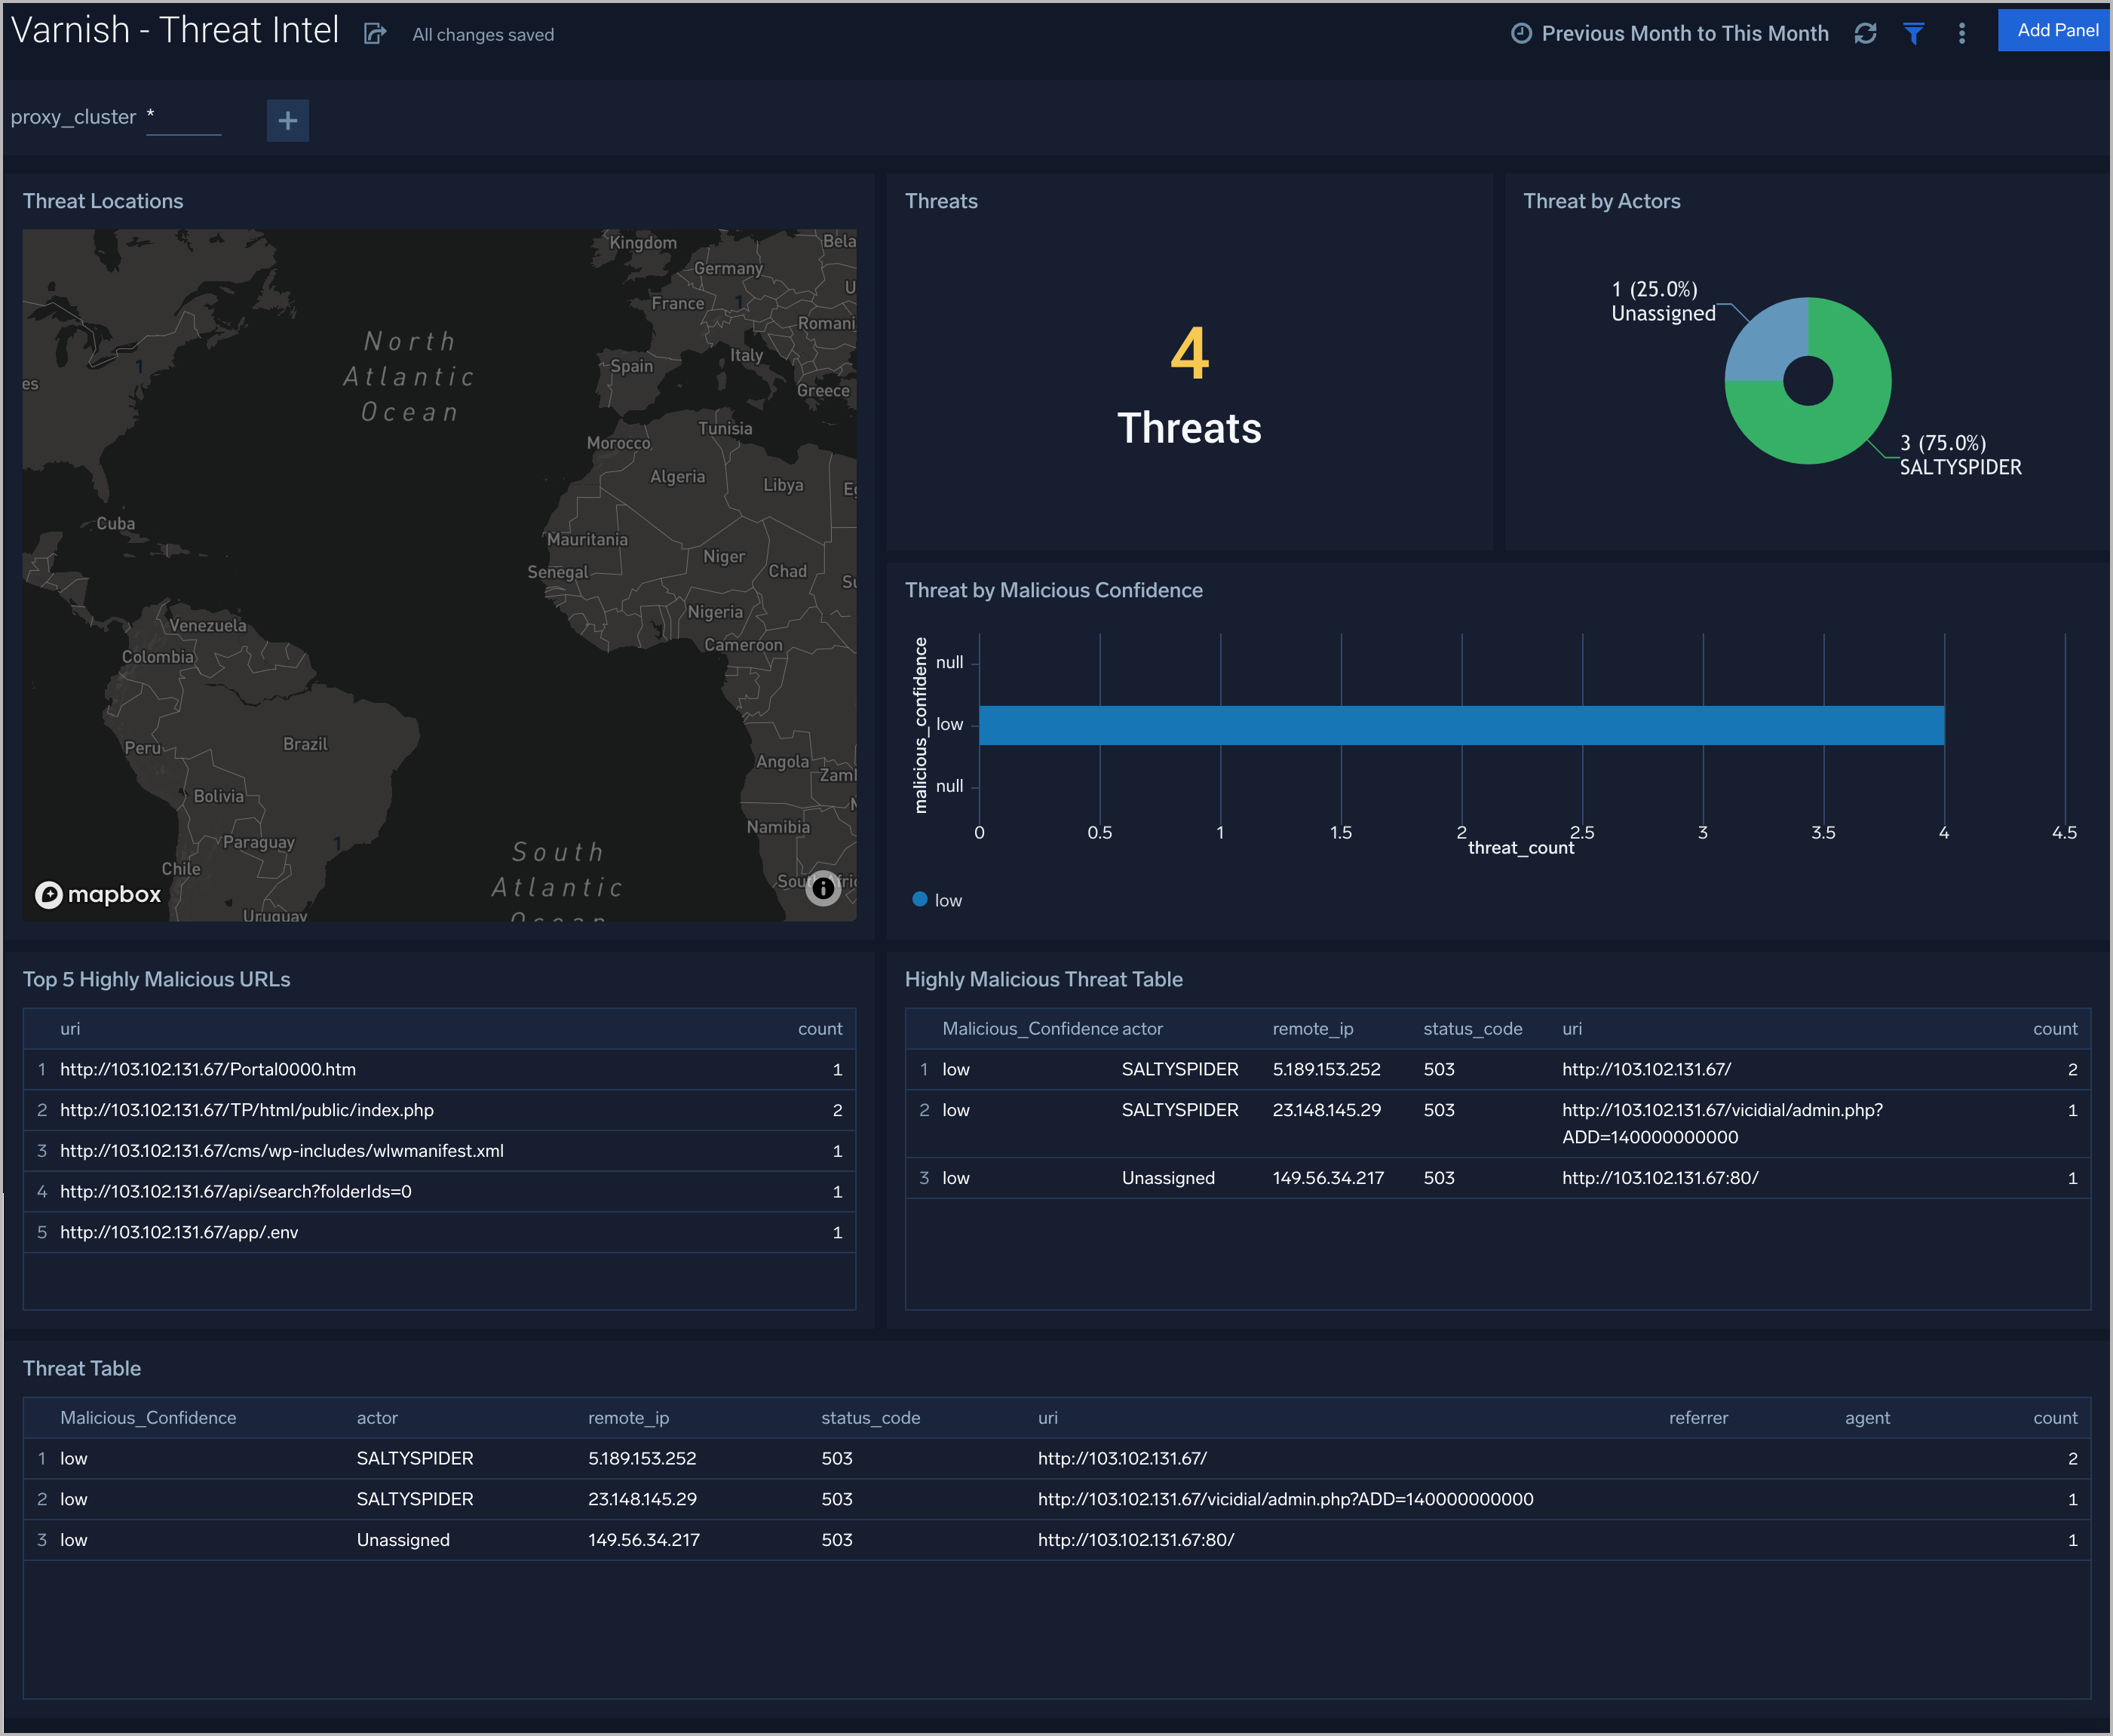
Threat Intel
The Varnish (Classic) - Threat Intel dashboard provides an at-a-glance view of threats to Varnish servers on your network. Dashboard panels display threat count over a selected time period, geographic locations where threats occurred, source breakdown, actors responsible for threats, severity, and a correlation of IP addresses, method, and status code of threats.
Use this dashboard to:
- To gain insights and understand threats in incoming traffic and discover potential IOCs.
- Incoming traffic requests are analyzed using Sumo Logic threat intelligence.
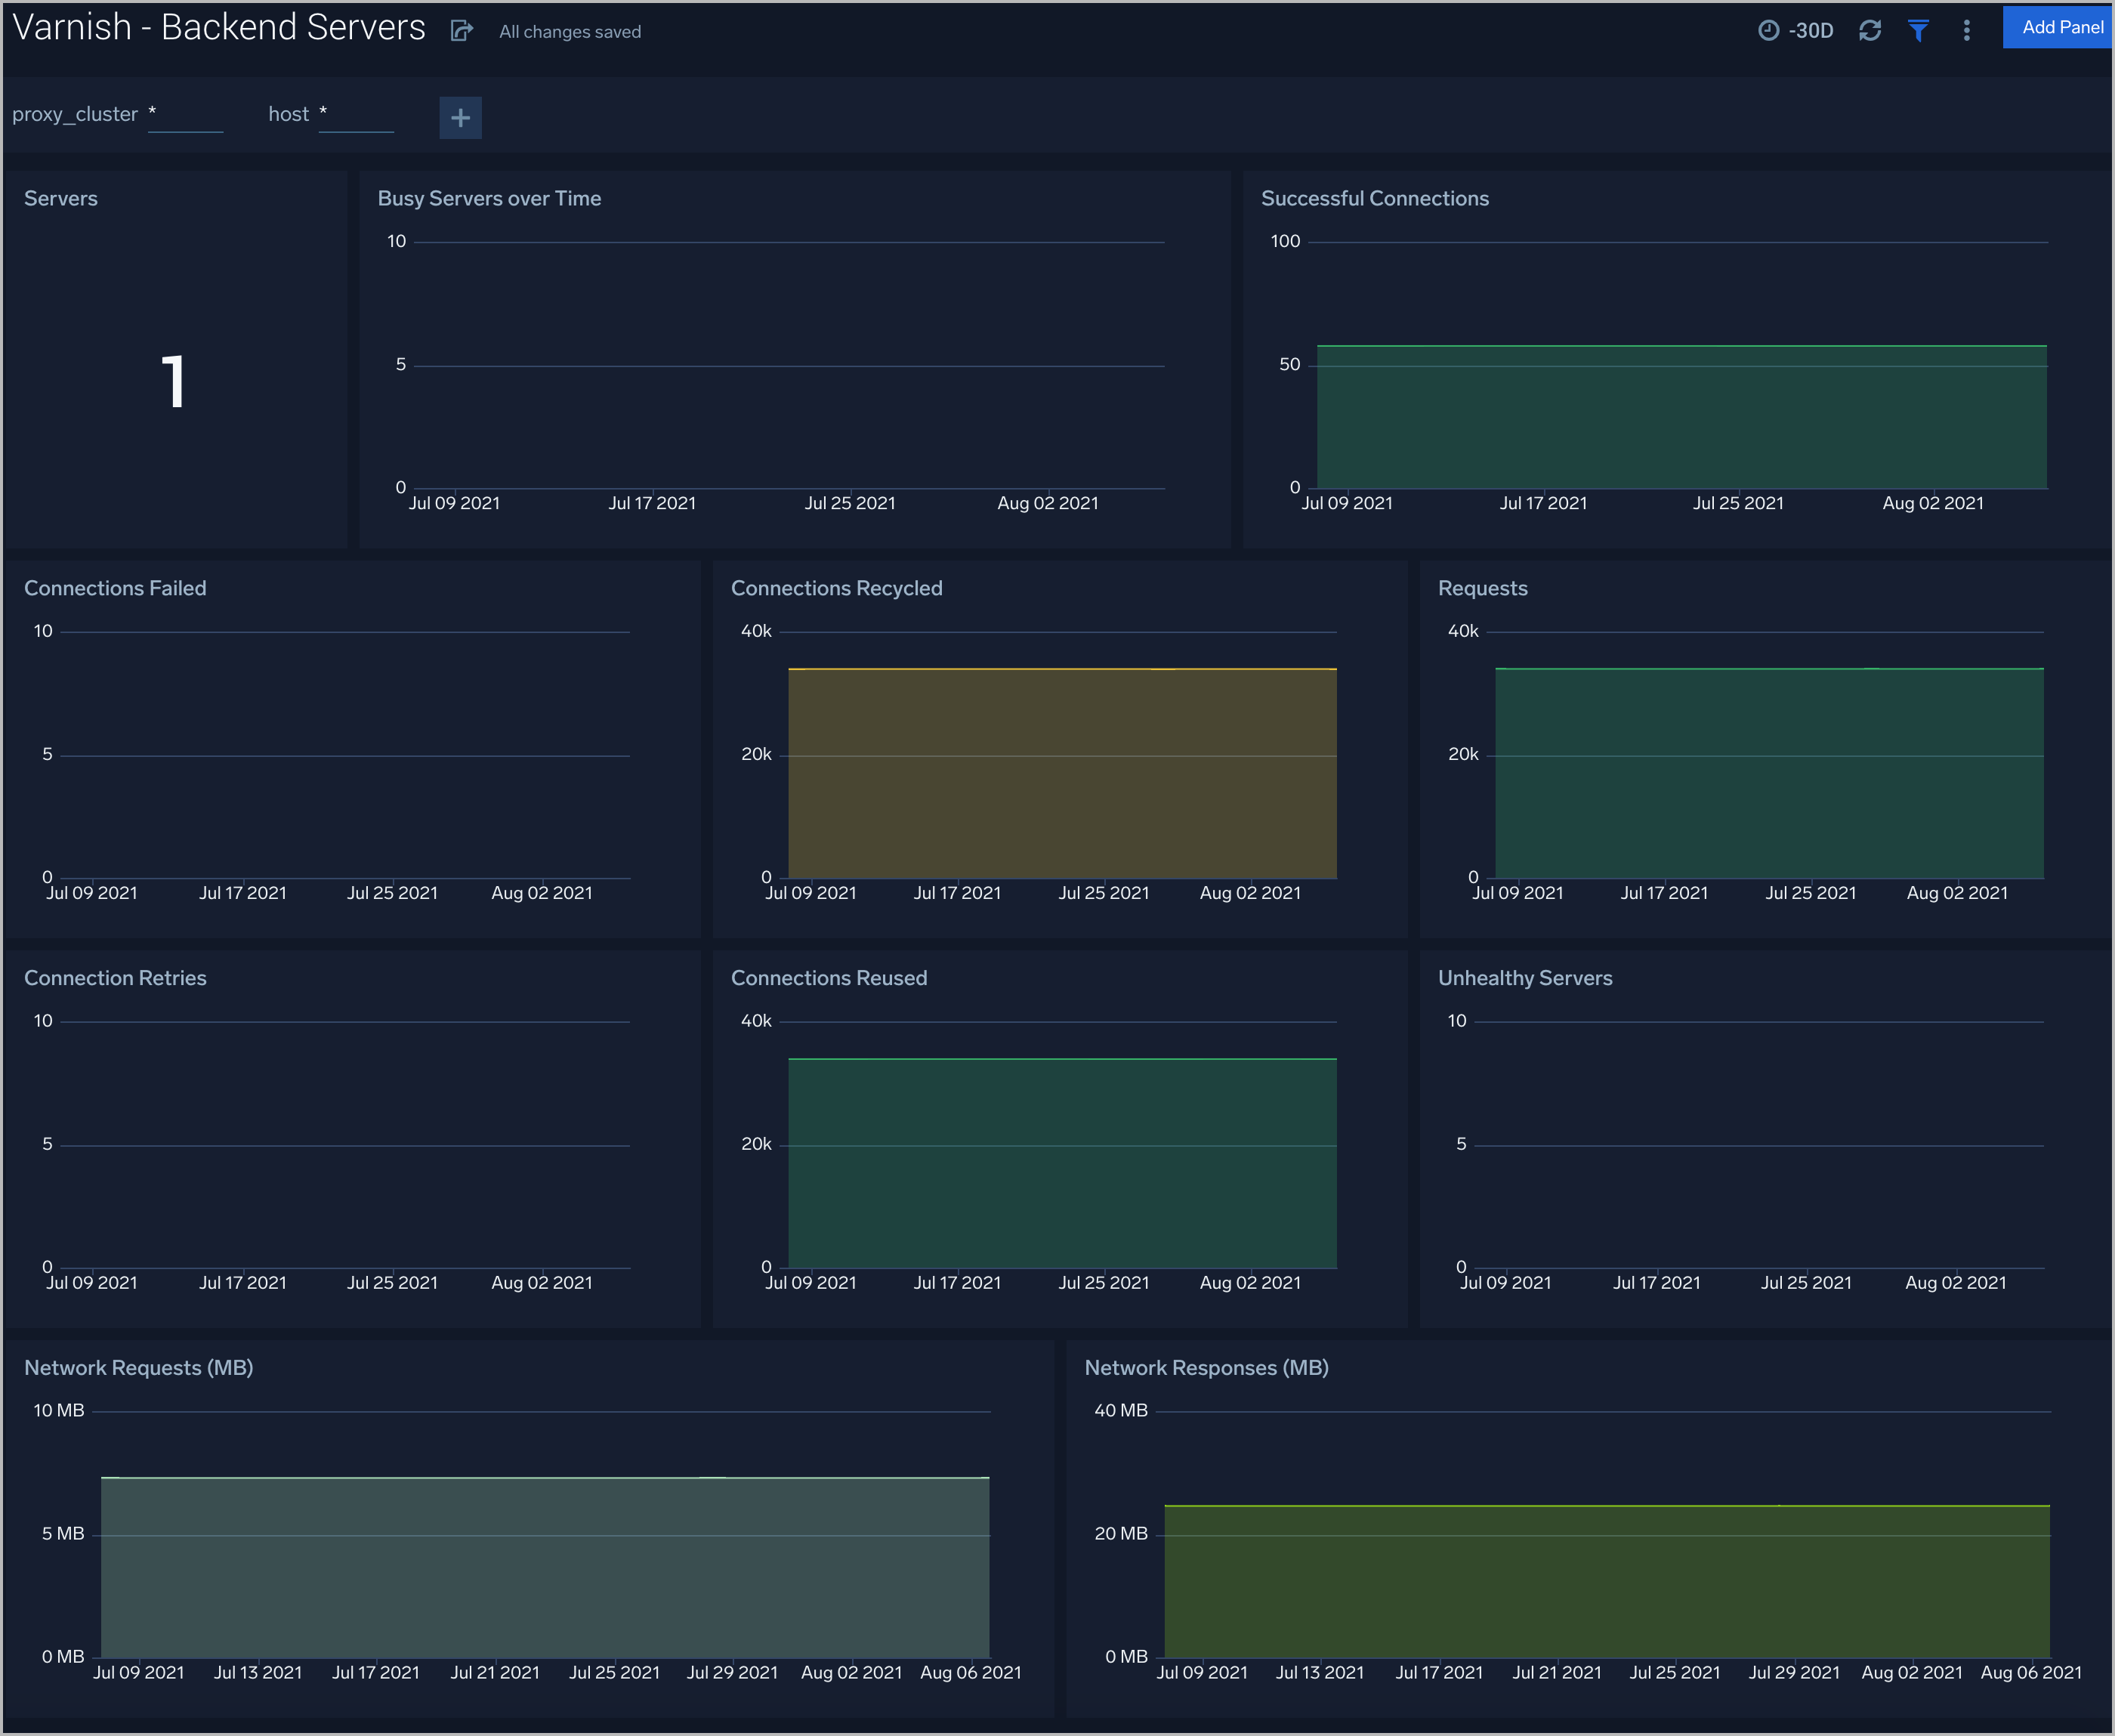
Backend Servers
The Varnish (Classic) - Backend Servers dashboard provides several metrics that describe the communication between Varnish and its backend servers.
Use this dashboard to:
- Review and manage the health of backend and frontend communication.
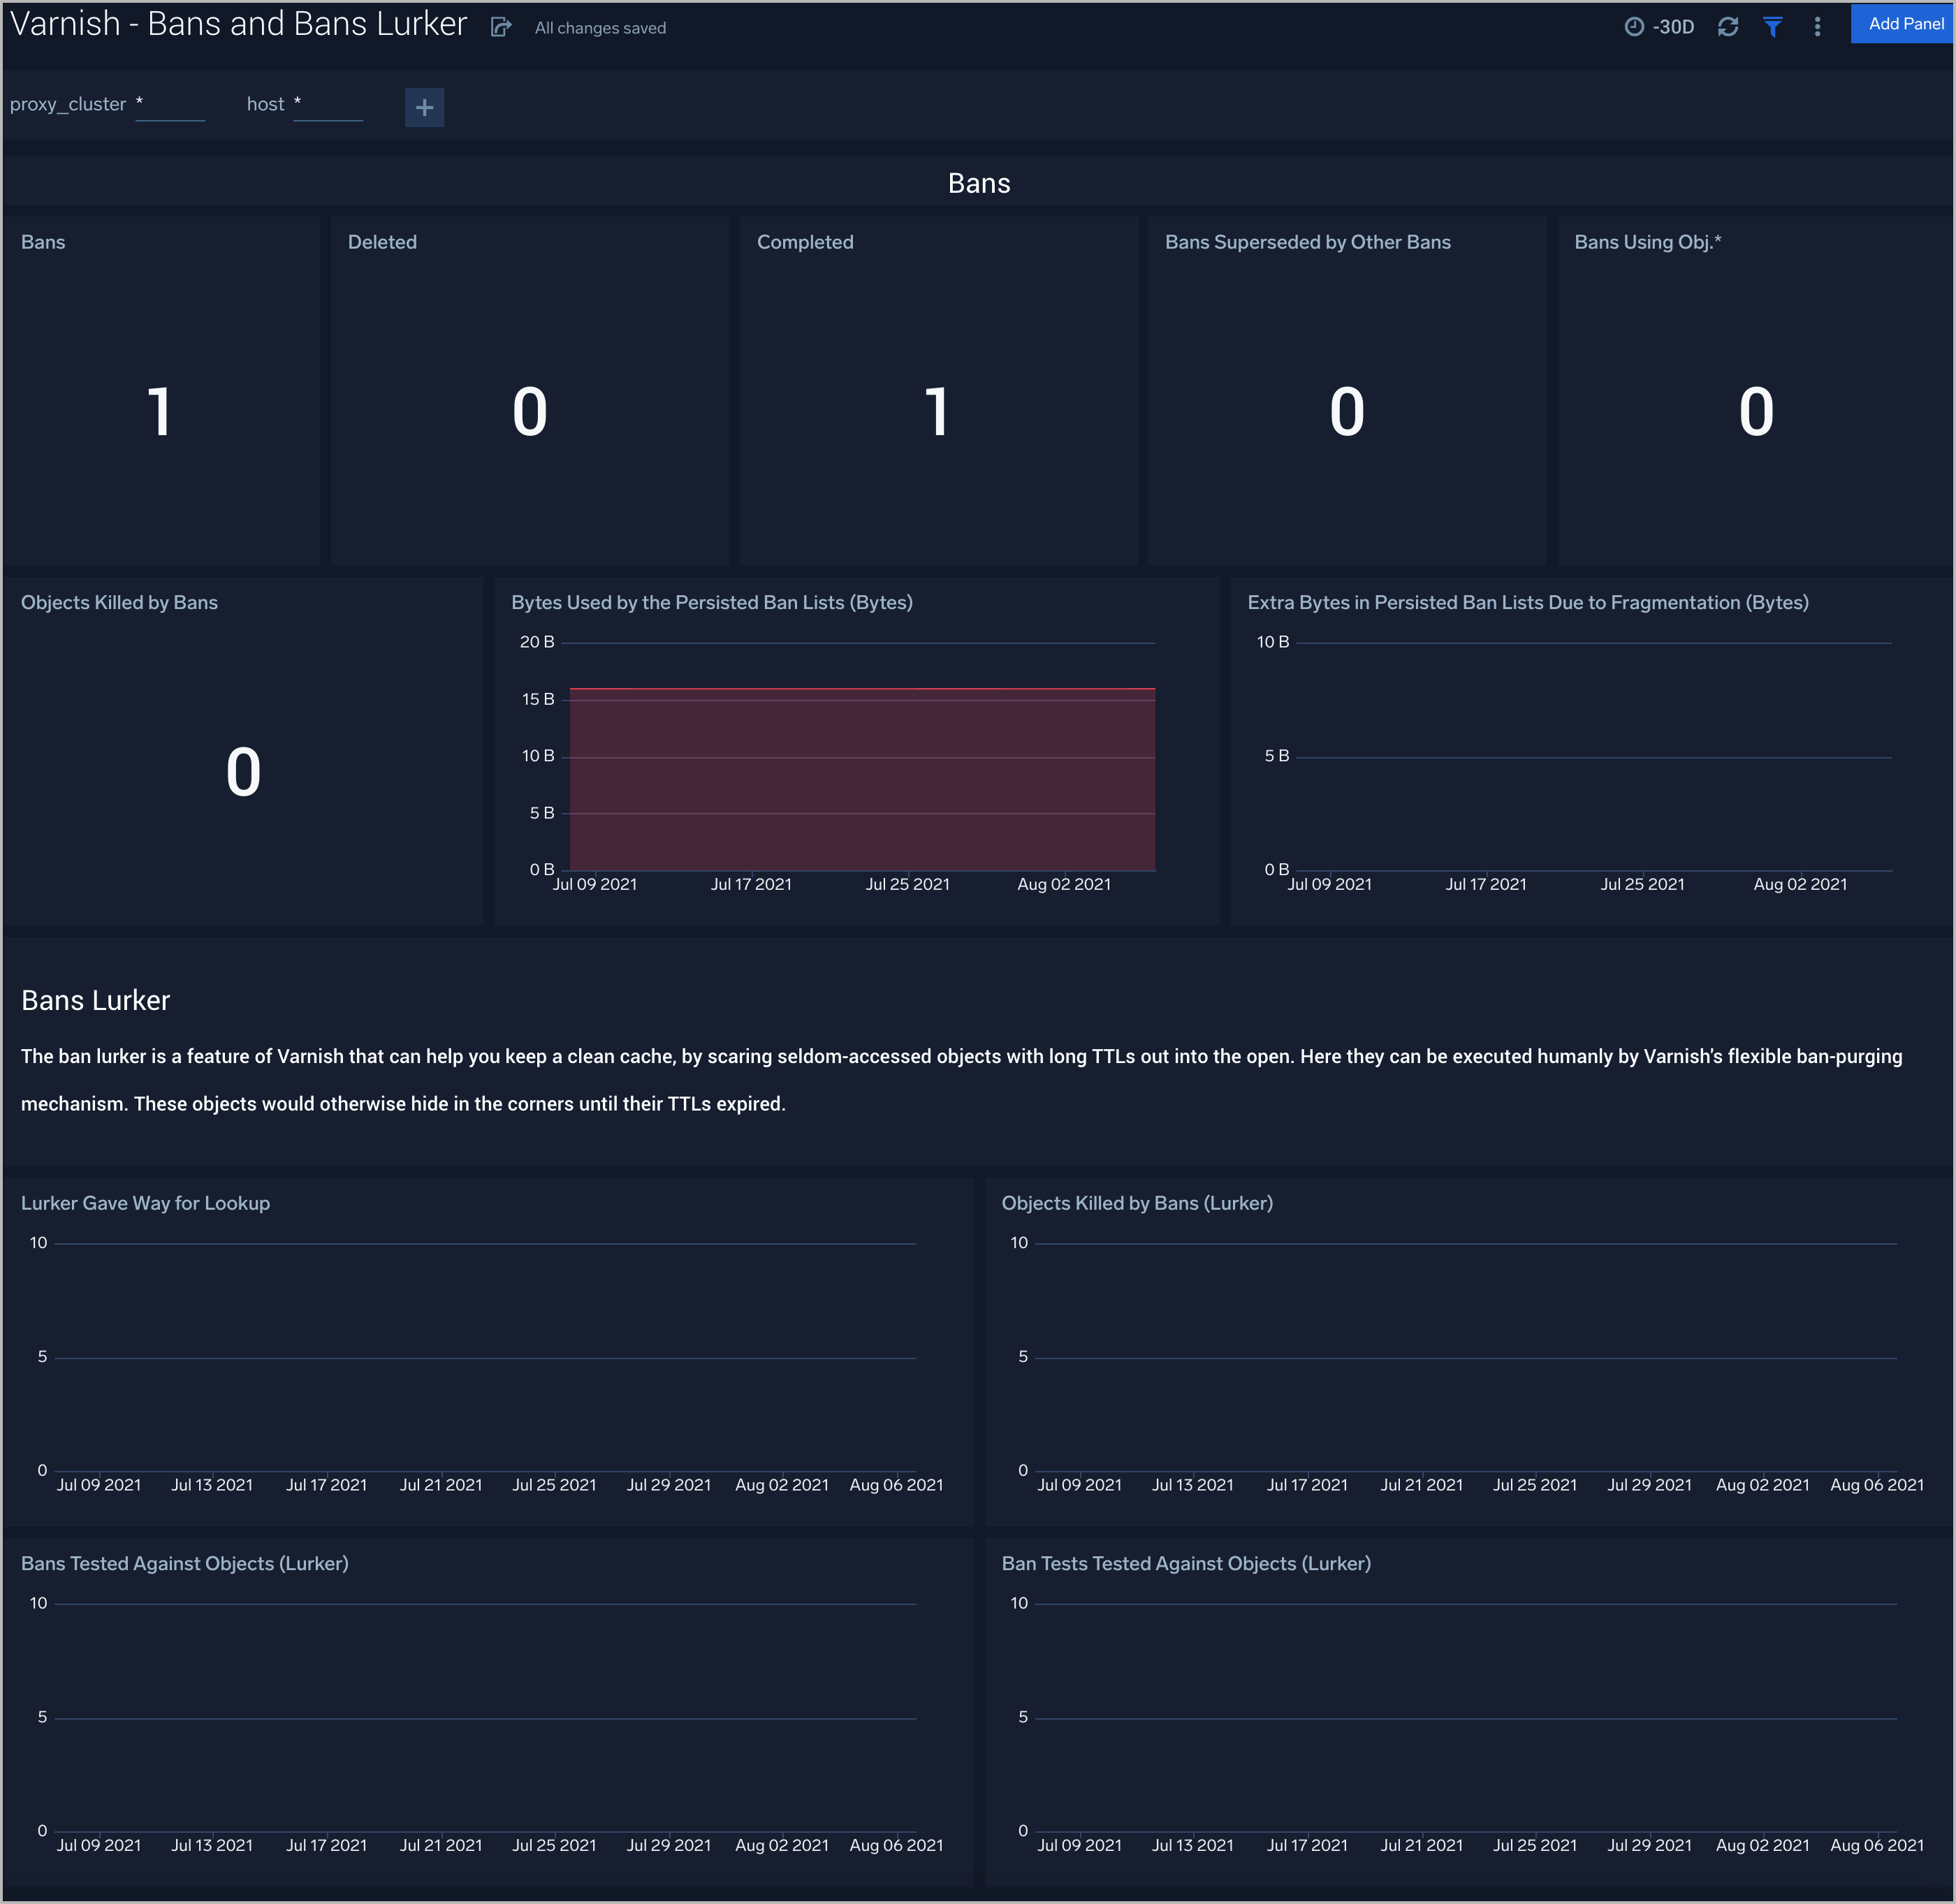
Bans and Bans Lurker
The Varnish (Classic) - Bans and Bans Lurker dashboard provides you with the list of Bans filters applied to keep Varnish from serving stale content.
Use this dashboard to:
- Gain insights into bans and make sure that Varnish is serving the latest content.
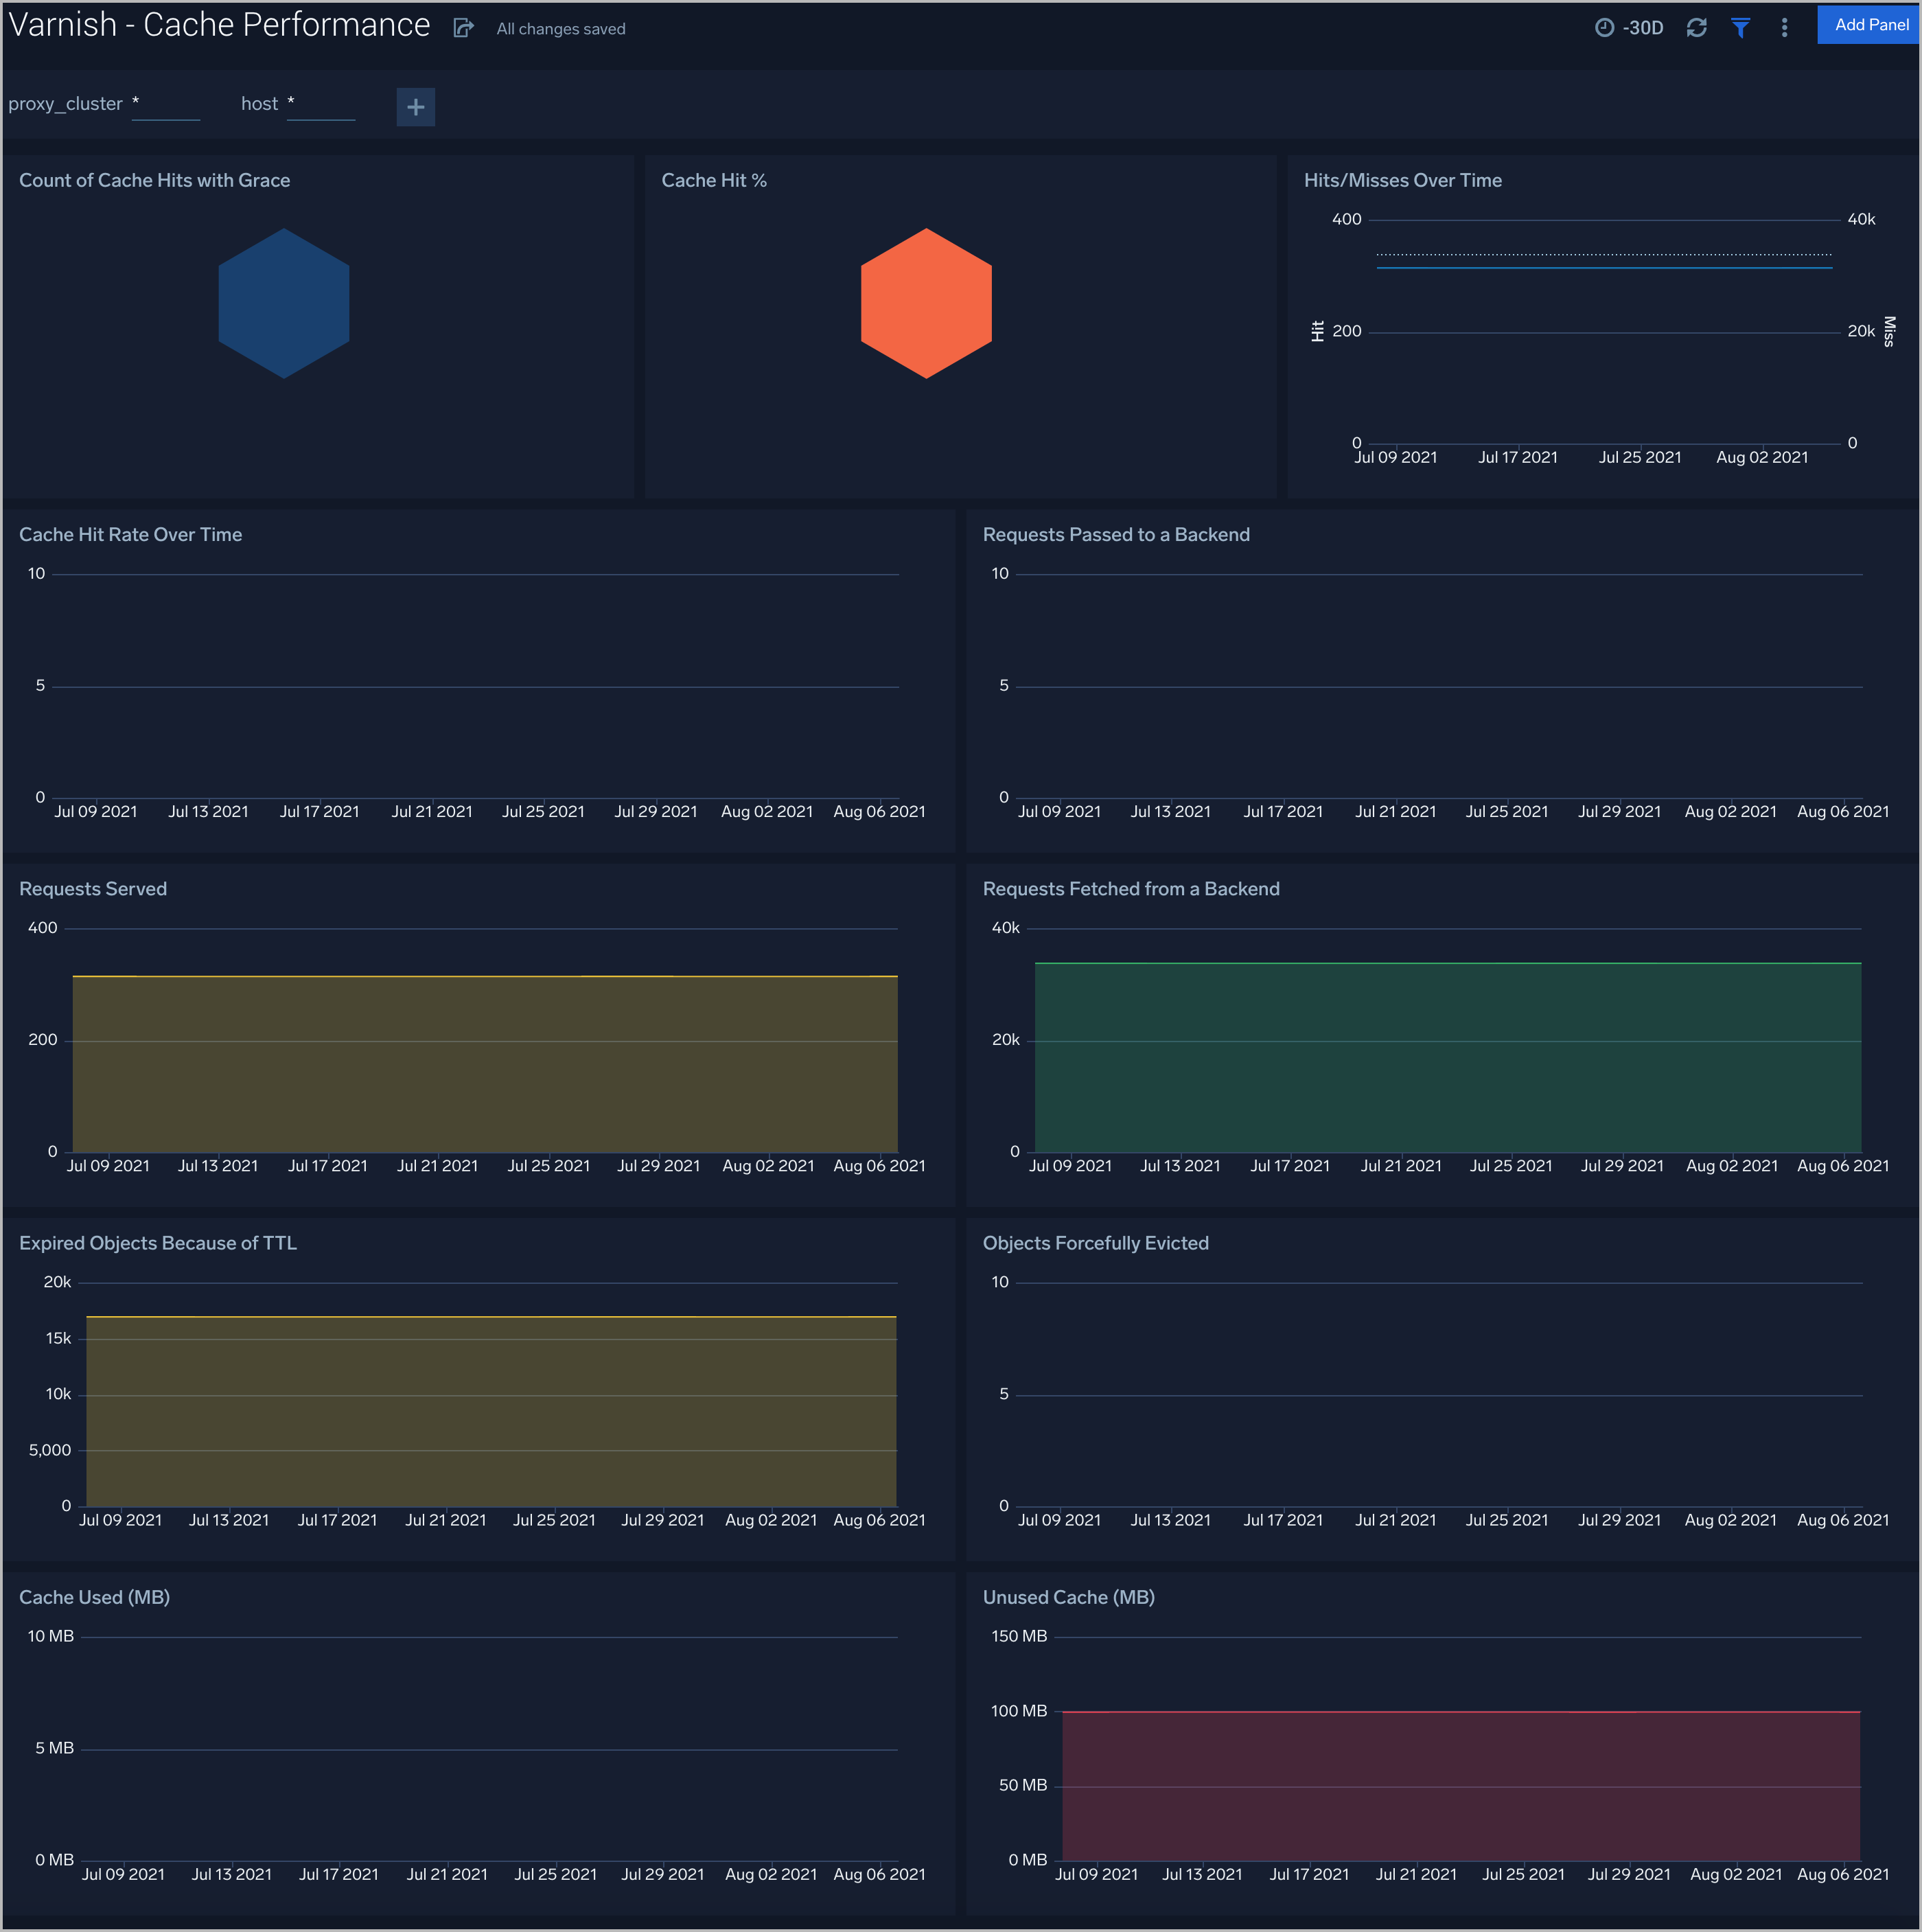
Cache Performance
The Varnish (Classic) - Cache Performance dashboard provides worker thread-related metrics to tell you if your thread pools are healthy and functioning well.
Use this dashboard to:
- Gain insights into the performance and health of Varnish Cache.
- Determine if any corrective actions are required to provide high performance and availability.
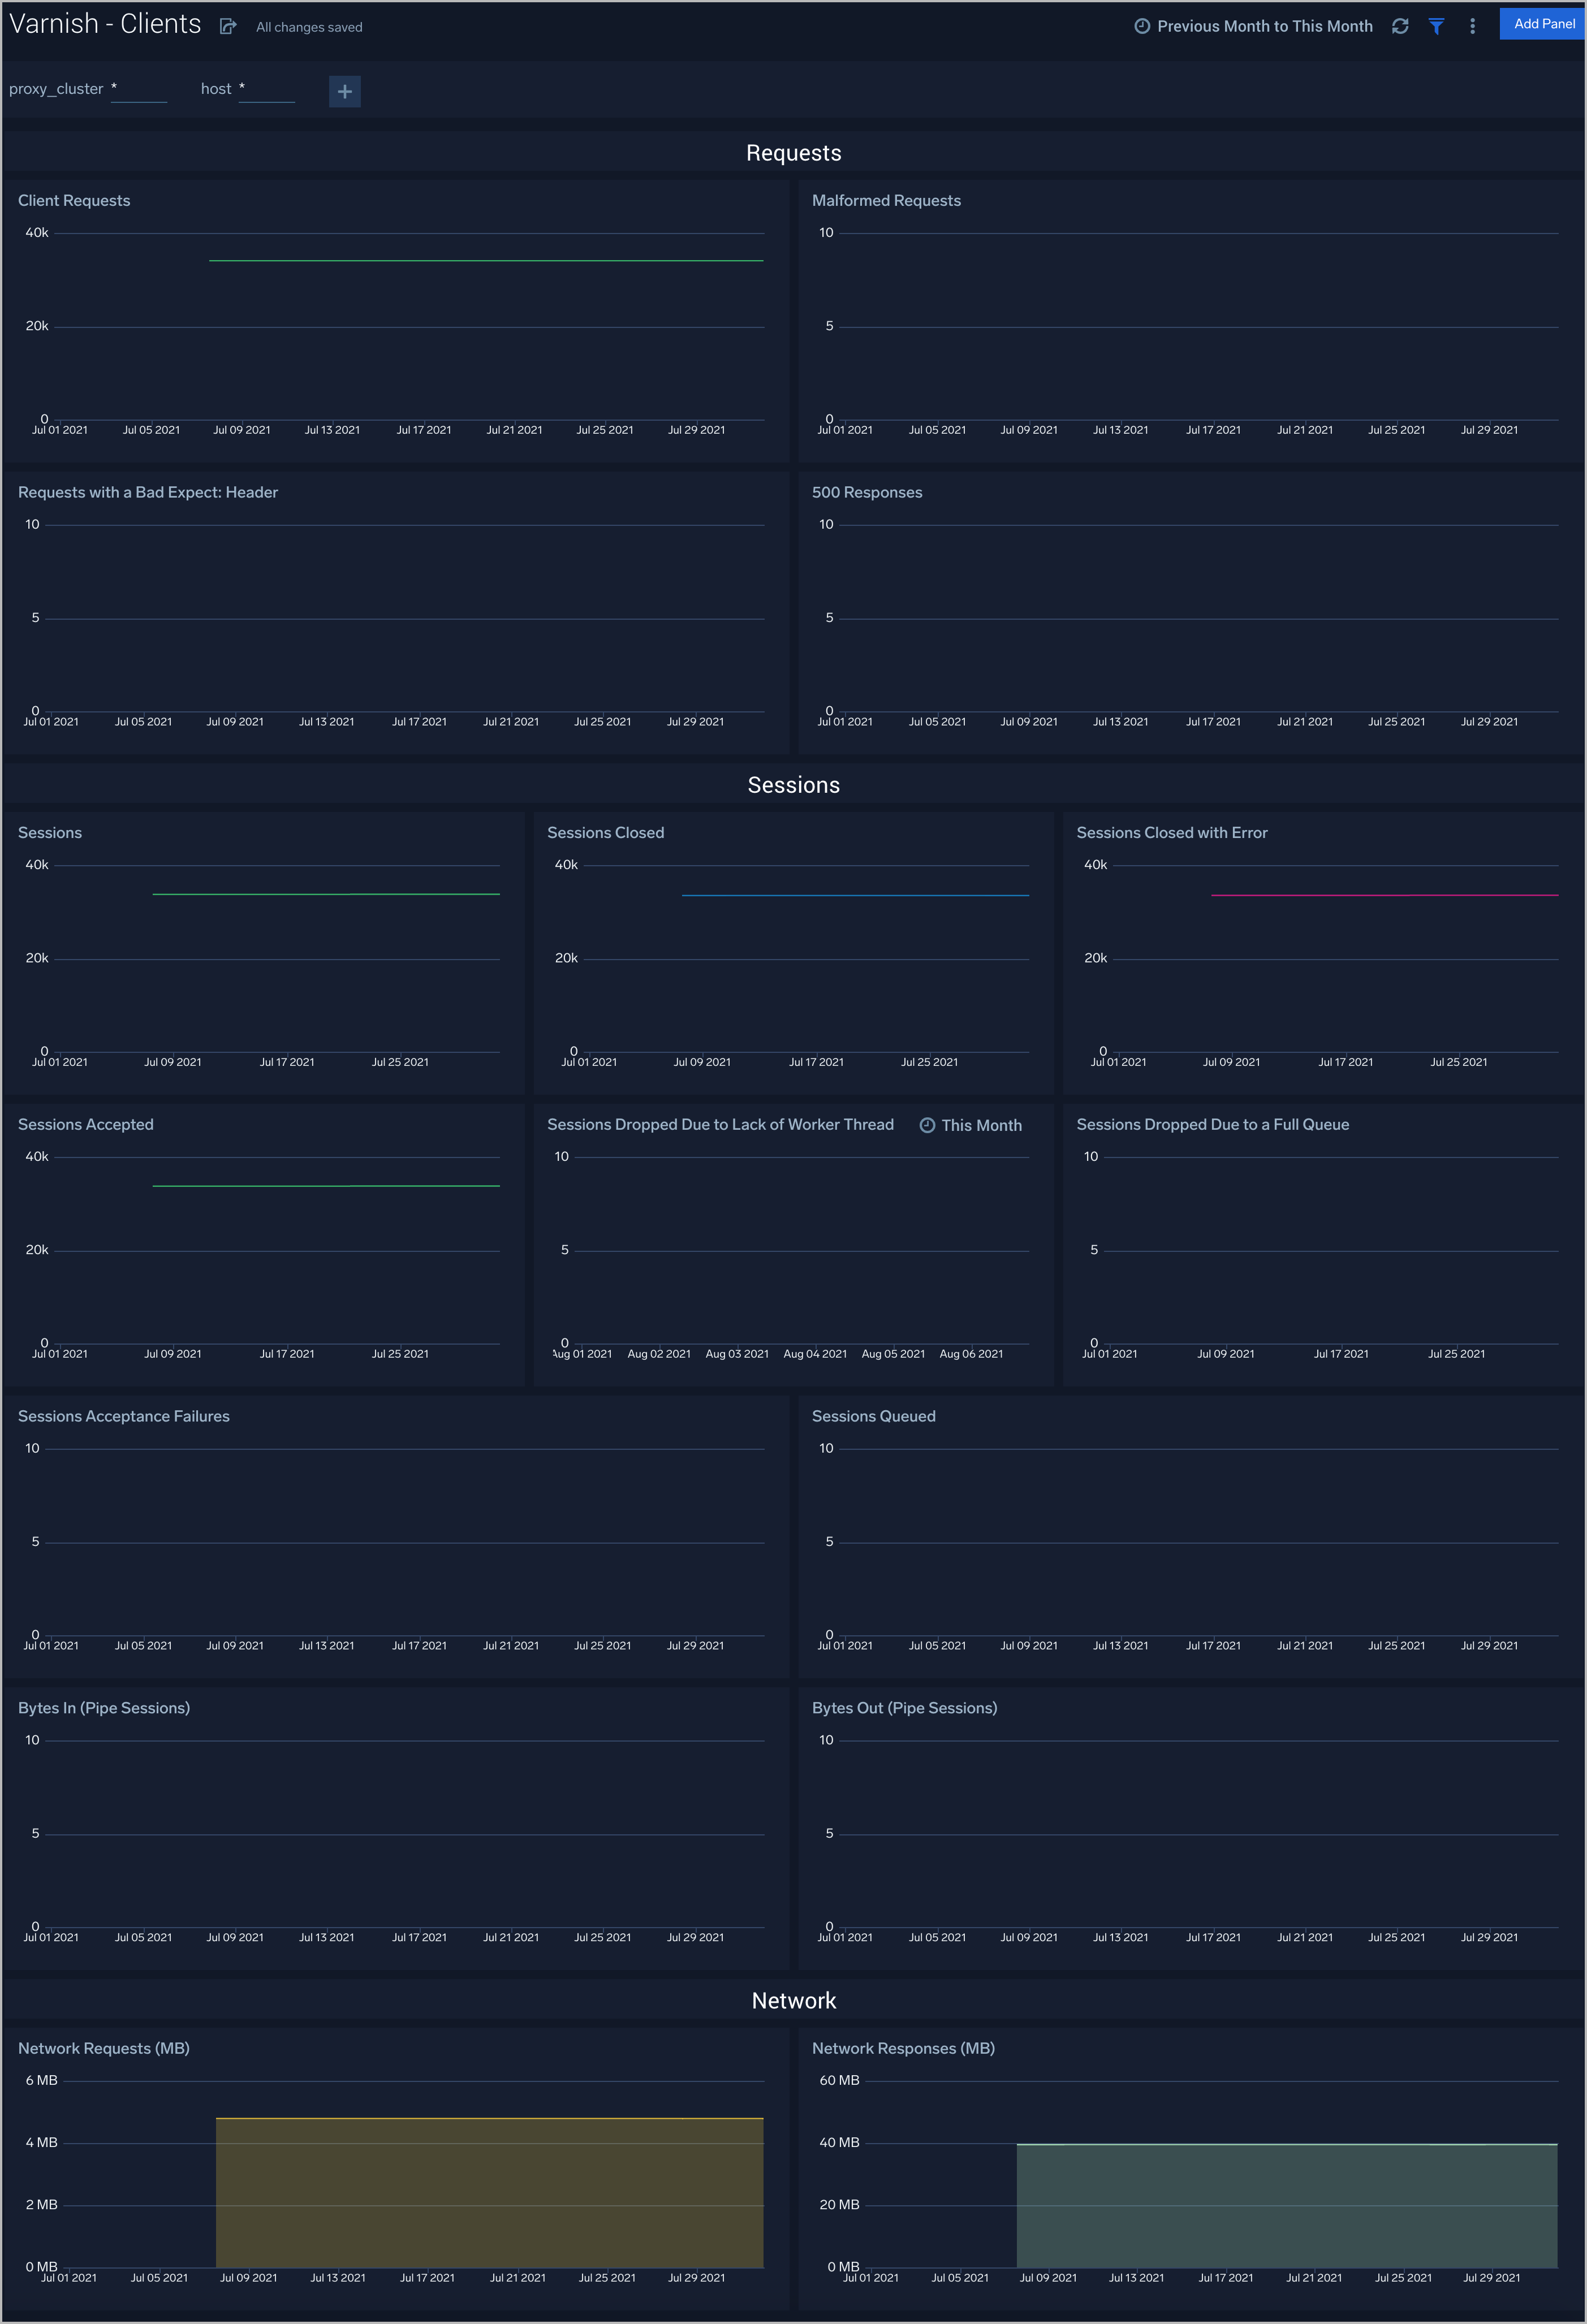
Clients
The Varnish (Classic) - Clients dashboard check collects Varnish metrics regarding connections and requests.
Use this dashboard to:
- Review the current sessions and load on Varnish.
- Determine if there are failures because of overloading and if additional resources are required.
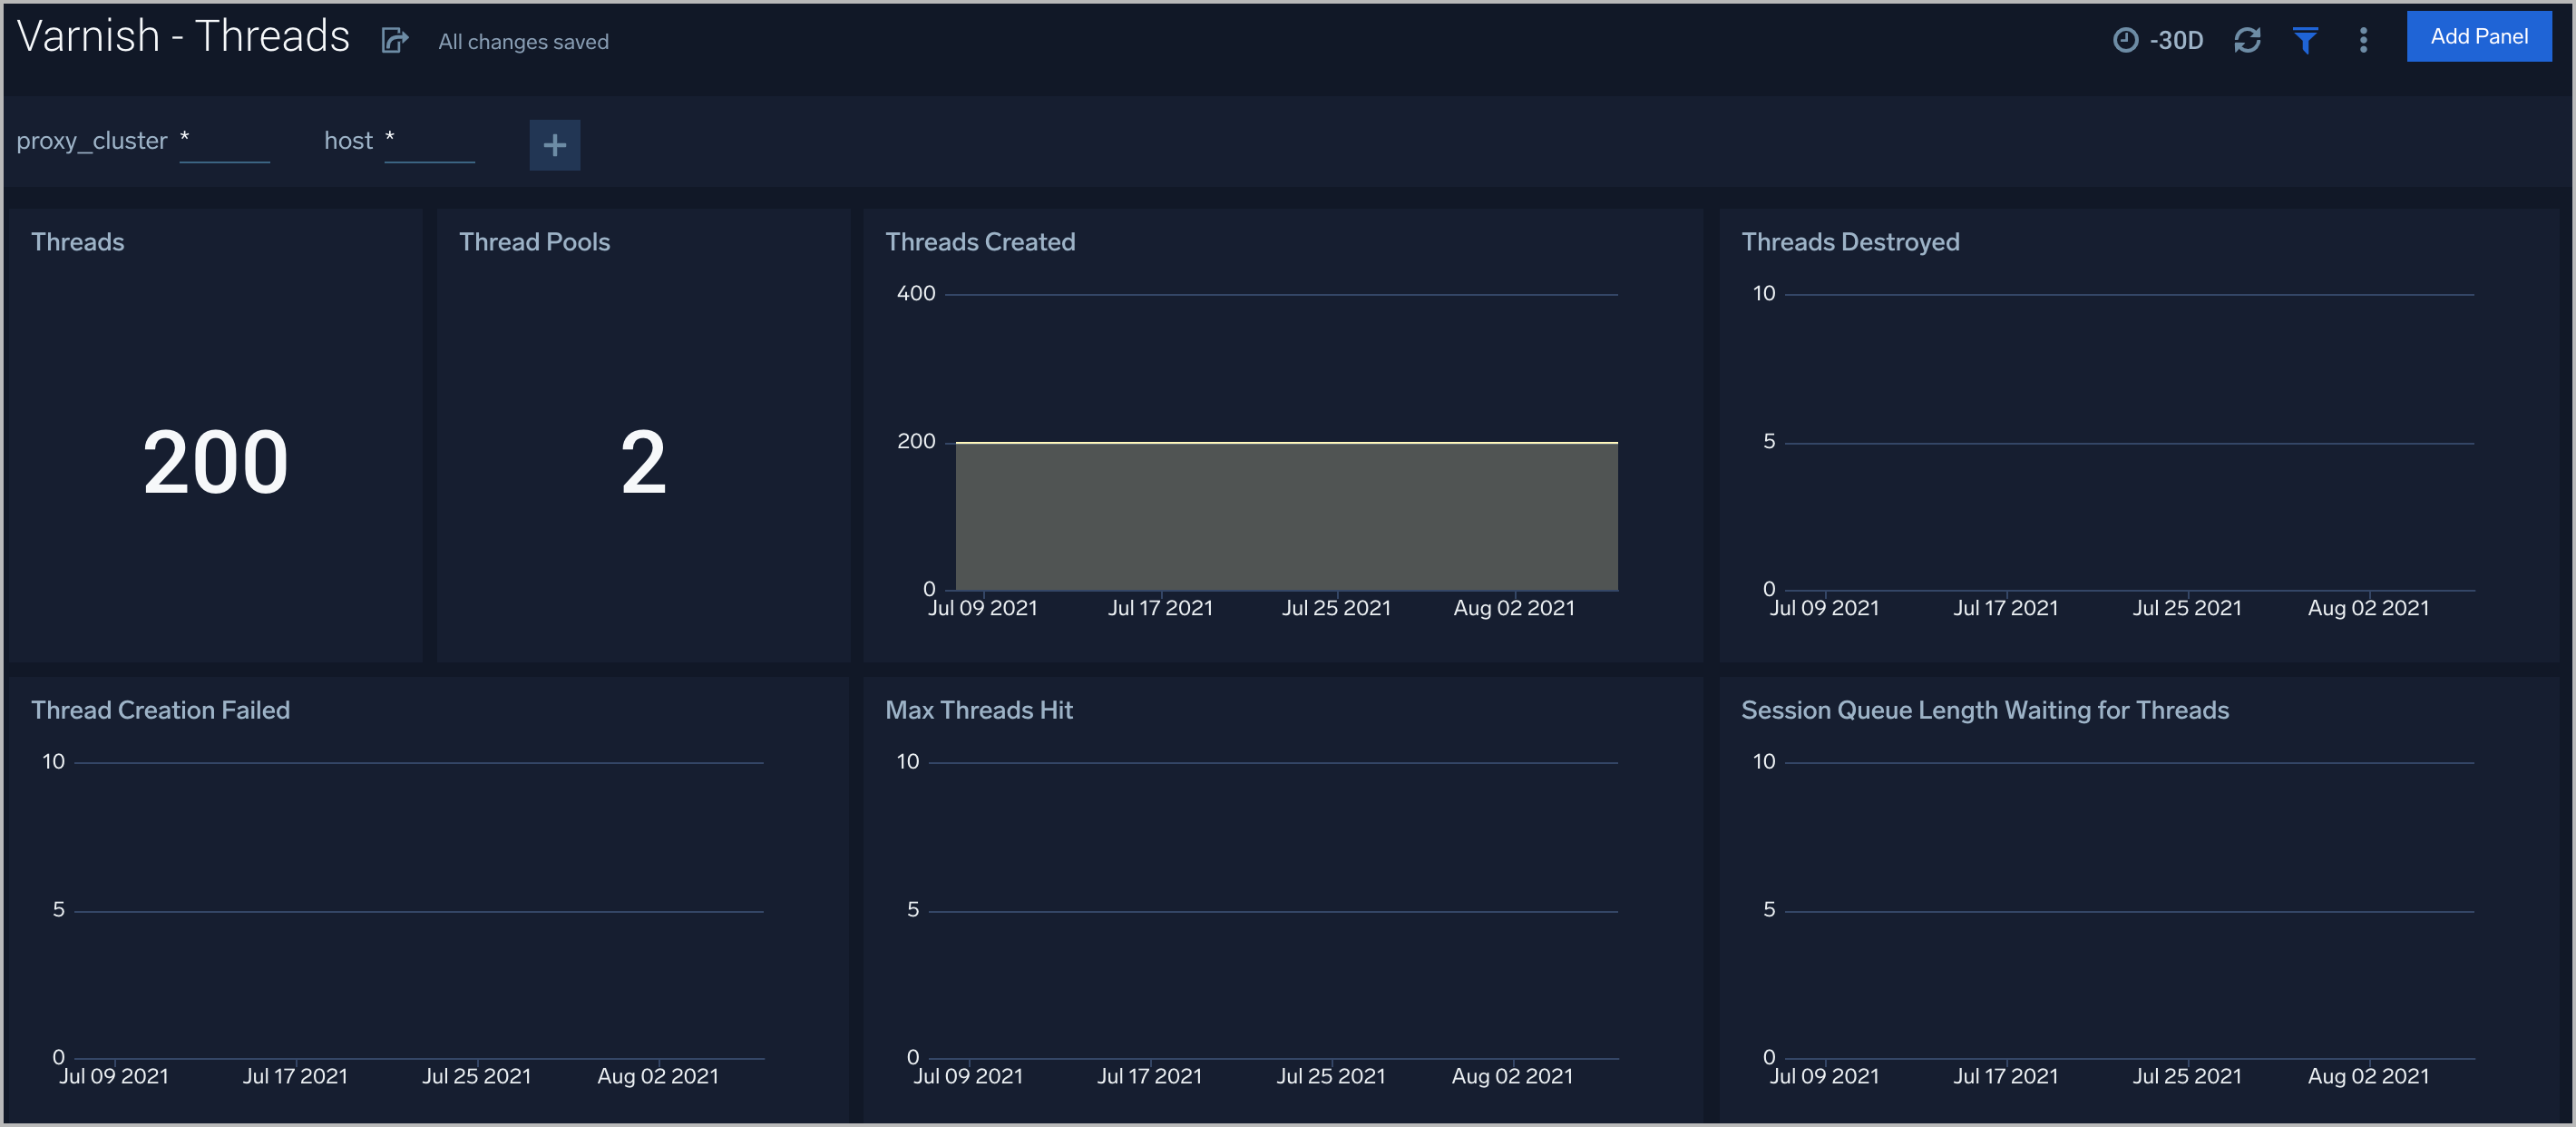
Threads
The Varnish (Classic) - Threads Dashboard helps you to keep track of thread metrics to watch your Varnish Cache.
Use this dashboard to:
- Manage and understand threads in the Varnish system.
Create monitors for Varnish app
From your App Catalog:
- From the Sumo Logic navigation, select App Catalog.
- In the Search Apps field, search for and then select your app.
- Make sure the app is installed.
- Navigate to What's Included tab and scroll down to the Monitors section.
- Click Create next to the pre-configured monitors. In the create monitors window, adjust the trigger conditions and notifications settings based on your requirements.
- Scroll down to Monitor Details.
- Under Location click on New Folder.
note
By default, monitor will be saved in the root folder. So to make the maintenance easier, create a new folder in the location of your choice.
- Enter Folder Name. Folder Description is optional.
tip
Using app version in the folder name will be helpful to determine the versioning for future updates.
- Click Create. Once the folder is created, click on Save.
Varnish alerts
| Alert Type (Metrics/Logs) | Alert Name | Alert Description | Trigger Type (Critical / Warning) | Alert Condition | Recover Condition |
|---|---|---|---|---|---|
| Metrics | Varnish - Backend Busy | This alert fires when the Varnish backend is busy for more than 5 minutes and is unable to serve requests. | Warning | >0 | < =0 |
| Metrics | Varnish - Backend Connection Retries | This alert fires when there a more than 5 backend connection retries, which can indicate misconfiguration. | Warning | >5 | < =5 |
| Metrics | Varnish - Backend Failed Connections | This alert fires when there are failed connections to the backend. | Warning | >0 | < =0 |
| Metrics | Varnish - Unhealthy Backend | This alert fires when we detect that a backend server is unhealthy for more than 5 minutes. | Critical | >0 | < =0 |
| Metrics | Varnish - Thread creation failed | This alert fires when Varnish is unable to create threads, which indicates either under-provisioning or misconfiguration. | Warning | >0 | < =0 |
| Logs | Varnish - Access from Highly Malicious Sources | This alert fires when Varnish is accessed from highly malicious IP addresses. | Critical | >0 | < =0 |
| Logs | Varnish - High 4XX Error Rate | This alert fires when too many HTTP requests (>5%) with a response status of 4xx. | Critical | >5 | < =5 |
| Logs | Varnish - High 5XX Error Rate | This alert fires when too many HTTP requests (>5%) with a response status of 5xx. | Critical | >5 | < =5 |