Hasura
The Hasura app for Sumo Logic enables you to seamlessly integrate and analyze your Hasura data event and schema operation metrics. It offers a holistic view of your data events, showcasing key metrics such as Events Generated, Distribution by Operation, Deleted events, Target Schema, and Target Tables. By tracking trends in Events by Table Schema, Trigger, and Operation, you can make data-driven decisions to optimize your data architecture and operations. Additionally, the app provides a quick overview of recent data changes with summaries for Recent Insertions, Updates, and Deletions, allowing for real-time monitoring and informed action.
Hasura Cloud is a fully managed version of GraphQL Engine that provides you with a scalable, secure, and globally distributed GraphQL API over your data sources. You can use a webhook in the Hasura platform to forward logs to the Sumo Logic HTTP endpoint. Using these logs, you can monitor the insert, update, and deletion events in Sumo Logic. For more details, refer to the Hasura Documentation.
Event types
The Sumo Logic integration for Hasura ingests events into Sumo Logic through an outgoing webhook available in Hasura. The following event types are ingested through the Hasura webhook:
- Insert Operation
- Delete Operation
- Update Operation
Sample log messages
{
  "created_at": "2023-10-25T19:36:33+000016",
  "delivery_info": {
    "current_retry": 0,
    "max_retries": 0
  },
  "event": {
    "data": {
      "new": {
        "id": 4,
        "name": "Apple",
        "price": 250
      },
      "old": null
    },
    "op": "INSERT",
    "session_variables": {
      "x-hasura-role": "admin"
    },
    "trace_context": {
      "span_id": "f9f419152b7a8cd9",
      "trace_id": "62d54ef179fa101a49ed7b49576e2ac7"
    }
  },
  "id": "bfbf5b84-8cf7-4ae7-8288-1698262593",
  "table": {
    "name": "Products",
    "schema": "eCommerce_db"
  },
  "trigger": {
    "name": "Product_StatusCheck"
  }
}
Sample queries
_sourceCategory="webhook/hasura"
| json "id", "created_at", "event.op","table.name","table.schema","trigger.name" as id, created_at, operation, tableName, tableSchema, triggerName nodrop
| where tableSchema matches "{{tabelSchema}}" and tableName matches "{{tabelName}}" and operation matches "{{operation}}" and triggerName matches "{{triggerName}}"
| count
Setup
This section has instructions for collecting logs for the Sumo Logic Hasura webhook collection.
Source configuration
Follow the below steps to configure the Hosted Collector to receive Hasura events:
- In the Sumo Logic portal, create a new Hosted Collector or use an existing one. Then add an HTTP Logs and Metrics Source.
- Configure Source Category in the HTTP source - for example,
webhook/hasura- for the Hasura integration. - Copy and save the endpoint URL of the source.
Vendor configuration
Configure the webhook integration in Hasura to send events to the Sumo Logic HTTP source. Once configured, it will be triggered each time the events occur within your Hasura account.
Follow the below steps to configure the Hasura webhook.
- Sign in to the Hasura account.
- Go to the project console for which you want to send notifications to Sumo Logic.
- Go to Events and click Create. The webhook form appears.
- Enter webhook form data as follows:
- Trigger Name. Provide a name for the webhook.
- Database. Select the database from the dropdown menu.
- Schema/Table. Select the schema and table from the dropdown menu.
- Trigger Operations. Select the type of events that will cause this webhook to execute.
- Webhook (HTTP/S) Handlers. Enter the Sumo Logic HTTP endpoint URL (source address) created above.
- Click Create Event Trigger.
- Verify Hasura events are getting ingested in Sumo Logic by executing the following query on Sumo Logic's Log Search panel.
_sourceCategory=webhook/hasura
- For detailed information about webhook creation, refer to the Hasura Documentation.
- For support, contact Hasura.
Installing the Hasura app
To install the app, do the following:
Next-Gen App: To install or update the app, you must be an account administrator or a user with Manage Apps, Manage Monitors, Manage Fields, Manage Metric Rules, and Manage Collectors capabilities depending upon the different content types part of the app.
- Select App Catalog.
- In the 🔎 Search Apps field, run a search for your desired app, then select it.
- Click Install App.
note
Sometimes this button says Add Integration.
- Click Next in the Setup Data section.
- In the Configure section of your respective app, complete the following fields.
- Field Name. If you already have collectors and sources set up, select the configured metadata field name (eg _sourcecategory) or specify other custom metadata (eg: _collector) along with its metadata Field Value.
- Click Next. You will be redirected to the Preview & Done section.
Post-installation
Once your app is installed, it will appear in your Installed Apps folder, and dashboard panels will start to fill automatically.
Each panel slowly fills with data matching the time range query received since the panel was created. Results will not immediately be available but will be updated with full graphs and charts over time.
Viewing Hasura dashboards
All dashboards have a set of filters that you can apply to the entire dashboard. Use these filters to drill down and examine the data to a granular level.
- You can change the time range for a dashboard or panel by selecting a predefined interval from a drop-down list, choosing a recently used time range, or specifying custom dates and times. Learn more.
- You can use template variables to drill down and examine the data on a granular level. For more information, see Filtering Dashboards with Template Variables.
- Most Next-Gen apps allow you to provide the scope at the installation time and are comprised of a key (
_sourceCategoryby default) and a default value for this key. Based on your input, the app dashboards will be parameterized with a dashboard variable, allowing you to change the dataset queried by all panels. This eliminates the need to create multiple copies of the same dashboard with different queries.
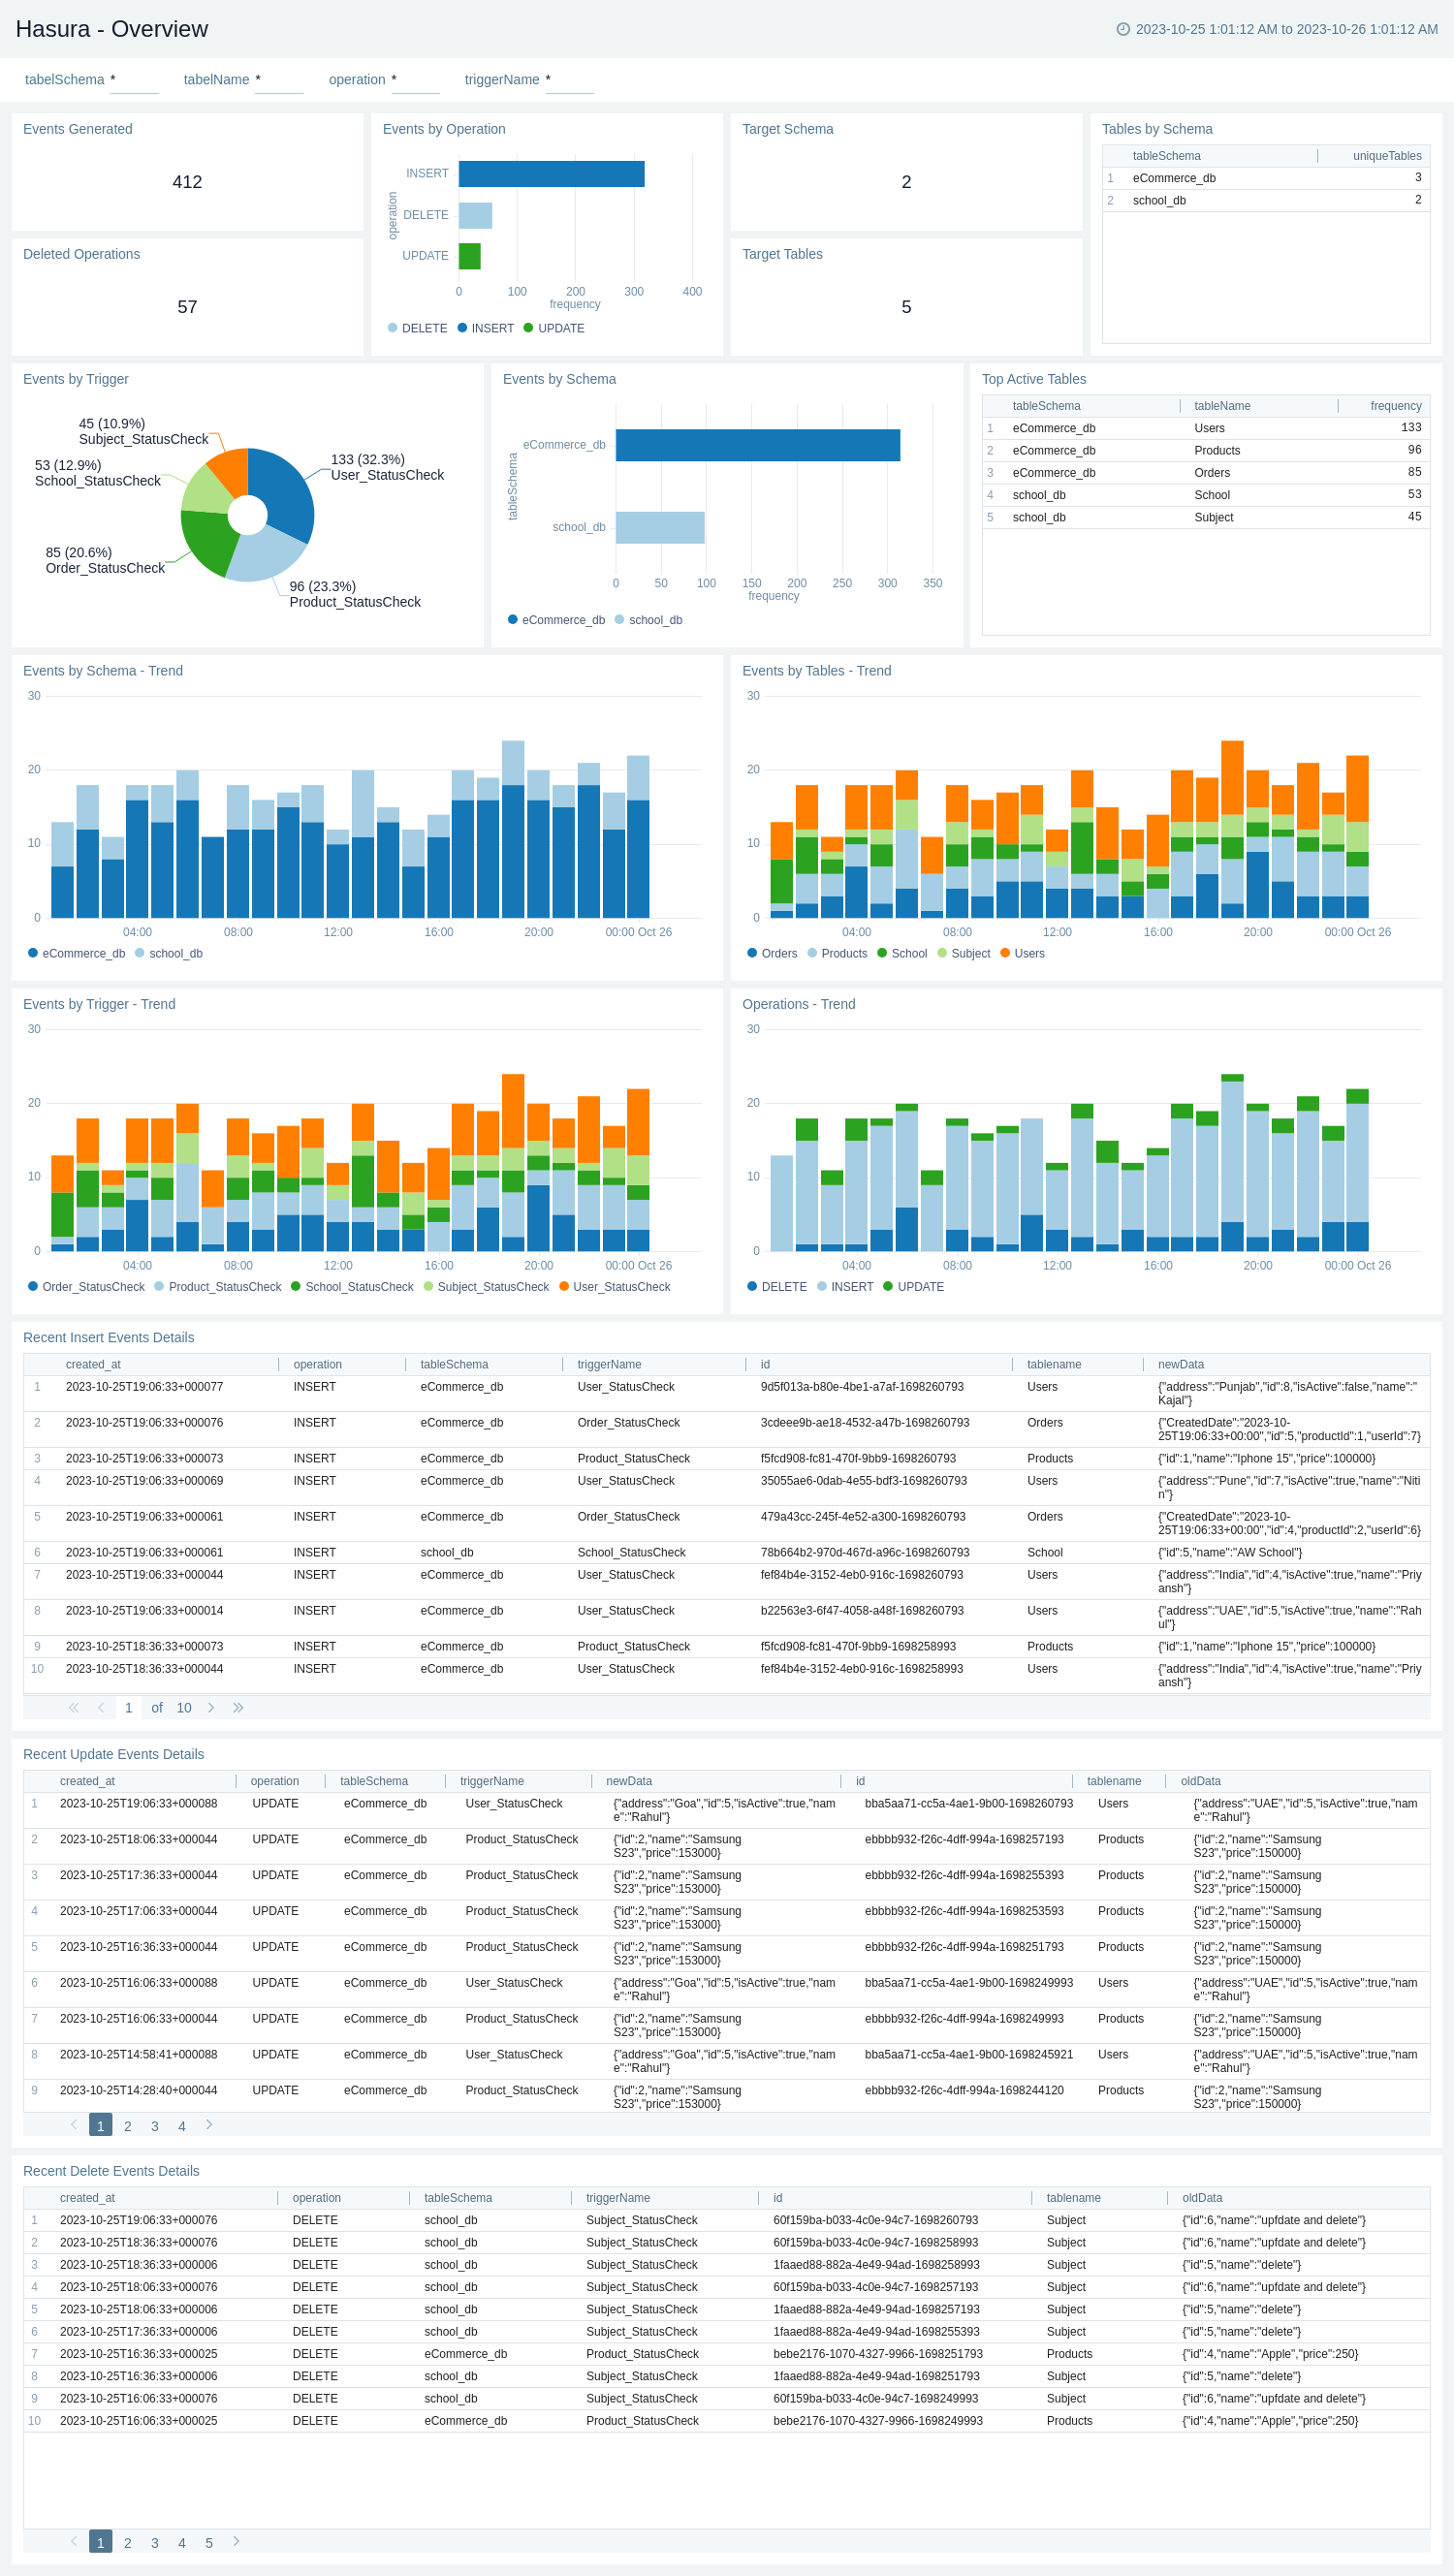
Overview
The Hasura - Overview dashboard offers a comprehensive snapshot of data events and schema operations, providing valuable insights for effective management. It tracks the volume of Events Generated and their distribution by Operation, including Deleted events. It provides visibility into the Target Schema and Tables and analyzes data events by Table Schema and Trigger. The dashboard also highlights events by specific tables, enabling a deep dive into data trends. With trend analysis for Table Schema, Events by Table, Trigger, and Operation, users can make informed decisions about data architecture and operations. Additionally, it keeps users up to date with concise summaries of Recent Insertions, Updates, and Deletions, ensuring a real-time understanding of the data ecosystem.
Upgrade/Downgrade the Hasura app (Optional)
To update the app, do the following:
Next-Gen App: To install or update the app, you must be an account administrator or a user with Manage Apps, Manage Monitors, Manage Fields, Manage Metric Rules, and Manage Collectors capabilities depending upon the different content types part of the app.
- Select App Catalog.
- In the Search Apps field, search for and then select your app.
Optionally, you can identify apps that can be upgraded in the Upgrade available section. - To upgrade the app, select Upgrade from the Manage dropdown.
- If the upgrade does not have any configuration or property changes, you will be redirected to the Preview & Done section.
- If the upgrade has any configuration or property changes, you will be redirected to the Setup Data page.
- In the Configure section of your respective app, complete the following fields.
- Field Name. If you already have collectors and sources set up, select the configured metadata field name (eg _sourcecategory) or specify other custom metadata (eg: _collector) along with its metadata Field Value.
- Click Next. You will be redirected to the Preview & Done section.
Post-update
Your upgraded app will be installed in the Installed Apps folder and dashboard panels will start to fill automatically.
See our Release Notes changelog for new updates in the app.
To revert the app to a previous version, do the following:
- Select App Catalog.
- In the Search Apps field, search for and then select your app.
- To version down the app, select Revert to < previous version of your app > from the Manage dropdown.
Uninstalling the Hasura app (Optional)
To uninstall the app, do the following:
- Select App Catalog.
- In the 🔎 Search Apps field, run a search for your desired app, then select it.
- Click Uninstall.