Collection Status Page
The Status page provides a message volume history for your account, as well as a message volume histogram for each Collector, giving you immediate visual feedback about traffic spikes or collection issues. To see statistics for any bar in the histogram, hover your mouse pointer over the area of interest.
When you first install a Collector it is common to configure Sources to collect some historical data, rather than from the moment of installation. In this case, the status page shows a spike in message volume and then levels out as collection reaches a steady state. For example, a local log file can contain millions of log messages. When the Collector is initialized, it quickly gathers all those logs and sends them to Sumo Logic resulting in a traffic spike. After the initial collection, the Collector continues to tail the file, reading from the end of the file as new entries are created, and sends a smaller number of new log messages.
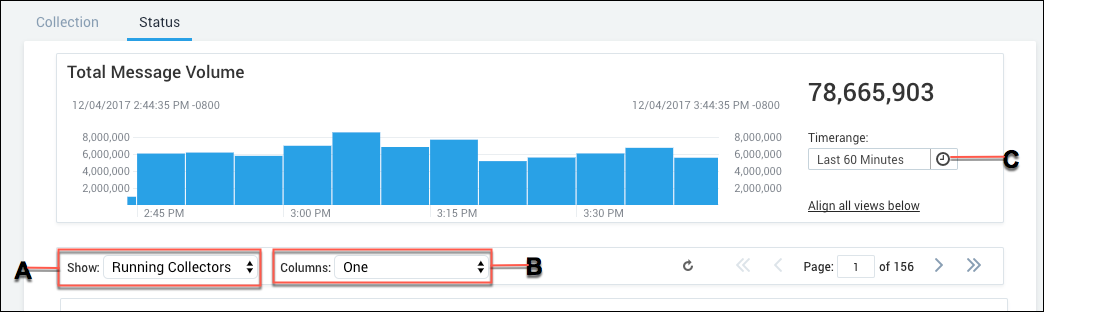
- A. Select to show all, running, or stopped Collectors.
- B. Select how many columns of Collectors are displayed.
- C. Select the time range of data volume to view.
Classic UI. To view the status page, in the main Sumo Logic menu select Manage Data > Collection > Status.
New UI. To view the status page, in the Sumo Logic top menu select Configuration, and then under Data Collection select Status. You can also click the Go To... menu at the top of the screen and select Status.
Change the scale or timeframe for a Collector
For each Collector, you can change the message volume scale so that variations in volume are easier to see. You can also change the time range for each Collector to investigate the stream volume for a single Collector. When a Collector x or y axis is not aligned with all others, the background color changes to blue.
To return to an aligned scale across all Collectors, in the total message volume area, click the link to Align all views below. To return an individual view to the same scale as other Collectors, select the Same scale across view check box.