Log and Tracing Data Volume Index
The data volume index is populated with a set of log messages every five minutes. The messages contain information on how much data (by bytes and messages count) your account is ingesting. Your data volume is calculated based on when your logs were received, in Sumo this timestamp is stored with the _receiptTime metadata field. Each log message includes information based on one of the following index source categories.
| Index Log Type | Index Source Category |
|---|---|
| Collector | collector_and_tier_volume |
| Source | source_and_tier_volume |
| SourceName | sourcename_and_tier_volume |
| SourceCategory | sourcecategory_and_tier_volume |
| SourceHost | sourcehost_and_tier_volume |
| View | view_and_tier_volume |
| Collector | collector_volume |
| Source | source_volume |
| SourceName | sourcename_volume |
| SourceCategory | sourcecategory_volume |
| SourceHost | sourcehost_volume |
| View | view_volume |
| SourceCategory | view_and_extractedAndCollectedFieldSize_volume |
You can query the data volume index just like any other message using the Sumo Logic search page. To see the data created within the data volume index, when you search, specify the _index metadata field with a value of sumologic_volume. For more information, see Search Metadata.
Sumo Logic App for Data Volume
Sumo Logic provides an application that utilizes the data volume index to see your account's volume usage as a glance. For details, see Data Volume app.
Known Issue
There is a known issue when searching against _sourceCategory values where scheduled views show up blank. This causes results to be returned with numbers as the _sourceCategory values.
For example, you would see:
"sizeInBytes":2862,
"count":353325
In this case, the _sourceCategory returns 2862, which is the actual size of the default index from the scheduled view.
Query the Data Volume Index
-
In the Search page, enter the query
_index=sumologic_volume.infoMake sure to enter the query exactly as shown to search against this specific source.
-
Choose the time range for the data that you'd like to review.
-
Click Start to run the search. Results return in the Messages tab.
To further limit the search results to the data volume index data for a specific volume category, you can supply the index source category using the _sourceCategory metadata and one of the index source categories from the previous table. For example:
_index=sumologic_volume AND _sourceCategory=collector_and_tier_volume
If the data volume index is not enabled, a search will not produce any results.
Data Volume Index Message Format
The data volume index messages are JSON formatted messages that contain parent objects for each source data point, and child objects that detail the message size and count for each parent.
For example, a single message for the "Collector" volume data may look similar to the following, with field, dataTier, sizeinBytes, extractedAndCollectedFieldsSize, and count values for those five minutes.
{"field":"vibs_inf","dataTier":"Infrequent","sizeInBytes":10539077,"extractedAndCollectedFieldsSize":445829,"count":3092},
{"field":"epd_dev_inf","dataTier":"Infrequent","sizeInBytes":39698534,"extractedAndCollectedFieldsSize":19835099,"count":130358},
{"field":"epd_pr_inf","dataTier":"Infrequent","sizeInBytes":2204671,"extractedAndCollectedFieldsSize":1426875,"count":8864}
For example, a single message for the "Collector" volume data may look similar to the following flex data, with field, dataTier, sizeInBytes, extractedAndCollectedFieldsSize, and count values for those five minutes.
{"field": "part_a","dataTier":"Flex","sizeInBytes":13754115,"extractedAndCollectedFieldsSize":6835091,"count":10255}
Examples
Volume for Each Category
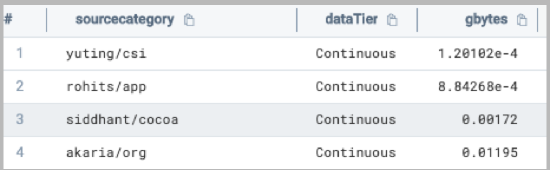
This example query will return the volume for each Source Category by data tier.
_index=sumologic_volume _sourceCategory = "sourcecategory_and_tier_volume"
| parse regex "(?<data>\{[^\{]+\})" multi
| json field=data "field","dataTier","sizeInBytes","count" as sourcecategory, dataTier, bytes, count
| bytes/1Gi as gbytes
| sum(gbytes) as gbytes by sourceCategory,dataTier
would produce results such as:
Volume for Each Collector by Tier
This example query will return the volume for each Collector.
_index=sumologic_volume _sourceCategory = "collector_and_tier_volume"
| parse regex "(?<data>\{[^\{]+\})" multi
| json field=data "field","dataTier","sizeInBytes","count" as collector, dataTier, bytes, count
| bytes/1Gi as gbytes
| sum(gbytes) as gbytes by collector,dataTier
Volume for a Specific Source
The following query returns the message volume for a specific Source. The Source name and Data tier can be supplied within a JSON operation to get the data for that Source.
_index=sumologic_volume _sourceCategory = "source_and_tier_volume"
| parse regex "(?<data>\{[^\{]+\})" multi
| json field=data "field","dataTier","sizeInBytes","count" as source, dataTier, bytes, count
| where source="<<my_source_name>>" and dataTier="<<datatier_json>>"
| bytes/1Gi as gbytes
| sum(gbytes) as gbytes by source
| fields gbytes
Volume for a Specific Collector
The following query returns the message volume for a specific Collector. The Collector name and Data tier can be supplied within a JSON operation to get the data for that Collector.
_index=sumologic_volume _sourceCategory = "collector_and_tier_volume"
| parse regex "(?<data>\{[^\{]+\})" multi
| json field=data "field","dataTier","sizeInBytes","count" as collector, dataTier, bytes, count
| where collector ="<<collector_json>>" and dataTier="<<datatier_json>>"
| bytes/1Gi as gbytes
| sum(gbytes) as gbytes by collector
| fields gbytes
Volume for Each Source Host
The following query returns the message volume for each Source Host. The sourcehost name and data tier can be supplied within a JSON operation to get the data for that sourcehost.
_index=sumologic_volume _sourceCategory = "sourcehost_and_tier_volume"
| parse regex "(?<data>\{[^\{]+\})" multi
| json field=data "field","dataTier","sizeInBytes","count" as sourcehost, dataTier, bytes, count
| where sourcehost="<<sourcejost_json>>" and dataTier="<<datatier_json>>"
| bytes/1Gi as gbytes
| sum(gbytes) as gbytes by sourcehost
| fields gbytes
Volume for the Default Index
The following query returns the message volume for the Default Index. The data tier can be supplied with a JSON operation to filter results of that tier.
_index=sumologic_volume _sourceCategory = "sourcehost_and_tier_volume"
| parse regex "(?<data>\{[^\{]+\})" multi
| json field=data "field","dataTier","sizeInBytes","count" as sourcehost, dataTier, bytes, count
| where sourcehost="<<sourcejost_json>>" and dataTier="<<datatier_json>>"
| bytes/1Gi as gbytes
| sum(gbytes) as gbytes by sourcehost
| fields gbytes
Tracing Data Volume Index
Sumo Logic populates the Tracing Data Volume Index with a set of JSON-formatted messages every five minutes. The messages contain the volume of tracing billed bytes and span count of Tracing data that your account is ingesting.
You can query the index to:
- Get the total tracing data volume (billed bytes/spans count) ingested by collector, source, source name, source category, or source host.
Message format
Each JSON message contains the parent object for each tracing, and child objects that detail the billed byes and spans count for each parent.
For example, a single message for collector volume data may look similar to the following, where collector_N is the name of a collector. The billed bytes and span counts values are the aggregated volume for a five minute time period.
{
    "collector_a":{"billedBytes":733296,spansCount: 67082},
    "collector_b":{"billedBytes":523296,spansCount: 47082},
    "collector_c":{"billedBytes":733536,spansCount: 89086},
    "collector_d":{"billedBytes":133296,spansCount: 53083},
}
Querying the Tracing Data Volume index
When you query the index, the query scope must include the following:
_index=sumologic_volume _sourceCategory=<index_source_category>
Where index_source_category is one of the categories listed in the table below.
| Index Log Type | Index Source Category | Description |
|---|---|---|
| Collector | collector_tracing_volume | Use this source category to query tracing volume by collector. |
| Source | source_tracing_volume | Use this source category to query tracing volume by source. |
| SourceName | sourcename_tracing_volume | Use this source category to query tracing volume by source name. |
| SourceCategory | sourcecategory_tracing_volume | Use this source category to query tracing volume by source category. |
| SourceHost | sourcehost_tracing_volume | sourcehost_tracing_volume |
Tracing volume query examples
Tracing volume by source category
This query returns the tracing volume by source category.
_index=sumologic_volume _sourceCategory="sourcecategory_tracing_volume"
| parse regex "\"(?<sourcecategory>[^\"]+)\"\:(?<data>\{[^\}]*\})" multi
| json field=data "billedBytes", "spansCount"
|sum(billedBytes) as"billedBytes" by sourcecategory
This query produces results like these:

Tracing volume by collector
This query returns the tracing volume by collector.
_index=sumologic_volume _sourceCategory="collector_tracing_volume"
| parse regex "\"(?<collector>[^\"]+)\"\:(?<data>\{[^\}]*\})" multi
| json field=data "billedBytes", "spansCount"
|sum(billedBytes) as "billedBytes" by collector
This query produces results like these:
Tracing volume for a specific collector
This query returns the tracing volume for a specific Collector. The Collector name can be supplied within a JSON operation to get the data for that Collector.
_index=sumologic_volume _sourceCategory="collector_tracing_volume"
| parse regex "\"(?<collector>[^\"]+)\"\:(?<data>\{[^\}]*\})" multi
| json field=data "billedBytes", "spansCount"
| where collector ="<<collector_json>>"
|sum(billedBytes) as billedBytes by collector
| fields billedBytes
Query for tracing ingestion outliers
This query runs against the tracing volume index and uses the outlier operator to find timeslices in which your tracing ingestion in billed bytes or span count was greater than the running average by a statistically significant amount.
_index=sumologic_volume _sourceCategory=sourcecategory_tracing_volume
| parse regex "\"(?<sourcecategory>[^\"]+)\"\:(?<data>\{[^\}]*\})" multi
| json field=data "billedBytes", "spansCount"
| timeslice 6h
|sum(billedBytes) as "billedBytes" by _timeslice
|outlier "billedBytes"
The suggested time range for this query is 7 days. Timeslices can always be reduced depending on the time range of the query.
Query for tracing ingestion prediction
This query runs against the tracing volume index and uses the predict operator to predict future values.
_index=sumologic_volume _sourceCategory=sourcecategory_tracing_volume
| parse regex "\"(?<sourcecategory>[^\"]+)\"\:(?<data>\{[^\}]*\})" multi
| json field=data "billedBytes", "spansCount"
| timeslice 1h
| sum(billedBytes) as %"billedBytes" by _timeslice
| predict %"billedBytes" by 1h model=ar, forecast=20
| fields - billedBytes_error
The suggested time range for this query is 7 days. Timeslices can always be reduced depending on the time range of the query.
Index retention period
By default, the retention period of the Data Volume index is the same as the retention period of your Default Partition. You can change the retention period by editing the partition that contains the index, sumologic_volume. For more information, see Edit a Partition.