Monitor Log Ingestion and Alerts
This article describes how to configure ingest alerts that you can schedule to get timely information about ingestion usage or throttling. The information in this article applies to Cloud Flex Legacy accounts. To monitor ingestion for Sumo Logic Credits accounts, see Sumo Logic Credits Account Overview.
With the exception of the Throttling alert described below, these alerts apply to logs, not metrics. For metrics volume queries, use the Metrics Data Volume Index.
Some of the alerts are based on your billing period or ingest plan limit. You must make the appropriate changes for the alert to function and return valid results. The alerts approximate ingest rates and might not precisely match the actual ingest volume used for invoicing purposes.
Monthly plan limit alert
This daily alert is generated when total log ingest for the current billing period is greater than or equal to 85% of your total Sumo Logic monthly plan limit. The alert covers the past 32 days (-32d).
You must update all of the indicated fields for the search to save successfully.
Setup
- Enable the Data Volume Index. See Enable and Manage the Data Volume Index for instructions.
- Substitute the correct values of
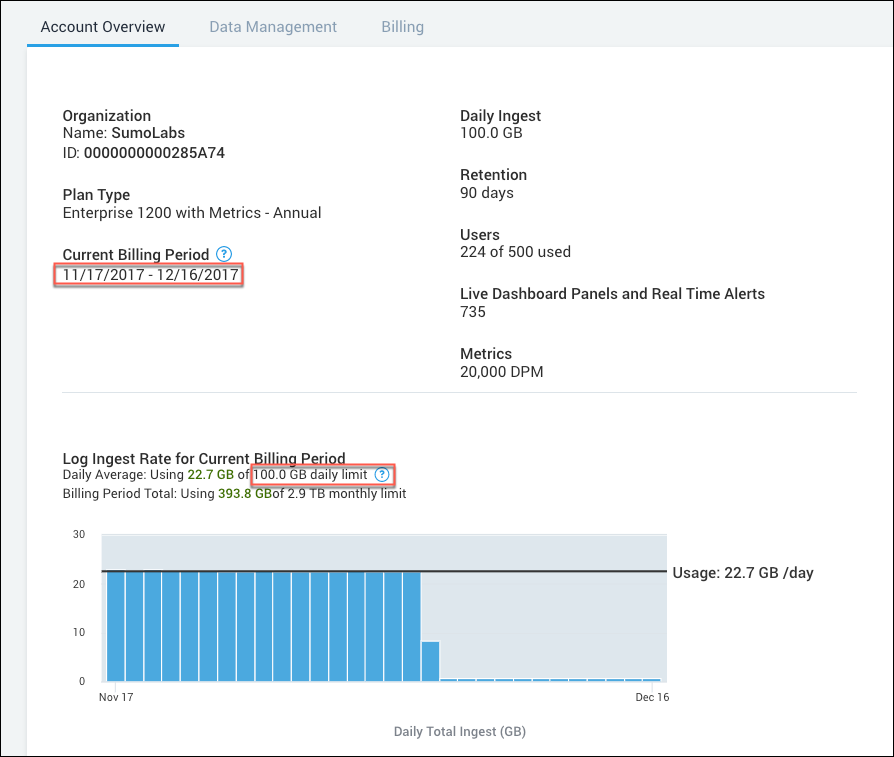
Xfor the following parameters in the search query. For the billing start and end values, use the day of the month. For example, in the screenshot below, the value forbilling_startis 17 so the updated line from the search becomes17 as billing_start.You can find the correct values on the Account page. Classic UI. In the main Sumo Logic menu, select Administration > Account > Account Overview.X as billing_start
X as billing_end
X as daily_gb_limit
New UI. In the top menu select Administration, and then under Account select Account Overview.
- (Optional) Modify the following line if you want to change the percentage threshold for generating the alert.
Example: To generate an alert at 80 % utilization, change the line to:
| where pct_used > 85| where pct_used > 80
Query
_index=sumologic_volume and sizeInBytes and _sourceCategory="sourcename_volume"
| parse regex "\"(?<sourcename>[^\"]*)\"\:(?<data>\{[^\}]*\})" multi
| json field=data "sizeInBytes", "count" as bytes, count
| timeslice 1d
| bytes/1024/1024/1024 as gbytes
| sum(gbytes) as gbytes by _timeslice
| formatDate(_timeslice, "YY") as year
| formatDate(_timeslice, "MM") as month
| number(month)
| formatDate(_timeslice, "dd") as day
| number(day)
| formatDate(queryEndTime(), "MM") as current_month
| number(current_month)
| formatDate(queryEndTime(), "dd") as current_day
| number(current_day)
| X as billing_start //Replace the X with your billing start day which can be found in Manage > Account.
| X as billing_end //Replace the X with your billing end day which can be found in Manage > Account
| if(current_day < billing_start, current_month-1, current_month) as start_month
| if(billing_start=1 && billing_end=31, current_month, if(current_day >= billing_start, current_month+1, current_month)) as end_month
| if(((month>start_month AND day<=billing_end) OR (month=start_month AND day>=billing_start)), "true", "false") as include
| 1 as day_count
| if(start_month in(1,3,5,7,8,10,12), 31, if (start_month in(4,6,9,11), 30, if(year % 4 == 0, 29, 28))) as days_in_start_month
| if(end_month in(1,3,5,7,8,10,12), 31, if (end_month in(4,6,9,11), 30, if(year % 4 == 0, 29, 28))) as days_in_end_month
| where include="true"
| order by _timeslice
| sum(gbytes) as gbytes, sum(day_count) as day_count, max(current_month) as current_month, max(current_day) as current_day, max(days_in_start_month) as days_in_start_month, max(days_in_end_month) as days_in_end_month, max(start_month) as start_month, max(end_month) as end_month, max(billing_start) as billing_start, max(billing_end) as billing_end
| if(current_month = end_month, billing_end-current_day, if(current_month < end_month, days_in_start_month-current_day+billing_end, 0)) as billing_days_remaining
| X as daily_gb_limit //Replace the X with your ingest limit per day which can be found in Manage > Account
| daily_gb_limit * (day_count + billing_days_remaining) as expected_ingest_in_billing_cycle
| (gbytes/expected_ingest_in_billing_cycle) * 100 as pct_used
| where pct_used > 85
Scheduling
After completing the setup, schedule the search to run:
- Schedule Query you created in Setup. For details, see Schedule a Search.
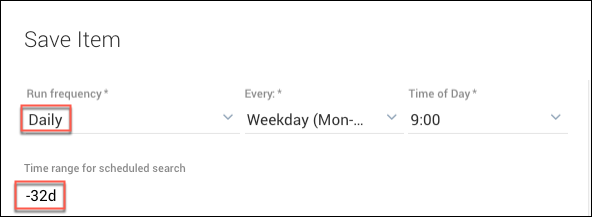
- Set the Run frequency to Daily.
- Enter -32d for the time range.
- Make sure Alert Condition is set to Send Notification if the Alert Condition is met: Number of results greater than 0.
Daily plan limit alert
This daily alert is generated when yesterday's daily account log ingest is greater than your daily plan limit.
You must update the indicated field for the search to be successfully saved.
Setup
- Enable the Data Volume Index. See Enable and Manage the Data Volume Index for instructions.
- Substitute the correct value of
Xfor the following parameter in the search query (see entry in yellow in the query below).The correct value is on the Account page.X as daily_plan_size - Classic UI. In the main Sumo Logic menu, select Administration > Account > Account Overview.
New UI. In the top menu select Administration, and then under Account select Account Overview. You can also click the Go To... menu at the top of the screen and select Account Overview.
For example, the daily plan size in the following figure is 100.
Query
_index=sumologic_volume sizeInBytes
| where _sourceCategory="collector_volume"
| parse regex "\"(?<collector>[^\"]*)\"\:(?<data>\{[^\}]*\})" multi
| json field=data "sizeInBytes", "count" as bytes, count
| bytes/1024/1024/1024 as gbytes
| timeslice 1d
| sum(gbytes) as gbytes by _timeslice
| 1000 as daily_plan_size
| where gbytes >= daily_plan_size
| sort gbytes
| fields _timeslice, gbytes, daily_plan_size
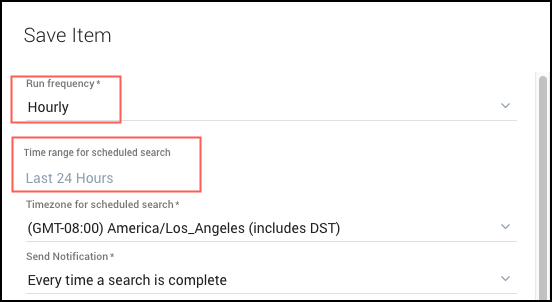
Scheduling
After completing the setup steps above, schedule the search to run, as follows.
- Schedule the query you created in the previous step (Query). For details, see Schedule a Search.
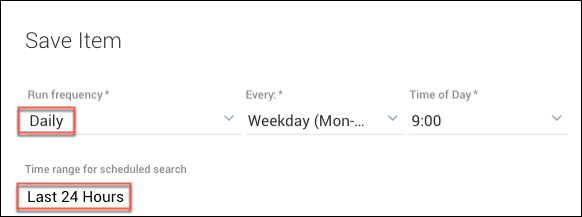
- Set the Run frequency to Daily.
- Set time range value to Last 24 Hours.
- Make sure Alert Condition is set to Send Notification if the Alert Condition is met: Number of results greater than 0.
Usage spike alert
This hourly alert is generated when both of the following occur:
- Ingest for any
_sourceCategoryin your account has a 50% spike compared with the maximum log ingest for the same_sourceCategoryover the last four weeks (comparison is with the same hour and day of week). - The log volume ingested by the
_sourceCategoryrepresents at least 25 % of the total data ingested within the hour.
Setup
- Enable the Data Volume Index. See Enable and Manage the Data Volume Index for instructions.
- (Optional) To adjust the sensitivity of this alert, change either of the values from the following line of the query:
Example: Change the
| where pct_increase > 30 and ingest_weight\> 30pct_increasevalue higher to make the alert less sensitive.| where pct_increase > 50 and ingest_weight\> 30 - (Optional) To change the alert to evaluate a spike in a Collector or Source, do either of the following:
- To generate an alert on a spike in ingest for a Collector, change the first line of the query replacing
_sourceCategory="sourcecategory_volume"with_sourceCategory="collector_volume" - To generate an alert on a spike in ingest for a Source, change the first line of the query replacing
_sourceCategory="sourcecategory_volume"with_sourceCategory="source_volume"
- To generate an alert on a spike in ingest for a Collector, change the first line of the query replacing
Query
_index=sumologic_volume sizeInBytes _sourceCategory="sourcecategory_volume"
| parse regex "\"(?<_sourcecategory>[^\"]*)\"\:(?<data>\{[^\}]*\})" multi
| json field=data "sizeInBytes", "count" as bytes, count
| timeslice 1h
| bytes/1024/1024/1024 as gbytes
| sum(gbytes) as gbytes by _sourcecategory, _timeslice
| where !(_sourceCategory matches "*_volume")
| compare timeshift -1w 4 max
| if(isNull(gbytes_4w_max), 0, gbytes_4w_max) as gbytes_4w_max
| ((gbytes - gbytes_4w_max) / gbytes) * 100 as pct_increase
| total gbytes by _timeslice
| (gbytes / _total) * 100 as ingest_weight
| where pct_increase > 50 and ingest_weight > 25 //update pct_increase and/or weight value to adjust alert sensitivity
Scheduling
After completing the setup steps above, schedule the search to run, as follows.
- Schedule the query you just created in Setup. For details, see Schedule a Search.
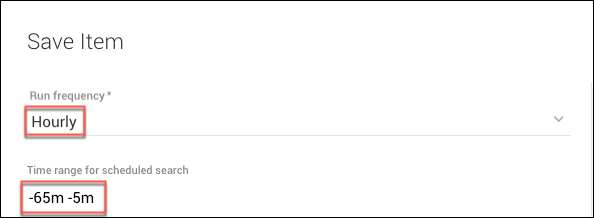
- Set the Run frequency to Hourly.
- Enter -65m -5m for the time range.
- Make sure Alert Condition is set to Send Notification if the Alert Condition is met: Number of results greater than 0.
Data not sent alert
This hourly alert will notify you if any of your Collectors have not sent log data for the last 24 hours (-24h). Because this alert will trigger if any Collectors do not send data in the specified time range, we recommend that you verify that all your Collectors are sending data before you set this alert and that you extend the time range if 24 hours is not long enough for your data to collect.
This type of alert isn't suitable for ephemeral environments and can send false positives.
Setup
Prerequisite. All collectors must be sending data before you set this alert. This alert will trigger if any collectors do not send data in the specified time range. If you want to identify collectors that are not ingesting for a long time or have not ingested at all, you can use the Collector API
attributes alive and LastSeenAlive.
- Enable the Data Volume Index. See Enable and Manage the Data Volume Index for instructions.
- (Optional) Depending on how busy your collectors are, you can modify the following alert threshold:
For example, if your collectors ingest less often than 60 minutes, 4 hours may be more appropriate and you can change the line to 240 minutes:
| where mins_since_last_logs\>= 60| where mins_since_last_logs\>= 240
Query
_index=sumologic_volume sizeInBytes _sourceCategory="collector_volume"
| parse regex "\"(?<collector>[^\"]*)\"\:(?<data>\{[^\}]*\})" multi
| json field=data "sizeInBytes", "count" as bytes, count
| first(_messagetime) as MostRecent, sum(bytes) as TotalVolumeBytes by collector
| formatDate(fromMillis(MostRecent),"yyyy/MM/dd HH:mm:ss") as MostRecentTime
| toMillis(queryEndTime()) as currentTime
| formatDate(fromMillis(currentTime),"yyyy/MM/dd HH:mm:ss") as SearchTime
| (currentTime-MostRecent) / 1000 / 60 as mins_since_last_logs
| where mins_since_last_logs >= 60
| fields -mostrecent, currenttime
| format ("%s Has not collected data in the past 60 minutes", collector) as message
You can run a similar query across Sources, sourceHosts, sourceNames, source categories, or views, by changing the entry for "collector_volume" in the search scope keyword line to:"source_volume" for Sources, "sourcehost_volume"for sourceHosts, "sourcename_volume" for sourceNames, "sourceCategory_volume" for sourceCategories, or "view_volume" for views.
If you do not want the results of the query across Sources or source categories to be called "collector", you can replace all three instances of "collector" with a different field name.
Scheduling
After completing the setup steps, you'll need to create a monitor.
- Create a monitor corresponding to the query you've created above (learn more).
- Set the Run frequency to Hourly.
- Set a time range. The default is Last 24 hours. If you need to allow for more time because some collectors do not typically ingest data that often, specify a longer time range. For example, seven days.
- Make sure Alert Condition is set to Send Notification if the Alert Condition is met: Number of results greater than 0.
- (Optional) You can test your new alert in one of the following ways.
- Limit the results to monitor just two collectors by adding this extra line to the end of the query:
| where collector = "some_name" or collector = "some_other_name" - Turn off a collector using Start or Stop a Collector using Scripts and verify that you received the alert.
- Reduce the time range for collectors to send data to 15 minutes:
| where mins_since_last_logs\>= 15
- Limit the results to monitor just two collectors by adding this extra line to the end of the query:
Throttling alert
This alert is automatically generated when your account has entered a throttled state (induced by metrics or logs) in the last 15 minutes. The alert runs every 15 minutes and covers a 15-minute period.
All accounts are subject to throttling, regardless of plan type (Cloud Flex or Cloud Flex Credits) or Data Tier.
Setup
Enable the Audit Index. See Enable and Manage the Audit Index for instructions.
Query
_index=sumologic_audit _sourceCategory=account_management _sourceName=VOLUME_QUOTA "rate limit"
Scheduling
After completing the setup steps above, schedule the search to run, as follows.
- Schedule the query you just created in Setup. For details, see Schedule a Search.
- Set the Run frequency to Every 15 Minutes.
- Set the time range to the Last 15 Minutes.
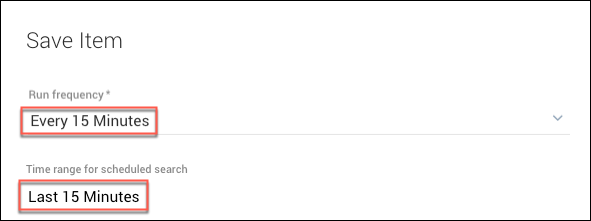
- Make sure Alert Condition is set to Send Notification if the Alert Condition is met: Number of results greater than 0.