Introduction to Metrics
Metrics are an effective tool for monitoring, troubleshooting, and identifying the root causes of problems. This page is a high-level overview of metrics in Sumo Logic and the terminology we use to talk about metrics.
Availability
| Account Type | Account Level |
|---|---|
| Cloud Flex | Trial, Professional, Enterprise |
| Credits | Trial, Essentials, Enterprise Operations, Enterprise Security, Enterprise Suite |
What is a metric?
A metric is a set of data points that measure the value of something. For example, the weather service collects measurements of temperature over time. Perhaps you weigh yourself once a week, or check the height of your child every 3 months.
Sumo customers use Sumo to collect metrics that measure the availability, usage, and performance of their application and computing resource, sometimes many times per minute.
In Sumo, we use the term time series to refer a set of timestamped values of a specific measurement. More generally, we often refer to metrics as time series data.
How do metrics get into Sumo?
Sumo administrators set up metric sources to receive metrics. A metric source understands a particular type of metric. For example, Sumo’s host metrics source knows how to ingest system metrics (network, CPU, file system, and so on) from Linux and Windows. Our CloudWatch source knows how to ingest metrics from AWS.
Metrics flow into Sumo as individual data points. The frequency varies.
How does Sumo store metrics?
Sumo stores metrics as raw data points and also in summarized form, in rollup tables.
Raw data points are individual data points. We sometimes refer to the raw data points we store as the baseline table.
While the baseline table contains raw data, rollup tables contain aggregated metric values. Sumo has two sets of rollup tables: one with the metric values for each time series aggregated by minute and one by hour. Sumo performs five types of aggregation on raw data points: avg, max, min, count, and sum. (The average value of the data points, the maximum value of the data points, the minimum value, the number of data points, and the sum of all the values.)
The process of calculating aggregated values for the individual data points in a time bucket is called quantization. The quantization process is described in detail on Metrics Quantization.
Metrics formats
Sumo supports the Graphite, Carbon 2.0, and Prometheus metric formats. For more information, see Metrics Formats.
Metrics sources
Metrics reported with a timestamp older than 24 hours ago or newer than 24 hours in the future from the time they are reported are dropped.
Currently available metric sources are:
-
HTTP Logs and Metrics source. You can use an HTTP source on hosted collector to collect Graphite, Carbon 2.0, and Prometheus metrics from environments where it is impractical to deploy an installed collector.
-
Host Metrics source. You can use a host metrics source on an installed collector to collect CPU, memory, TCP, networking, and disk metrics on Linux and Windows machines.
-
Amazon CloudWatch Source for Metrics. You can use a CloudWatch source on a hosted collector to collect metrics for a variety of AWS resources.
-
AWS Kinesis Firehose for Metrics Source. You can use the AWS Kinesis Firehose for Metrics source to ingest CloudWatch metrics from Amazon Kinesis Data Firehose.
-
Streaming Metrics Source. You can use Sumo’s streaming metrics source with an installed collector to collect metrics over TCP or UDP in Graphite, Carbon 2.0, or Prometheus format.
-
AWS Metadata (Tag) Source for Metrics. This is a special type of source, in that it doesn’t collect metrics, but instead collects tags from EC2 instances running on AWS. Sumo applies the collected tags to metrics ingested by two Sumo source types: the streaming metric source and the host metrics source. Tagging metrics with the EC2 tags allows you to query metrics using EC2 tags.
-
Docker Stats source. You can use the Docker Stats source on an installed collector to collect Docker container metrics, such as CPU usage, Memory usage, Network IO, and Disk IO.
Metrics rules editor
You can can use Sumo’s metric rules editor to tag metrics with key-value pairs derived from the metrics. Then, you can use those key-value pairs in metric queries. This is especially useful if you ingest Graphite-formatted metrics. For example, given a Graphite metric like this one:
cluster-1.node-1.cpu-1.cpu-idle 97.29 1460061337
You can use the rules editor to tag the metric with these key-value pairs:
cluster = cluster-1
node = node-1
cpu = cpu-1
measurement = cpu-idle
Sumo creates a key-value pair for each dot-separated segment of the metric path. This makes it a lot easier to query Graphite metrics.
For more information, see About Metrics Rules.
Metrics queries
Classic UI. To access Metrics Explorer, go to the Home screen and select Metrics.
New UI. To access Metrics Explorer, in the main Sumo Logic menu select Observability, and then under Metrics select Metrics Search. You can also click the Go To... menu at the top of the screen and select Metrics Search.
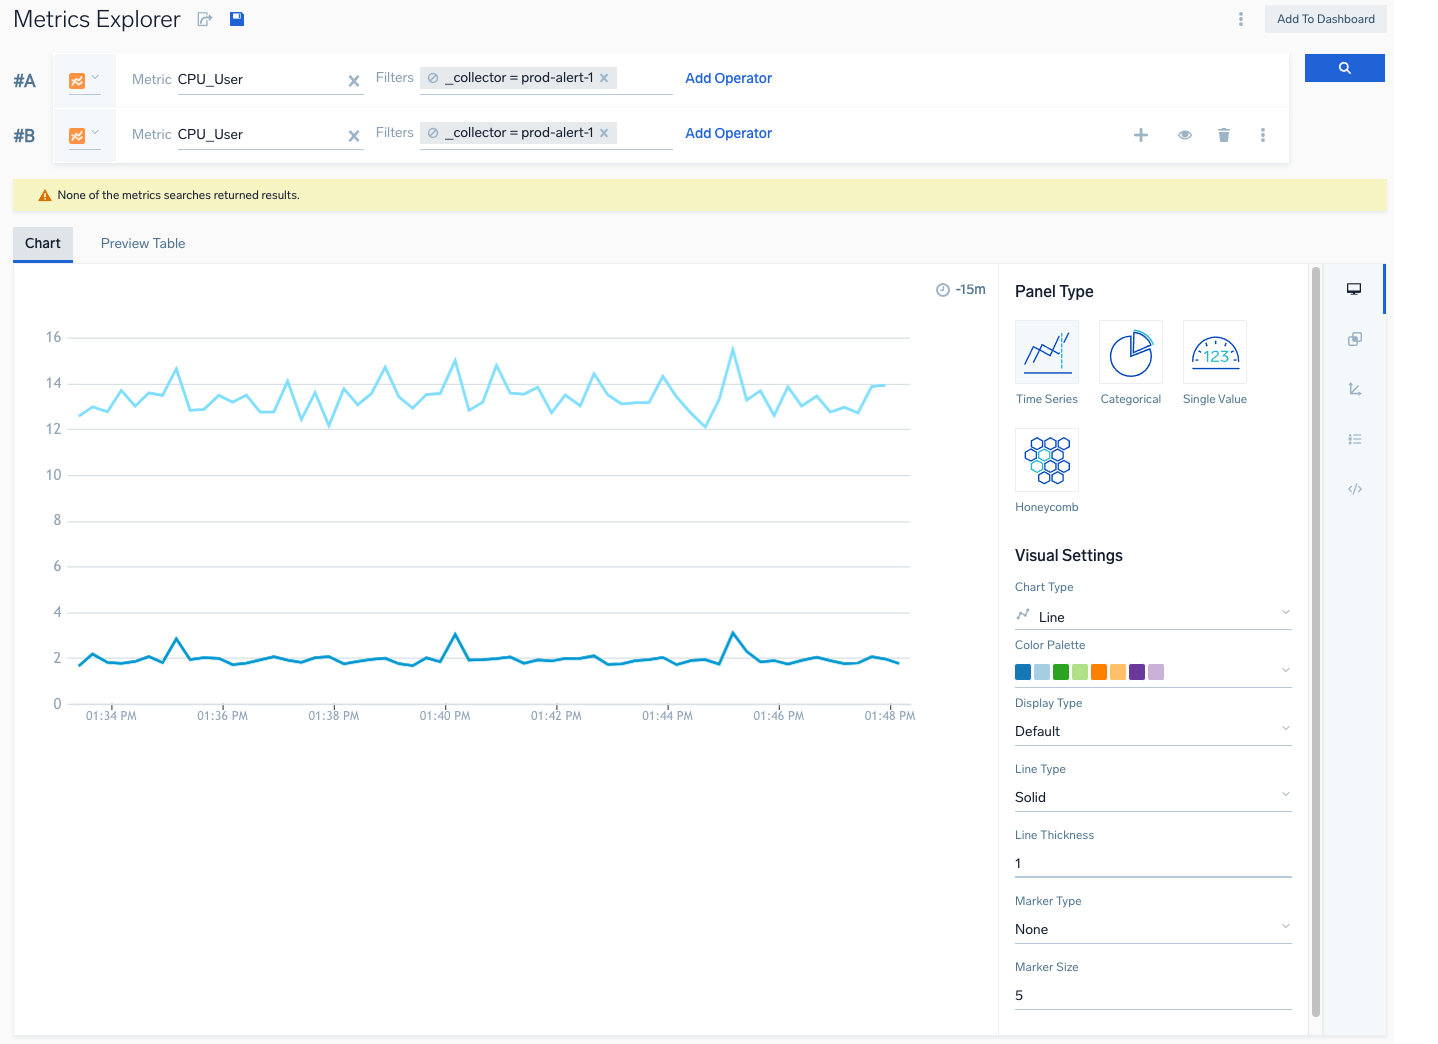
In the screenshot below, the Metrics Explorer shows the results of two queries.
What’s in a metric query?
A metric query consists of a metric, one or more filters and optionally, one or more metric operators. Strictly speaking, both filters and operators are optional. In practice, your metric queries will almost always contain filters that narrow the scope of your query.
Metric
When you create a metric query in the Metrics Explorer, the first thing you do is select a metric. When you click in the Metrics field, a list of metrics appears.
Filters
Filters, sometimes referred to as selectors, narrow the scope of your query. If you do not include one or more filters in a metric query or apply an aggregation operator, it's possible that the query will return too many results to display. A filter can be one or more key-value pairs, or a keyword string, or a combination of key-value pairs and keywords. When you click in the Filters field, a list of metadata fields appears, for example, _sourceCategory, _collector, availabilityzone, and so on. After you select a metadata field, a list of values appear. Here are two examples of filters:
cluster=cluster-1 node=node-1 cpu=cpu-1 metric=cpu-idle_sourceCategory=hostmetrics
Operators
You can use metric operators of various sorts to process the metric data that matches your selectors. For example, you can use aggregation operators like avg, max, min, sum, and count; statistical operators like pct and rate; and select time series that have the highest or lowest values of a particular metric using topk and bottomk.
For more information, see Metrics Operators.
Creating a query
For instructions on how to create a metric query, see Metrics Explorer.
Metricmonitors
You can configure a metric monitor for a metric query so that Sumo will send an alert notification, when the query results match the rules that you define for the monitor. There are two notification types: email and webhook.
You can set up several types of monitors: Critical, Warning, and Missing Data. Critical and Warning result in value-based alerts—they are triggered when a metric in a time series varies from a threshold for a specified period of time. A Missing Data monitor triggers an alert when no data is received for a specified period of time.
For more information, see Monitors.
Metrics throttling
With Sumo metrics, an account has Data Points per Minute (DPM) limit, which is shown on the Account Page in the Sumo web app. To allow for spikes in metrics ingestion, Sumo applies a multiplier to your DPM limit to allow you send metrics at a higher rate, referred as your DPM burst limit, before Sumo starts to throttle your sources. The multiplier depends on your daily DPM account limit. When you exceed your DPM burst limit, Sumo throttles your metric sources—your ingestion will be slowed down until the rate of ingestion returns is within the allowable contracted limits. For more information, see Metrics Throttling.
Metrics ingest data volume index
An account’s metrics ingestion volume in data points is tracked in Sumo’s metrics ingest data volume index. You can query the index to see the total data points that were ingested over a time range, by collector, source, source name, source category, and source host. For more information, see Metrics Ingest Data Volume Index.
Guides
In this section, we'll introduce the following concepts:
📄️ Getting Started
Learn how to get started with metrics and create your first visualization.
📄️ Built-in Metadata
Learn about the metadata attached to metrics.
📄️ Metrics Formats
Sumo Logic supports the Graphite, Carbon 2.0, and Prometheus metric formats.
📄️ Join Queries
You can join metrics queries to combine, compare, and perform operations on the multiple queries’ results.
📄️ Metrics Histograms
This document provides information on how to use histograms to calculate percentiles.
📄️ Metrics Quantization
Learn about how Sumo aggregates metric data points over time buckets.