Metrics Histograms
Histograms are data structures that aggregate potentially unlimited numbers of measurements. They allow for the calculation of percentiles with a certain accuracy (>=95% in this case), as well as other aggregations such as avg, sum, count, min, and max. This means you can quickly and easily analyze large amounts of data and get insights into its distribution.
Some of the reasons to use Histograms:
- It is capable of accurately computing any percentile.
- It can be safely combined with other histograms using specific query methods.
- Histograms are more efficient than aggregating pre-computed raw percentiles.
- They store an approximate representation of the data that provides enough information to calculate percentiles with the specified accuracy, as well as exact values for other aggregations such as average, sum, count, minimum, and maximum.
To use histograms in your metrics queries, you'll need to include metric.type=exponential_histogram in the selector part of the query. You can then use operators like quantize, pct(<p>) to calculate percentiles for each time series separately or aggregated by selected dimensions.
Syntax
To query histogram data, it is necessary to include metric.type=exponential_histogram in the selector part of the query. The following syntax is used:
<selector> metric.type=exponential_histogram [| <operator>]*
where <operator> typically is:
quantize to pct(<p>). To calculate the desired percentile for each time series separately.pct(<p>) by <dimensions>. To calculate desired percentile aggregated by selected dimension(s).pct(<p>). To calculate desired percentile for all time series aggregated.
Note that <p> should be replaced with the desired percentile value, such as 50 for the 50th percentile or 99 for the 99th percentile. These operators allow you to specify the percentile you want to calculate, as well as any dimensions you want to aggregate by.
Here's an example of what your metrics query might look like:
_sourceCategory="MetricFromTrace" service="productcatalogservice" metric.type=exponential_histogram | quantize to 1m using histogram
This query selects data from a specific source category and service, and then calculates a histogram using exponential binning. It then quantizes the data to 1-minute intervals using the histogram.
The histogram below shows the distribution of values over time for the selected metric.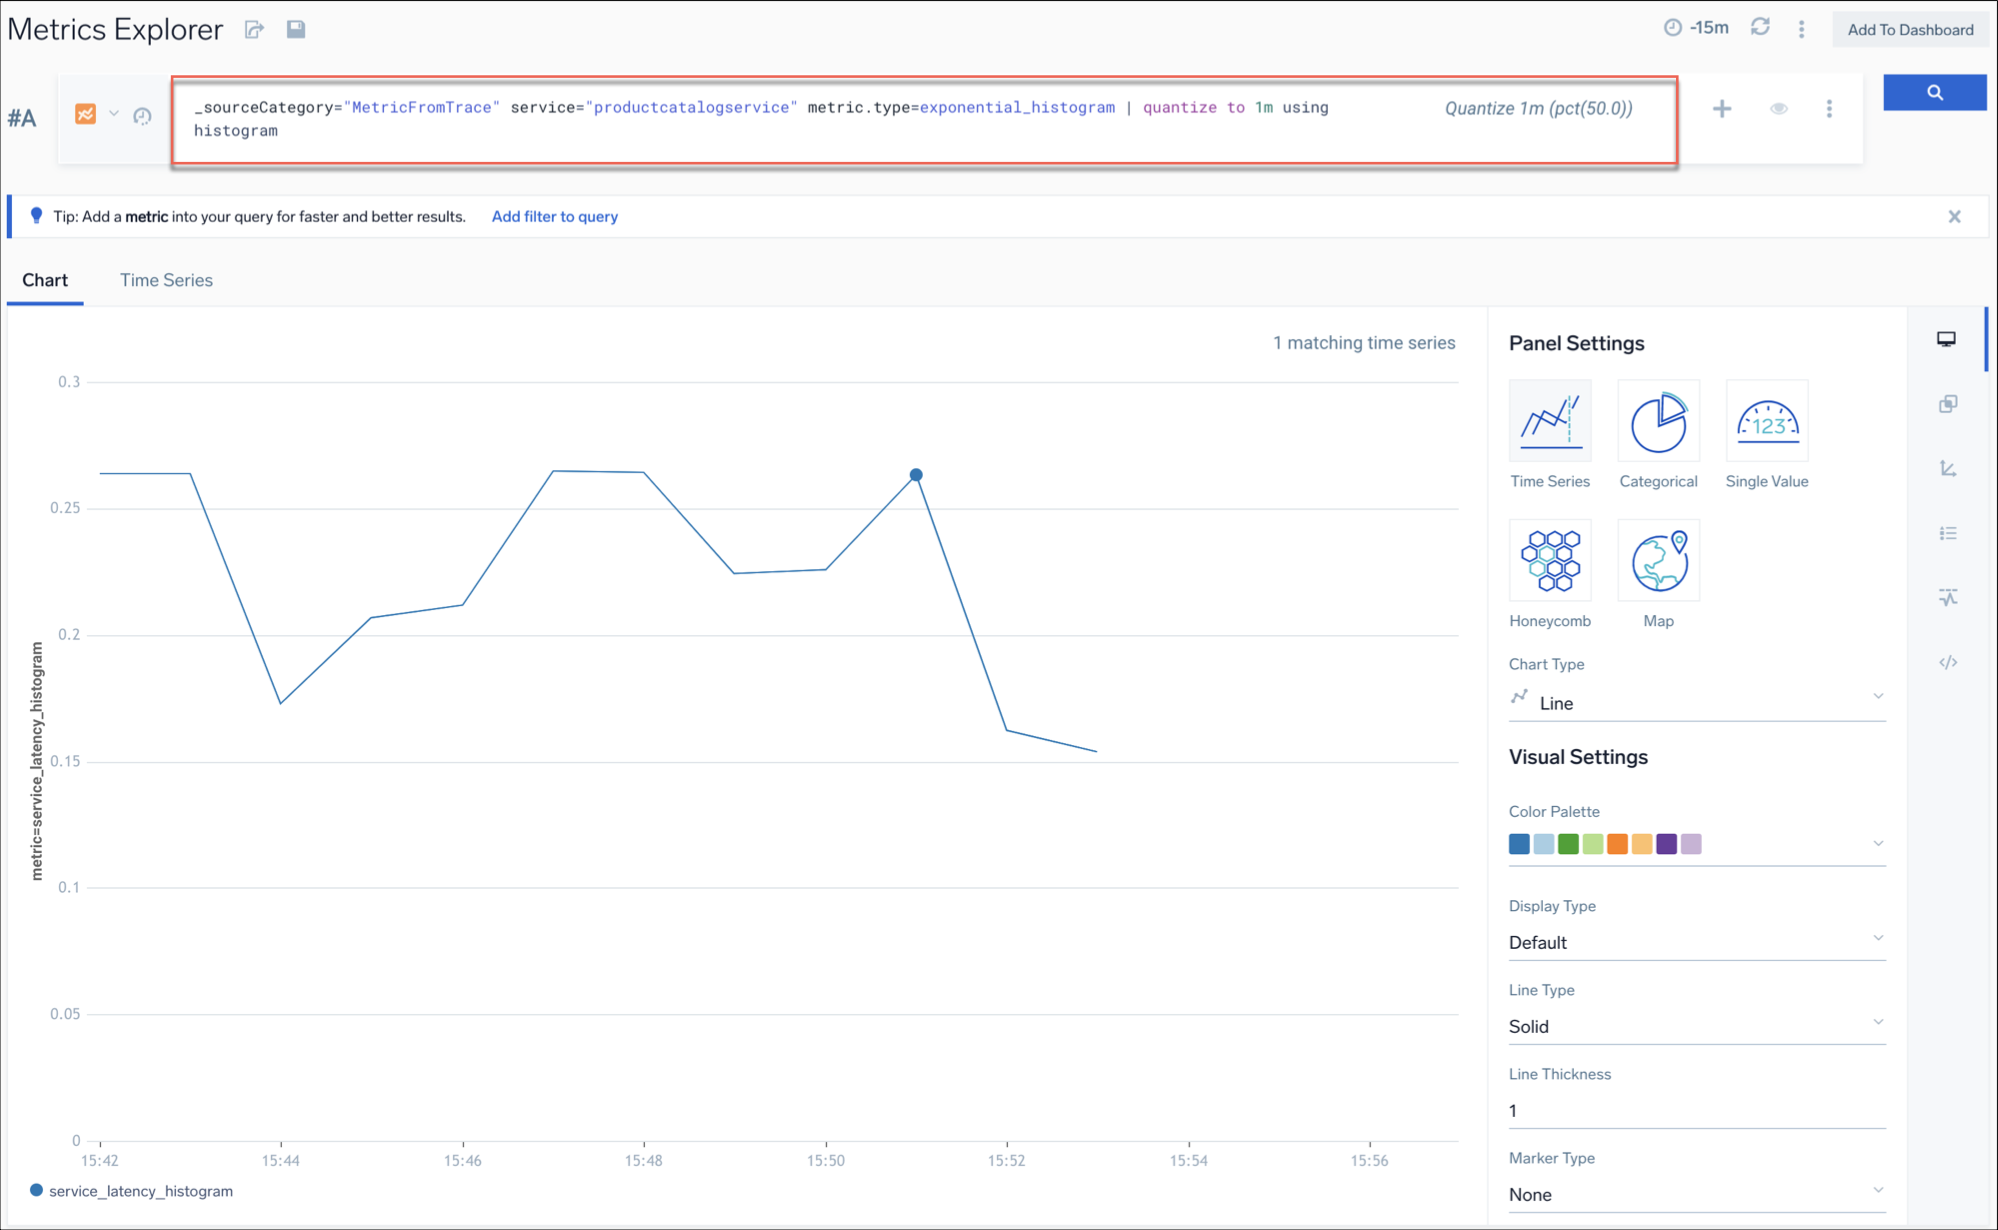 .
.
Why use histograms?
With histograms, you do not need to predefine any special cases for calculating percentiles. You can use the histogram to compute any percentile based on the raw measurements captured. Moreover, querying histograms is efficient and space-saving as compared to storing all the raw data.
Querying histograms
When querying histogram data in Sumo Logic, you can use the metric.type=exponential_histogram selector to indicate that you are working with histogram data. You can then use operators such as quantize using pct() to calculate percentiles, or count() to count the total number of data points.
However, this dimension has certain limitations, including:
- It can only appear once in the selector.
- It cannot be used in an OR statement.
- It does not support wildcards.
As a result, it is not possible to access both histogram and non-histogram data in a single query.
Currently, the only metric types that generate histograms in Sumo Logic are APM and RUM metrics used in Application Service APM/Tracing Dashboards and RUM Dashboards. Specifically, these are metrics of the _contenttype=metricfromtrace and _contenttype=rummetricfromtrace types.
Calculating percentiles
Percentiles are an important metric used in analyzing data, and histograms are particularly useful in calculating them.
To calculate a percentile for each histogram individually, use pct quantization by including quantize using pct(50) in your query.
This will calculate the 50th percentile for each histogram, taking all existing dimensions into account.
Method of Calculating Percentiles in Histogram
To calculate percentiles for the histograms, you can use three different methods: calculating percentiles individually for each histogram, grouping histograms by a specific parameter, and aggregating histograms.
Consider you have the following four dataset with histograms, each associated with a specific browser type, a countryCode, and raw measurements to calculate the percentiles in histograms.
| metric | browser | countryCode | value (raw measurements used to create the histogram) |
|---|---|---|---|
| browser_cls_histogram | Chrome 109 | POL | 1000, 2000, 3000 |
| browser_cls_histogram | Safari 16 | POL | 500, 3100 |
| browser_cls_histogram | Chrome 109 | USA | 200, 750, 1000 |
| browser_cls_histogram | Safari 16 | USA | 50, 100, 750, 755, 800 |
Individual histograms
To calculate the 50th percentile for each histogram individually, use pct_50 quantization. The examples below illustrate how to apply this method to calculate the 50th percentile for each histogram.
Example 1. Consider a histogram browser_cls_histogram for Chrome 109 in Poland with raw measurements of 1000, 2000, 3000.
| metric | browser | countryCode | value |
|---|---|---|---|
| browser_cls_histogram | Chrome 109 | POL | 1000, 2000, 3000 |
To calculate the 50th percentile for this histogram, you can run the following query:
metric=browser_cls_histogram metric.type=exponential_histogram | quantize using pct(50)
The query uses the browser_cls_histogram metric and specifies that it is an exponential_histogram type. The quantize using pct(50) part of the query specifies that the 50th percentile should be calculated for each histogram.
Output. The result will be.
| metric | countryCode | pct_50.0 |
|---|---|---|
| browser_cls_histogram | POL | 2000± 5% |
Example 2. Consider a browser_cls_histogram histogram for Safari 16 in the USA with raw measurements of 500 and 3100.
| metric | browser | countryCode | value |
|---|---|---|---|
| browser_cls_histogram | Safari 16 | POL | 500, 3100 |
To calculate the 50th percentile for this histogram, you can use the following query:
metric=browser_cls_histogram metric.type=exponential_histogram metric=browser_cls_histogram | quantize using pct(50)
Output. The result will be.
| metric | browser | countryCode | value |
|---|---|---|---|
| browser_cls_histogram | Safari 16 | POL | 1800 ± 5% |
Percentiles grouped by a specific dimension
Grouping histograms based on a specific attribute, such as browser type or countryCode, allows for percentile calculations to be made for each group, enabling comparisons between groups and identification of patterns in the data. To calculate percentiles for data grouped by a specific dimension, use histogram quantization in the selector part of the query.
Example. For the same 4 data sets of histograms, calculate percentiles for for data that is grouped by a specific dimension returned by the selector part of the query using histogram quantization.
To calculate the 50th percentile for all histograms grouped by country code, you can use the following query:
metric.type=exponential_histogram metric=browser_cls_histogram | pct(50) by countryCode
The query uses the browser_cls_histogram metric and specifies that it is an exponential_histogram type. The pct(50) by countryCode part of the query specifies that the 50th percentile should be calculated for each histogram grouped by countryCode.
Output. The result will be. It will return 50th percentile latencies for each country.
| metric | countryCode | pct_50.0 |
|---|---|---|
| pct_50.0 | POL | 2000 ± 5% |
| pct_50.0 | USA | 750 ± 5% |
Aggregated percentile for all histograms
Collapsing all the histograms with the same parameters (such as browser type and countryCode) into a single histogram, with the raw measurements values from each individual histogram combined together. This allows for calculating the percentile across all the data, rather than for each individual histogram separately.
Example. For the same 4 data sets of histograms, calculate the percentiles for all histograms returned by the selector part of the query using histogram quantization.
To calculate the 50th percentile (p50) for the browser_cls_histogram metric, aggregated by browser and countryCode. You can use the following query.
metric.type=exponential_histogram metric=browser_cls_histogram | pct(50)
The query uses the browser_cls_histogram metric and specifies that it is an exponential_histogram type. The pct(50) part of the query specifies that the 50th percentile should be calculated for all histograms.
Output. The result will be. It shows the calculated value of the aggregated 50th percentile with a 5% margin of error for all histograms.
| metric | value |
|---|---|
| pct_50.0 | 750 ± 5% |
Additional supported quantization methods
Histograms support a variety of quantizations such as avg, min, max, sum, count, and rate in addition to histogram and pct. The following aggregations can also be calculated on top of histogram data:
avgminmaxsumcountpct
Example. To calculate the average of all raw measurements used to create the histogram for each histogram and bucket using the avg quantization and a 10-minute long quantization bucket, you can use the following query.
metric.type=exponential_histogram metric=browser_cls_histogram | quantize to 10m using avg
This query creates quantization buckets that are 10 minutes long and returns the average of all raw measurements used to create the histogram for each histogram and bucket. This can be useful when you want to get an idea of the average value of the data over a certain time period. The 10-minute long quantization buckets allow you to easily see the average value of the data over that time period.
Similarly, using the max aggregation, you can return the maximum value across all the raw measurements.
For example, to find the maximum value for a browser_cls_histogram with exponential histogram type, you can use a query like:
metric.type=exponential_histogram metric=browser_cls_histogram | max
This query returns the maximum value across all the raw measurements used to create the histogram. In other words, for each histogram, it returns the highest value of the raw data that was collected for that histogram. This can be useful to quickly identify the highest values in a dataset or to monitor for any spikes or anomalies in the data.
Limitations
Histogram type metrics support a limited set of operators and statements, which are:
quantize using histogram or pct(), avg, min, max, count, and rate.- aggregation:
avg,min,max,sum,count.
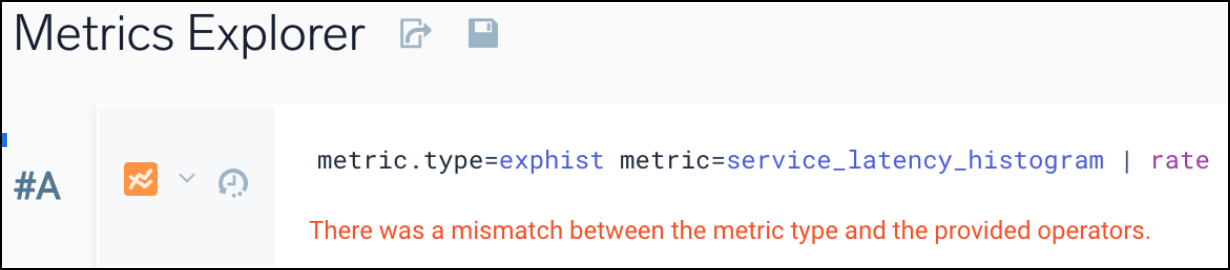
Using any unsupported operator will result in a query failure.
However, you can use other operators after applying a histogram operator. For example, you can use the pct(99) operator with a histogram metric and filter the results based on a specific threshold by running this query.
metric.type=exponential_histogram metric=browser_cls_histogram | quantize using pct(99) | where _value > 2000
Note that this query uses the metric.type=exponential_histogram selector to retrieve the histogram data, and then applies the quantize using pct(99) operator to calculate the 99th percentile for each time series in the histogram. Therefore, the where _value > 2000 clause filters the results to show only time series whose value is greater than 2000.