Logs-to-Metrics
The Logs-to-Metrics feature allows you to extract or create metrics from log data:
- You can extract metrics that are embedded in logs. For example, your logs might contain numerical values for latency, bytes sent, request time, and so on. You can extract multiple metrics from a single log.
- You can count logs as a metric. For example, you might count the number of log messages that contain a 404 status code.
You can use the above methods in combination: you can extract metrics from logs, and also count them to create a new metric.
Once you have extracted or created metrics from your log data, you can use them like any other metrics in Sumo. You can run metric queries on them, include those queries in dashboards, and set monitors on them.
Logs-to-Metrics best practices and limitations
This section describes best practices and limitations that apply to Logs-to-Metrics rules.
No aggregations or timeslicing
Aggregation operators and timeslicing are not supported in the parse expression for a Logs-to-Metrics rule.
Role search filters do not apply to Logs-to-Metrics rules
Only users with the admin role or with a role that provides the Manage Logs-to-Metrics capability can create Logs-to-Metrics rules. The role search filter of the user that creates a Logs-to-Metrics rule is not applied to the results of returned by the rule. For this reason, it is a best practice to be judicious in granting the Manage Logs-to-Metrics capability.
Manage metric cardinality
Avoid extracting metrics that contain too many unique groupings or contain dimensions that grow indefinitely, such as session IDs. For example, if you are trying to track API calls for 10,000 customers, 4 request types and 2 status codes, the metric rule could potentially create 10,000 x 4 x 2 = 80,000 unique time series (that is, 8 metrics to track per customer: count of successes/failures for each request type).
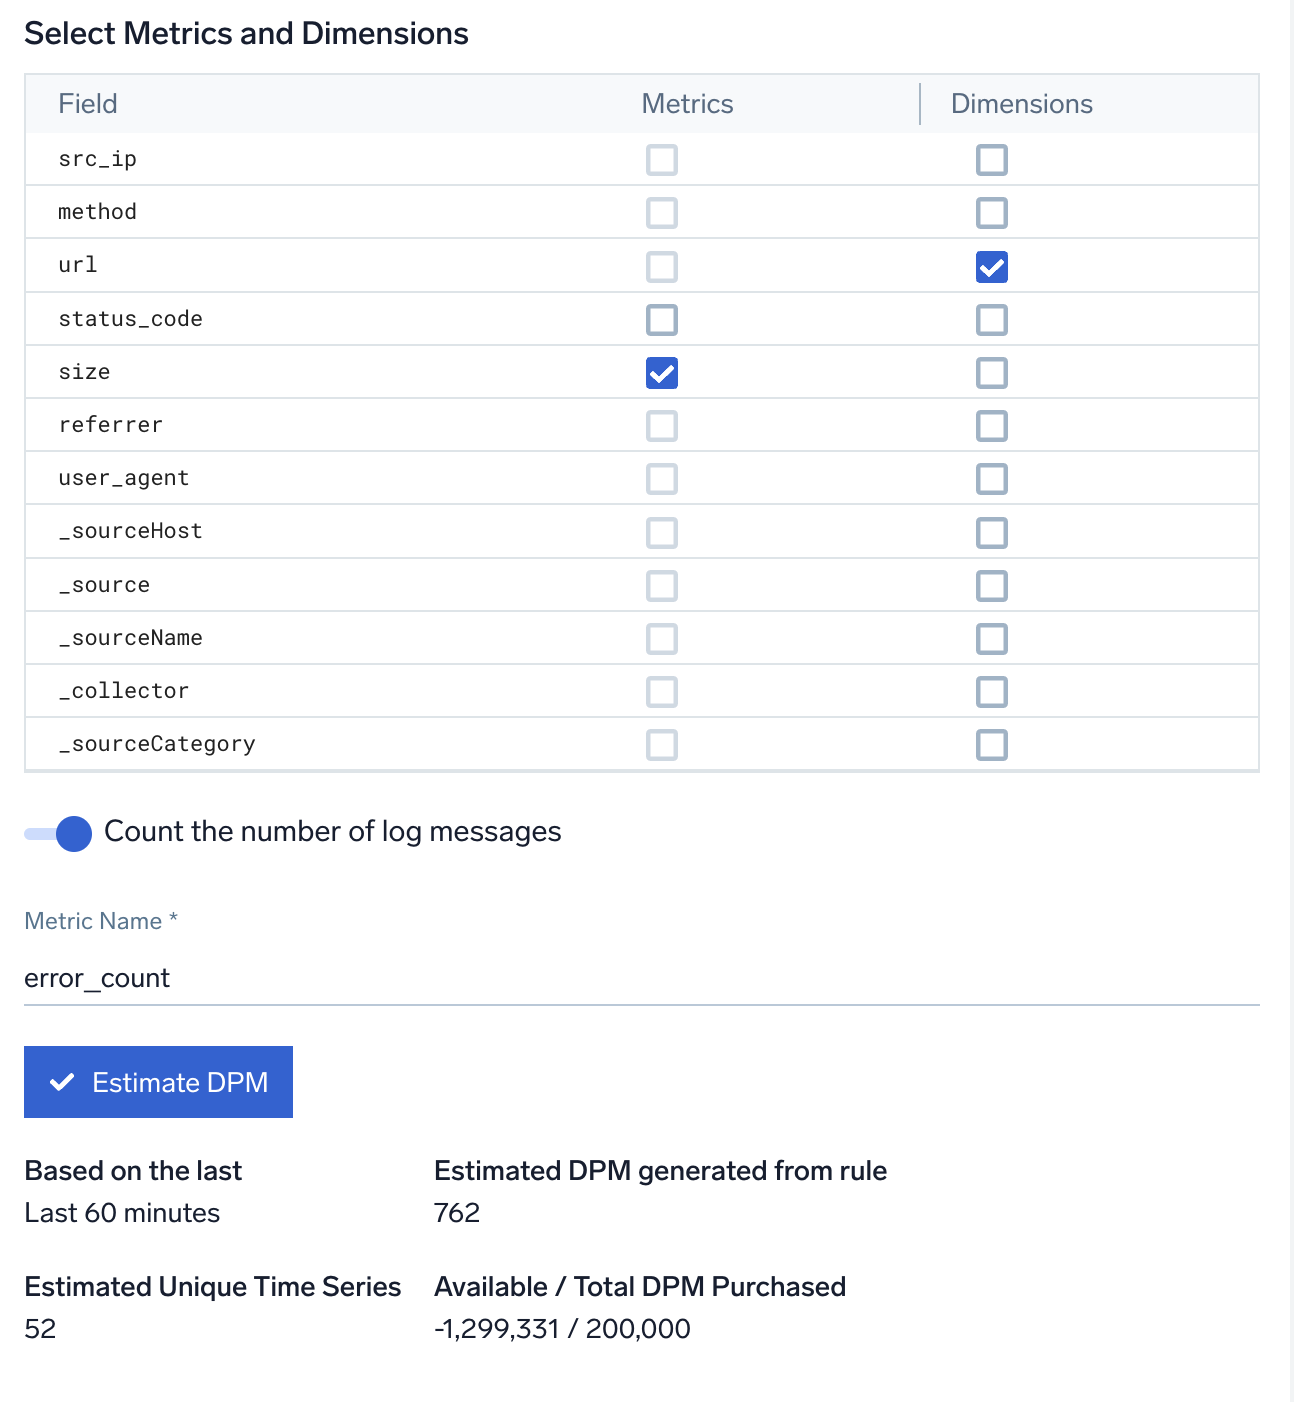
When you create a Logs-to-Metrics rule, you can test it to see how many metrics it would have created in the last 60 minutes.
When you create a Logs-to-Metrics rule, you select the metrics and dimensions the rule will extract from messages that match the rule's parse expression. You should not select a timestamp field as a dimension—a timestamp is inherently high cardinality, and Sumo Logic will disable a Logs-to-Metrics rule that specifies a timestamp field as a dimension.
Long dimension values
A logs-to-metrics rule will not create a metric dimension value longer than 250 characters. If your rule extracts a metric dimension value longer than 250 characters, the metric will not be created. A message like this will be written to the Sumo Logic Audit Index:
Extracted dimension values for keys <dimensions> have more than 250 characters for logs-to-metrics rule <rule-name>
Metric volume limits and rule disabling
Sumo will not allow you to save a Logs-to-Metrics rule that results in more than 30,000 unique time series.
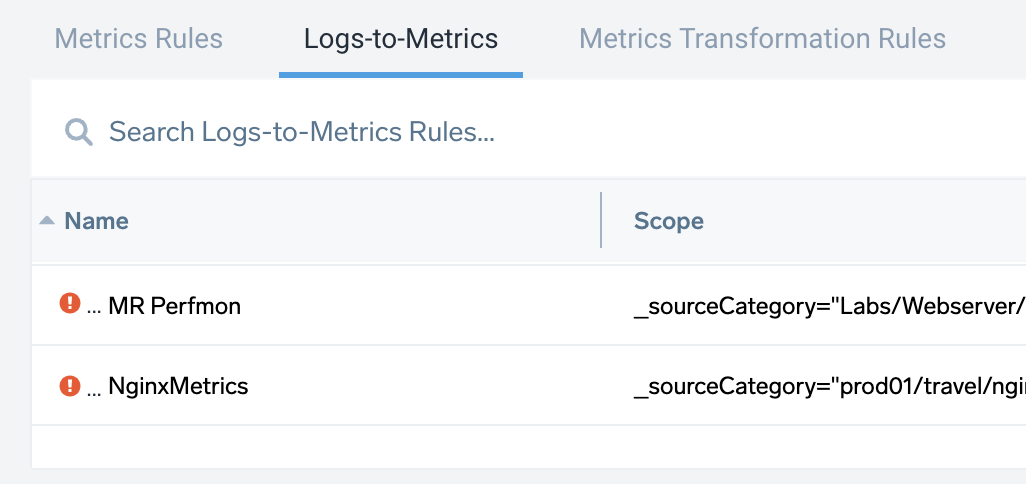
If, over time, the volume of unique time series returned by a Logs-to-Metrics rule grows to more than 30,000, Sumo will disable the rule. You can see that a rule is disabled on the Logs-to-Metrics page: a red icon appears to the left of the rule name.
Audit logging
When a Logs-to-Metrics rule is disabled, Sumo Logic generates a Health Event and writes a message with level “error ” to the Audit Event Index.
The Health Event is named LogsToMetricsRuleDisableded.
The message written to the Audit Event Index is:
{"status":"UnHealthy","details":{"trackerId":"LogsToMetricsRuleDisabled","error":"Logs-to-metrics rule disabled due to high cardinality","description":"This logs-to-metrics rule has generated too many unique time series and has been disabled."},"eventType":"Health-Change","severityLevel":"Error","accountId":"000000000AEA0D07","eventId":"d123bb91-552c-42f4-99b5-c57f14c9ceea","eventName":"LogsToMetricsRuleDisabled","eventTime":"2020-08-01T09:58:09.492Z","eventFormatVersion":"1.0 beta","subsystem":"Metrics","resourceIdentity":{"id":"000000000000D213","name":"Customers requests","type":"Rule"}}
Re-enabling a Logs-to-Metrics rule
You can re-enable the Logs-to-Metrics rule by modifying the list of extracted fields. If you open a Logs-to-Metrics rule for editing, and change the extracted fields, it will be re-enabled.
Field extraction rules are not supported
Logs-to-Metrics will not work with fields created from field extraction rules (FERs), since it occurs earlier in the ingestion pipeline. If you would like to use fields from an FER in your scope or parse expression, you will need to reparse those specific fields.
Logs-to-Metrics is not retroactive
Once you save a Logs-to-Metrics rule, Sumo will commence creating metrics. Sumo does not apply your rule to logs that have previously been ingested.
Supported and unsupported parsing operators
Not all Sumo parsing operators are supported. For more information, see Create a Logs-to-Metrics rule.
Scheduled views and indexes are not supported
You cannot use a scheduled view or an index in the scope of a Logs-to-Metrics rule. In other words, you shouldn't use a log search scope that includes _view or _index.
Using Logs-to-Metrics for partitions not included in default scope
In the data tier model, frequent and infrequent partitions are excluded from the default search scope. However, if your organization is configured for the flex pricing model, you can selectively choose which partitions to include or exclude from the default search scope.
For cases involving partitions that fall outside the default scope, you can create a Logs-to-Metrics rule for the frequent tier partition, infrequent tier partition, or for the partitions excluded in the flex pricing model. To do this, set the rule using the same log search scope as the partition where the data resides.
For example, if you have a partition with the index _index=foo, and its routing expression is _sourceCategory=foo, you should use the same routing expression, _sourceCategory=foo, when scoping the Logs-to-Metrics rule.
_dataTier search modifier is not supported
The _dataTier search modifier is not supported in Logs-to-Metrics rules.
Enable Logs-to-Metrics rule creation by non-admin users
By default, only Sumo admins can create Logs-to-Metrics rules. To enable this feature for other users you can create a role with the Manage Logs-to-Metrics capability, or add the capability to an existing role. See Create and Manage Roles.
Create a Logs-to-Metrics rule
This section describes how to create a Logs-to-Metrics rule.
You must be a Sumo admin to create a Logs-to-Metrics rule, or have a role with the Manage Logs-to-Metrics capability, as described in the previous section.
-
Classic UI. In the main Sumo Logic menu, select Manage Data > Metrics > Logs-to-Metrics.
New UI. In the top menu, select Configuration, and then under Metrics, select Logs to Metrics. You can also click the Go To... menu at the top of the screen and select Logs to Metrics.
The page displays a list of existing Logs-to-Metrics rules.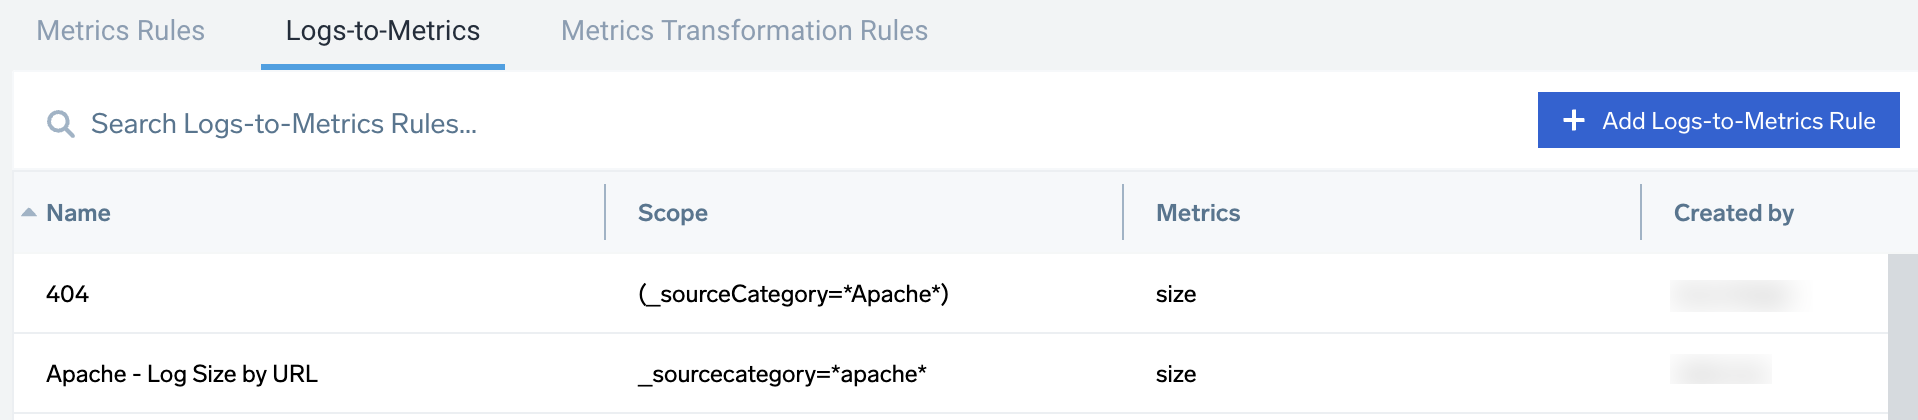
-
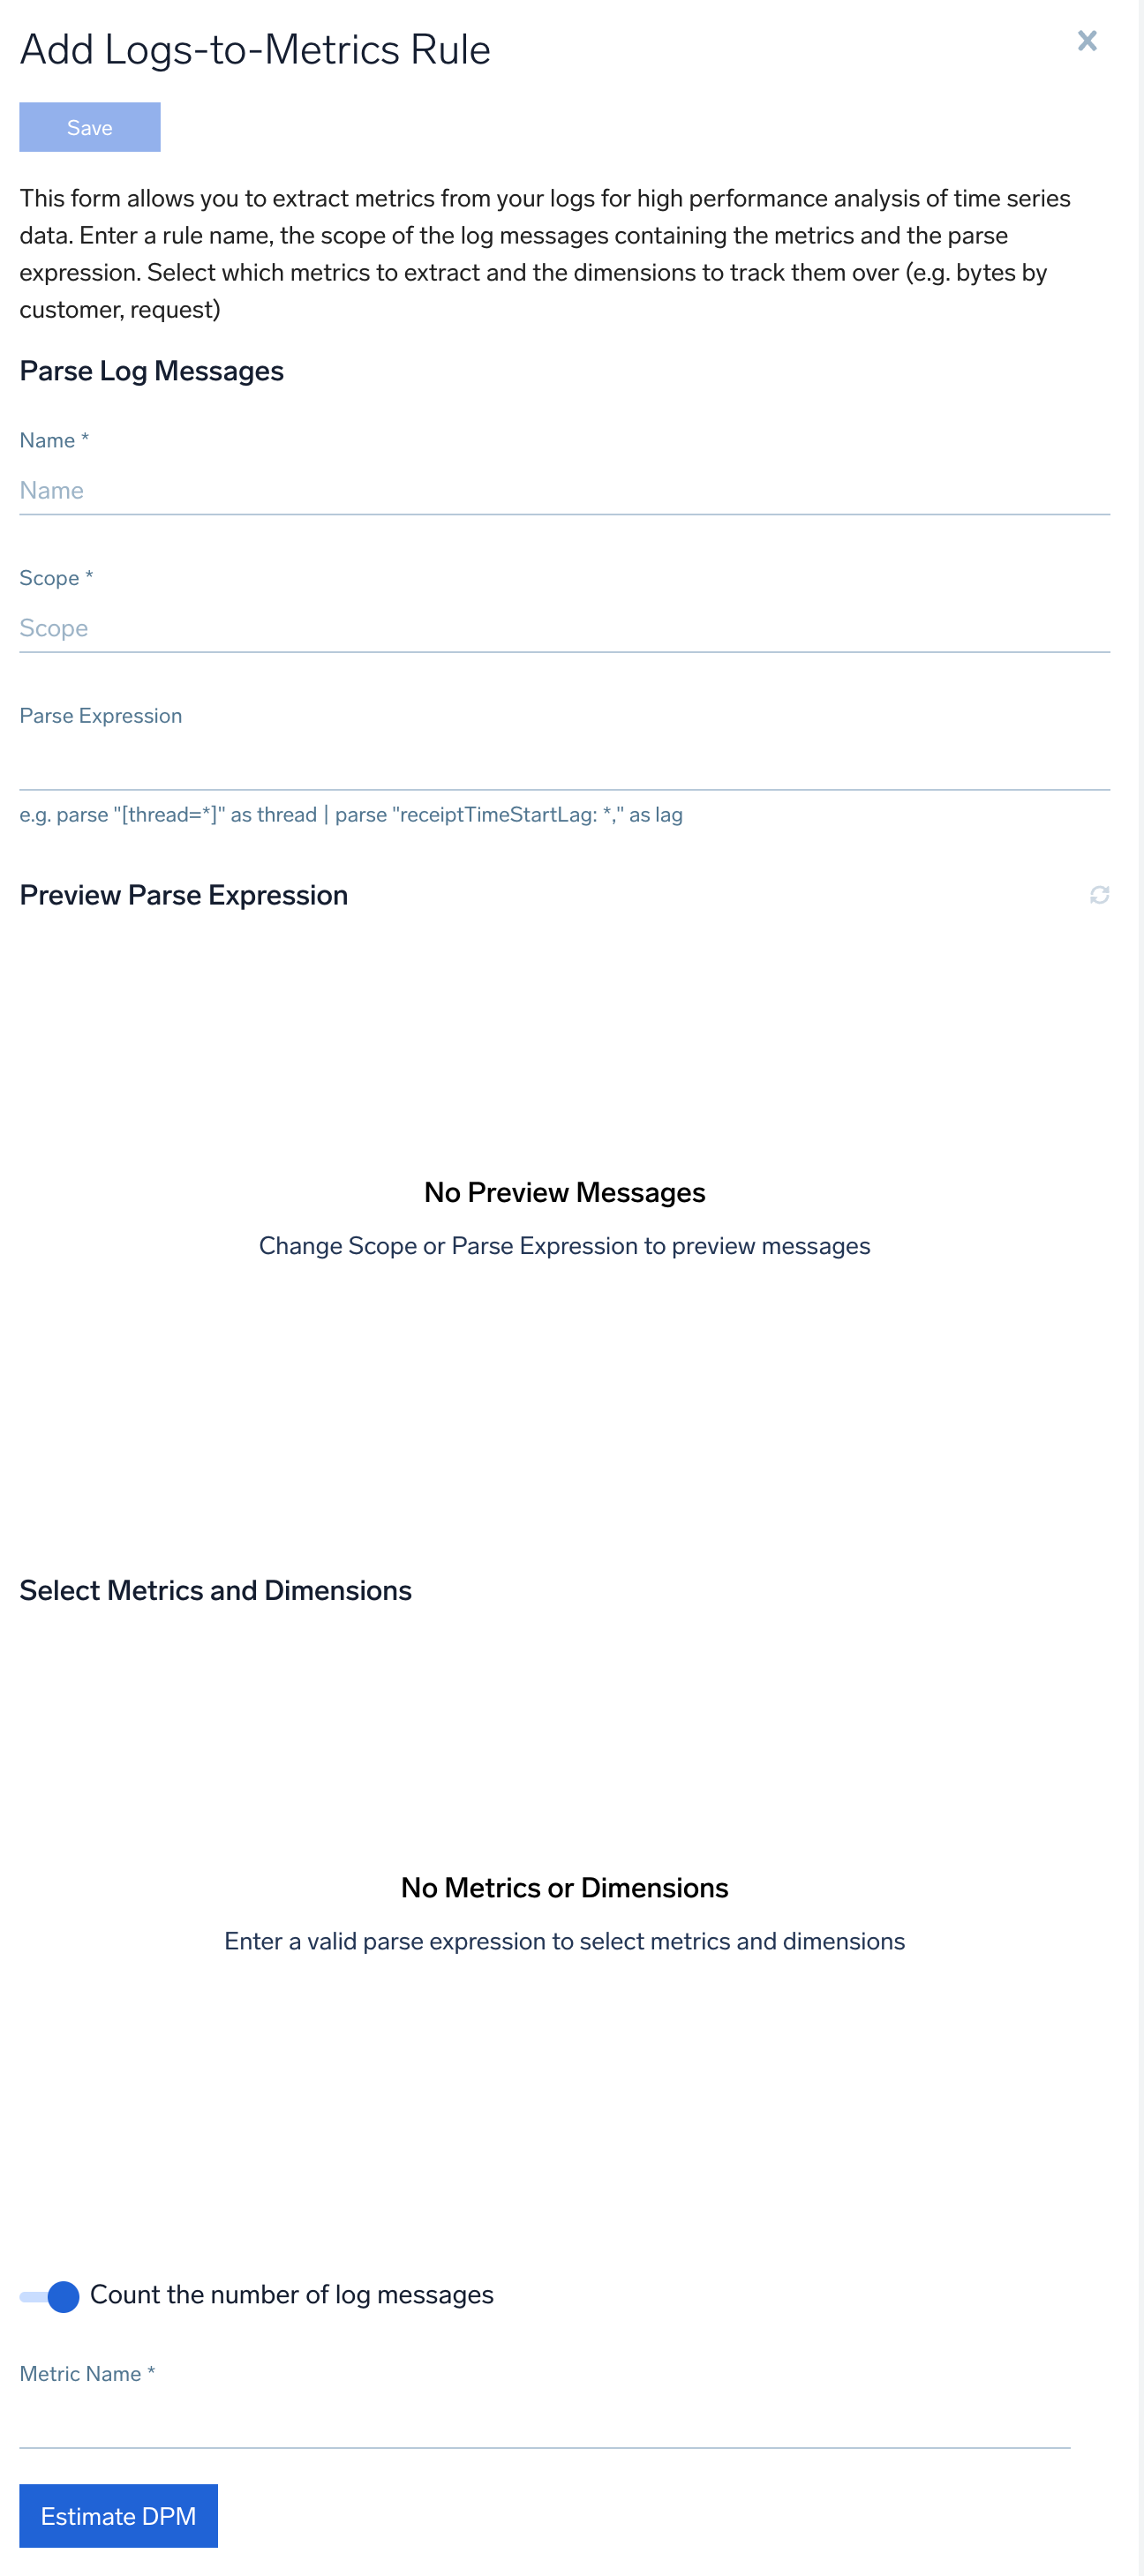
To create a new rule, click Add Logs-to-Metrics Rule in the upper right of the page. The Add Logs-to-Metrics Rule page appears.
-
In the Parse Log Messages section:
-
Name. Specify a rule name.
-
Scope. Enter a query that returns the log messages from which you want to extract or calculate metrics. For best performance, enter a scope that returns only the log messages from which you want to create metrics. For example:
_sourceCategory=alert !info !warn ``errorOnce you enter a valid scope, 10 recent matching log lines appear in the Preview Parse Expression section of the page.noteThe preview pane of parsed messages will respect the role search query of the user creating the rule. However, the Logs-to-Metrics rule will run globally—the rule author’s role search query will not be applied.
-
Parse Expression. Enter a parse expression to extract desired fields from the logs that match the scope query. The parse operators supported in logs to metrics rules are listed below. Other parse operators are not supported.
parse multiparse regexparse anchorparse nodropcsvdoublefieldsjson(except for theautooption)keyvalue
Here is an example of a parse expression:
parse "[hostId=*]" as hostid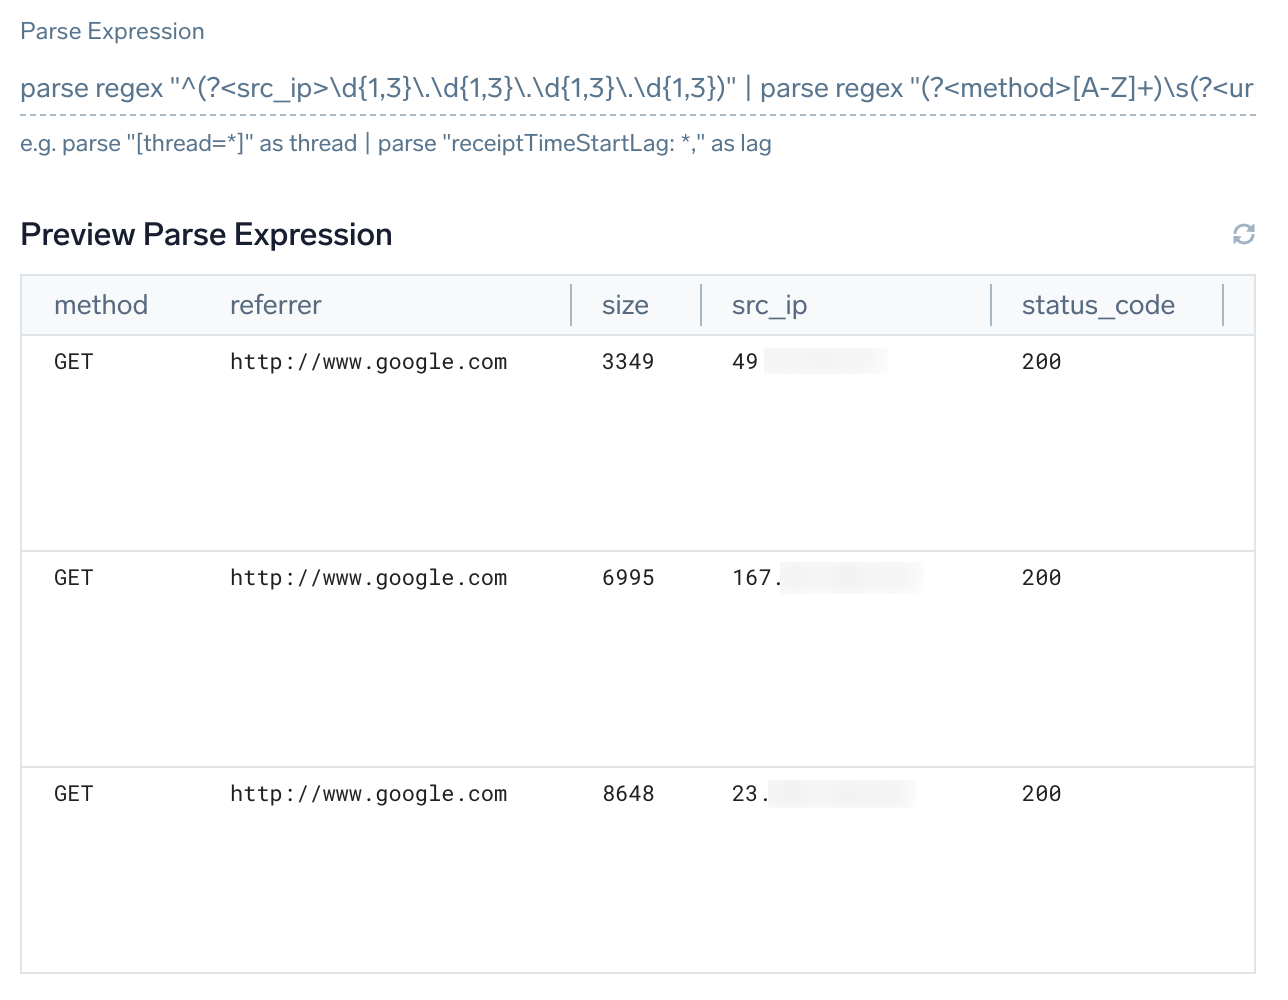
-
-
After you enter a valid parse expression, extracted fields appear in the Select Metrics and Dimensions section of the page. In this section, you define the metrics and dimensions the rule will extract. Note that in addition to any fields you extracted with your parse expression, the following Sumo metadata fields are listed:
_sourceHost_source_sourceName_collector_sourceCategory
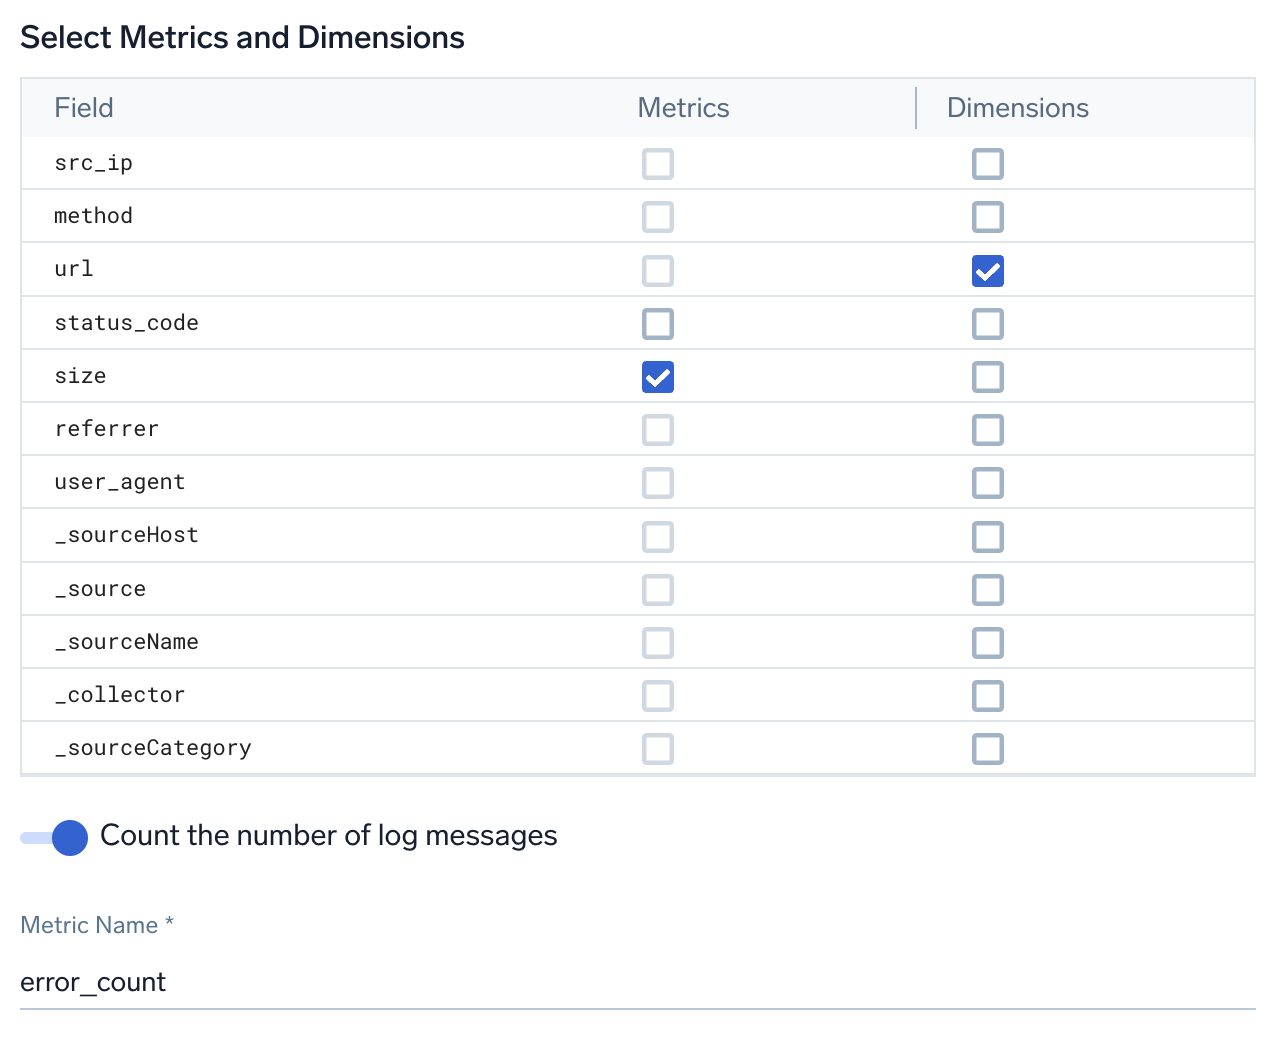
- Click the Metrics checkbox for a field that is a numerical value that you want to plot and analyze, such as latency. You can designate more than one field as a metric, as long as they are both numerical values. On the other hand, if your logs don’t contain embedded metrics, and you are creating a metric based on log count, you will not mark any of the fields as metrics. A field you select as a metric must contain a numerical value, otherwise it will not be extracted.
- Click the Dimensions checkbox for fields by which you’d like to query and aggregate metrics, for example,
hostId. Configuring fields as dimensions is optional. Avoid selecting too many dimensions, as that will increase the number of unique metrics produced from the rule. - Toggle the Count the number of log messages switch on if you want to create a metric that is the total number of log messages that match your scope and parse expression. You can create a calculated metric like this in addition to designating one or more fields as metrics. If you toggle this switch, the page prompts you to enter a name for the metric. When you query a metric that is a count of messages, when you query that metric, you must include a
quantize using sumclause in the query.
-
Click Estimate DPM to see how many data points per minute (DPM) your rule would have created in the last 60 minutes.
-
Click Save to create the rule.