Metrics Data Ingestion
You can view your metrics data ingestion volume on the Metrics Data Ingestion page. This page provides a granular breakdown of your metrics ingestion. You can track consumption by individual metric names, or by specific dimensions and sources. With this data, you can see which sources and metrics contribute most to your credit consumption, and take necessary action.
Understanding the volume of metrics that you are ingesting is important because when you exceed the credit limit, data is cached on the host and the source is throttled, reducing query performance and accuracy. For more information, see Data Limits for Metrics.
Data volume for metrics is often measured in data points per minute (DPM). A data point is an individual piece of data. The total number of data points being sent in a given time can give you a good idea of where the load is heaviest. For example, let's say you want to find out how much data is being sent to metrics from a certain source, host, or source category. You can look at the actual number of individual data points per minute being sent from these to determine whether they are consuming too much metrics bandwidth. Knowing the DPM for these and other kinds of data allows you to monitor your consumption rates.
While you can also see metrics ingestion breakdown in the Metrics dashboard of the Data Volume app, the dashboard only shows volume usage at a source category or source host level. Use the Metrics Data Ingestion screen to get more detailed information.
- To see data volume, you'll need to enable Audit Index.
- How far back in time you can view data is determined by your organization’s retention period for Audit Index. For more information, see Index Retention Period.
View Metrics Data Ingestion
Classic UI. To access the Metrics Data Ingestion page, in the main Sumo Logic menu select Administration > Account > Metrics Data Ingestion.
New UI. To access the Metrics Data Ingestion page, in the Sumo Logic top menu select Administration, and then under Account select Metrics Data Ingestion. You can also click the Go To... menu at the top of the screen and select Metrics Data Ingestion.
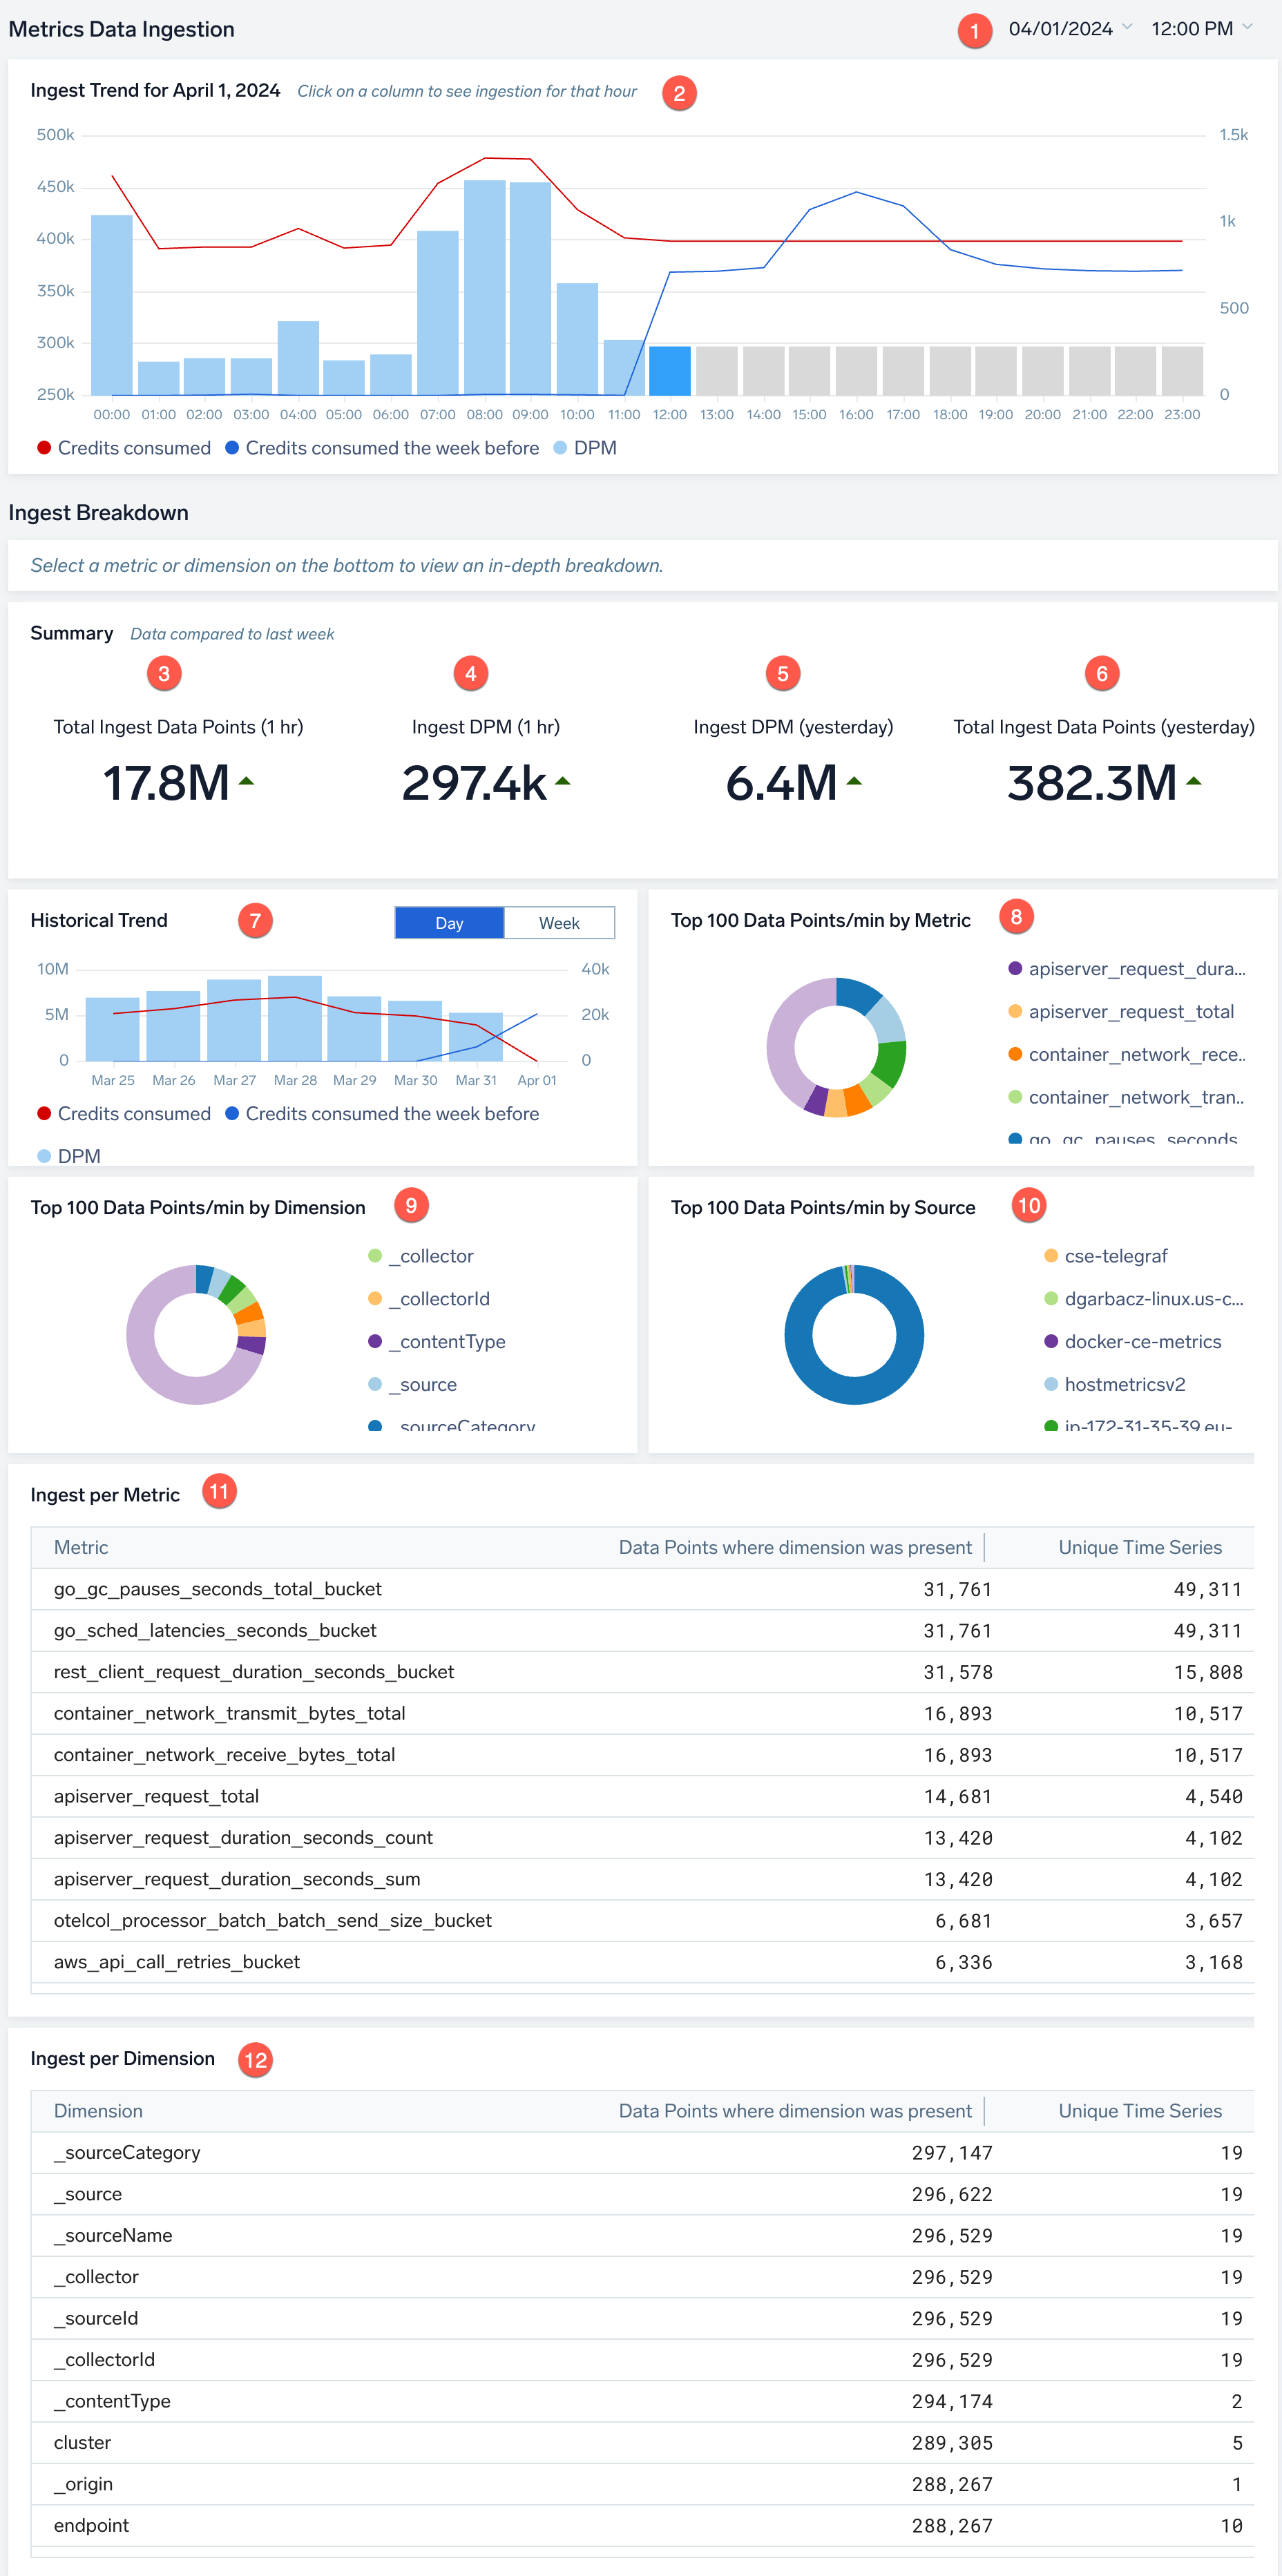
- Date and time. Select a time to see the metrics gathered for the previous hour.
- Ingest Trend for
<date>. The trend for ingest for the current day, broken down by hour. If you hover your mouse over a gray bar, it displays Ingest data for this period is not available yet to indicate that data has not been collected and analyzed yet for that time period. There can be a delay of several hours before data is available. - Metric. Select a specific metric to view its ingest breakdown. Leave blank if you want to view breakdown for all metrics.
- Filter. Select the dimensions for which you want to view ingest breakdown. Leave blank if you want to view all dimensions. (You cannot use the filter if you selected a specific metric in the Metric field.)
- Total Ingest Data Points (1 hr). The total number of data points ingested during the previous hour. The green up arrow indicates the total is higher than the previous hour, and a red down arrow indicates the total is lower than the previous hour. This lets you see at a glance whether volume rates are rising or falling.
- Ingest DPM (1 hr). The data points per minute (DPM) ingested during the previous hour.
- Ingest DPM (yesterday). The average number of data points per minute (DPM) ingested during the previous 24 hours.
- Total Ingest Data Points (yesterday). The total number of data points ingested during the previous 24 hours.
- Historical Trend. The ingest trends over the last day or week.
- Top 100 Data Points/min by Metric. The top metrics that have the highest data points ingested. Click a specific metric on the diagram to see a breakdown of ingest for that metric.
- Top 100 Data Points/min by Dimension. The top data points per minute by dimension. Click a dimension on the diagram to see a breakdown of ingest.
- Top 100 Data Points/min by Source. The top data points per minute by source. Click a source on the diagram to see a breakdown of ingest.
- Ingest per Metric. The breakdown of information about data ingestion per metric. Click a line on the table to view ingest details for the metric.
- Ingest per Dimension. The breakdown of information about data ingestion per dimension. Click a line on the table to view ingest details for the dimension.
Query the sumologic_volume index
You can obtain the same information displayed on the Metrics Data Ingestion screen by querying the sumologic_volume index. Adjust the query as needed to perform custom analysis. Change the time range as needed (for example, to query for the last hour or 24 hours).
Following is an example query that lists the metric names that account for metrics data ingested arranged in descending order based on their DPM contribution.
(_index=sumologic_volume _sourceCategory=byMetricDataPoints)
| parse "intervalStart: *\n" as interval
| parse regex "\n(?<singleRecord>.*)" multi
| split singleRecord delim=';' extract 1 as metric, 2 as dpm
| sum(dpm) as totalDp group by metric
| round(totalDp / 60, 0) as dpm
| order by dpm desc
| fields -totalDp
Following is an example query that computes the average DPM ingestion for a given time period.
(_index=sumologic_volume _sourceCategory=byMetricDataPoints)
| parse "intervalStart: *\n" as interval
| parse regex "\n(?<singleRecord>.*)" multi
| split singleRecord delim=';' extract 1 as metric, 2 as dpCount
| num(dpCount)
| sum(dpCount) as dpm
| round(dpm / 60, 0) as dpm