Metrics Explorer
This page describes the Metrics Explorer UI and how to use it.
About the UI
The Metrics Explorer appears when you open a new metrics tab. The page has two modes:
- Basic. Basic Mode provides a query builder UI: you can construct metric queries by selecting metadata fields, dimensions, metrics, and operators from pull-down lists. This makes it easier to create your search scope and to apply operators to the metrics that are returned. You’ll still want to understand the functionality of metric operators, but the Metrics Explorer helps you by prompting you with a list of available operators, and after you choose an operator, the options or qualifiers that the operator supports.
- Advanced. In Advanced Mode, you can enter free-form metric queries. You can enter your entire query manually, but Advanced Mode will also prompt you with pull-down lists of metadata fields, dimensions, metrics, and operators.
If your query supports basic mode, you can freely move between basic and advanced mode to build and run your query.
Switch between Basic and Advanced Mode
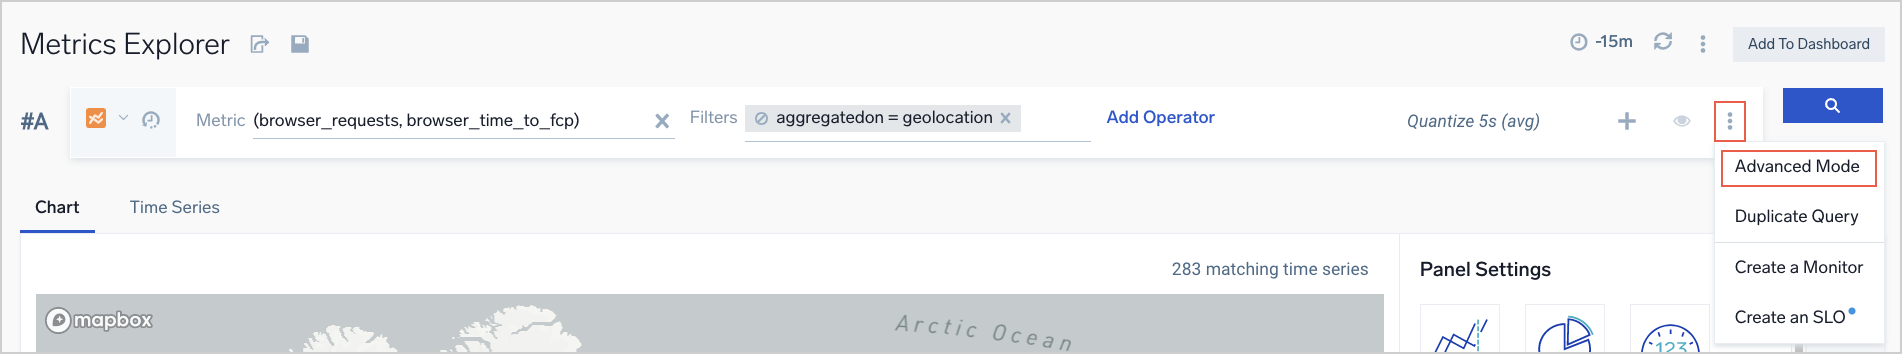
When you open a new Metrics tab, it is displayed in Basic Mode. You can switch to Advanced Mode by clicking the three-dot kebab icon, and selecting Advanced Mode. When you are in Advanced Mode, you can switch back to Basic Mode from the same options menu.
If you use the Advanced Mode to build complex metrics, you can convert it to Basic Mode by selecting the option. If the query cannot support basic mode, you receive a message informing you "Your query cannot be switched to Basic Mode."
Example of queries that will not convert:
metric=CPU_Sys _sourceCategory=autocomplete | bottomk (5, avg + 3 * stddev)This query is not supported becausebottomkin basic mode only supports simple aggregators such asavgorcount. It does not support arbitrary formulas.(metric=CPU_Sys OR metric=CPU_Idle) _sourceCategory=autocompleteThis query is not supported because basic mode does not support logicalORfor the selector part of the query.
When converted, the filters convert allowing you to select and modify, make different selections, remove filters, and add operators as you would normally in Basic Mode.
View Metrics Query History
Every query run by a user is saved in query history (both incorrect and correct queries). You can use the Metrics query history to find your previous metric queries. Both those run in the Metric Tab and the Dashboard panels. Queries as saved and stored in user settings, just like information on hidden columns for Preview Table and open tabs.
When you select a query from the list, it is updated for a query row where you opened query history dropdown. Selected queries from list are adjusted to current query editor mode selected by the user. For example, if you are in Basic mode and the query was run before in advanced mode, the Metrics interface will adjust to Basic mode.
If the query editor mode cannot be adjusted, it is changed to advanced mode so that it can handle query from history. It is possible to run queries which were used with parameters/template variables.
Create a metric query
-
Classic UI. Go to the Home screen and select Metrics.
New UI. In the main Sumo Logic menu select Observability, and then under Metrics select Metrics Search. You can also click the Go To... menu at the top of the screen and select Metrics Search. -
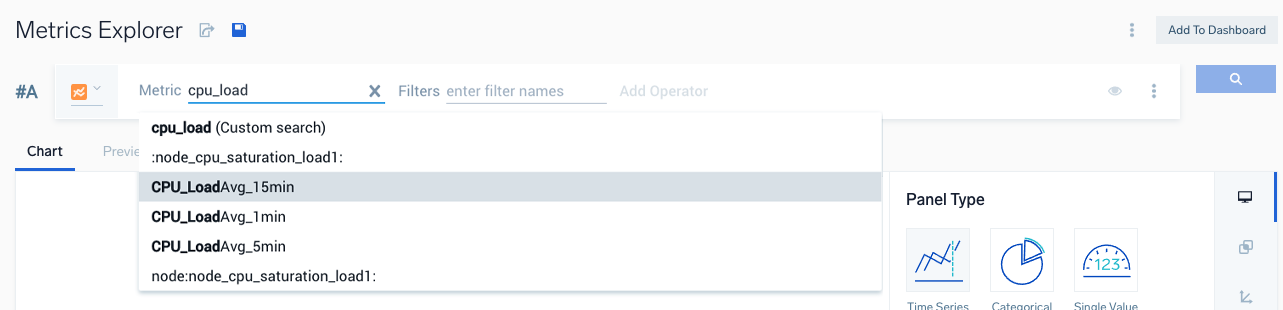
The Metrics Explorer opens. Click the Metric field. A list of metrics appears. You can scroll through the list, or begin typing to dynamically narrow the list. Click the desired metric.
-
Click the Filters field. A list of metadata fields and metric dimensions appears. Scroll through the list, or begin typing to dynamically narrow the list. Click a field or dimension. In the screenshot below, we clicked the
_sourceCategorymetadata field. A dropdown list of values for the selected item appears.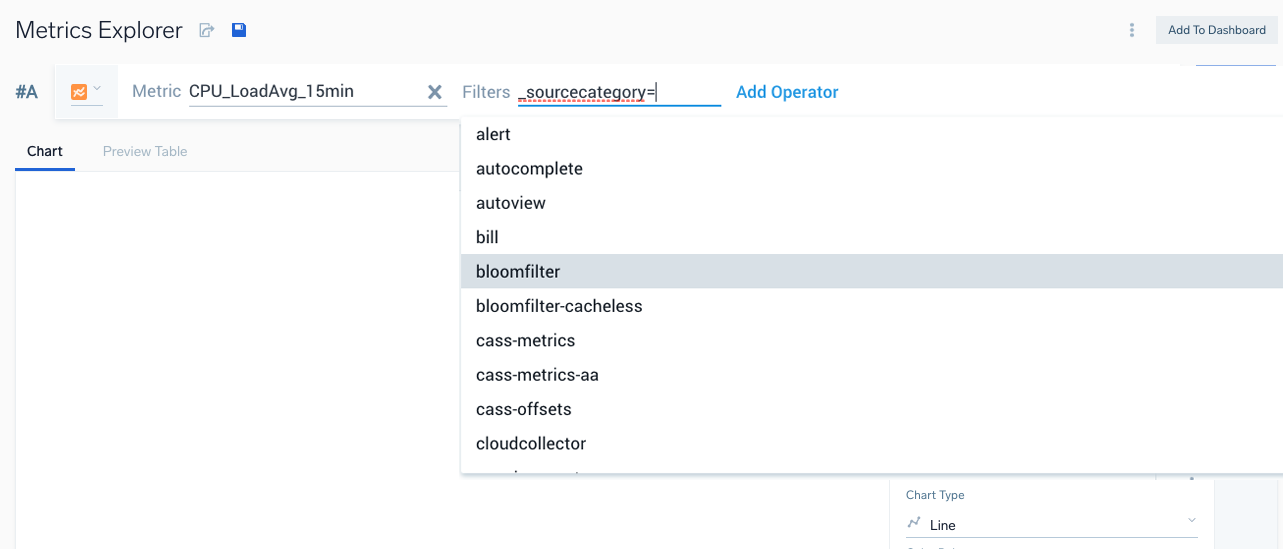
-
Scroll through the list, or begin typing to dynamically narrow the list. Click the desired value. The Filter field now contains the key-value pair you selected. You can click a filter setting to edit it. You can preface a filter value with and exclamation point (!) to NOT the value.
-
As desired, repeat the previous steps to add additional filters to the query.
-
When you are ready to run your query, click the run button:

-
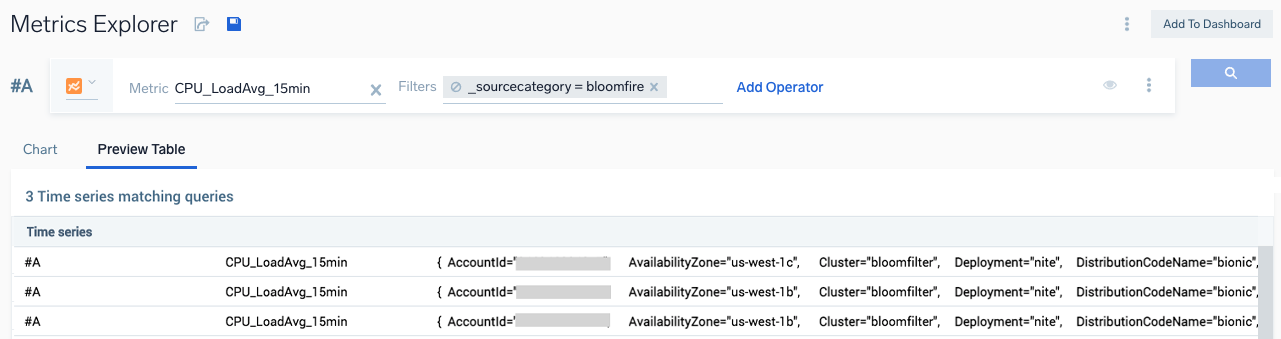
The metrics returned by your query appear in the Time Series Table.
-
At any time, you can click Chart to see a visualization of the metrics. The chart area now displays a visualization of the selected metric.
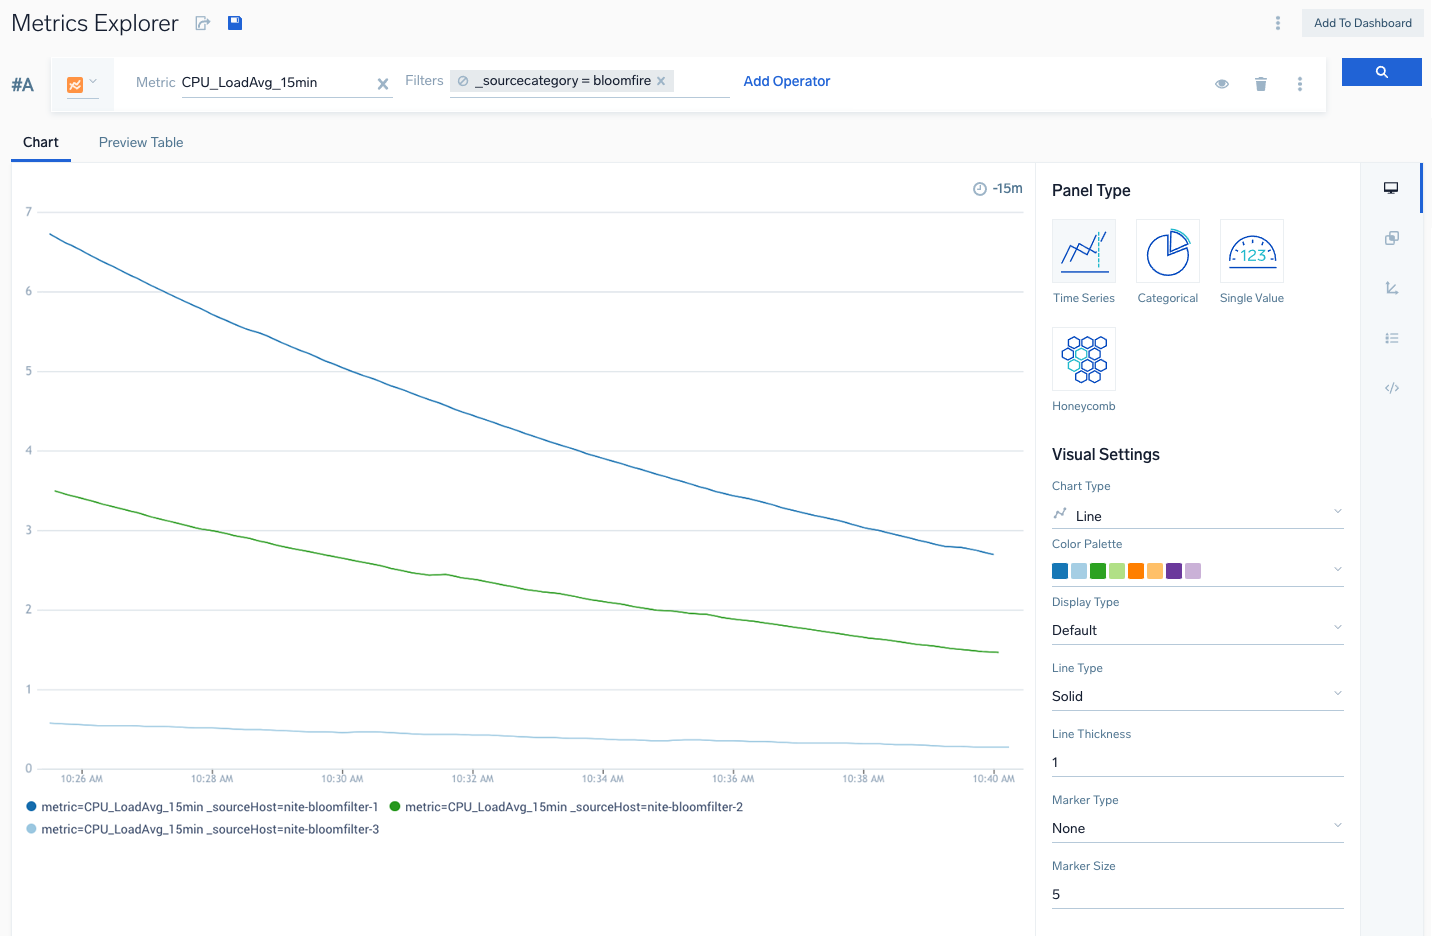
-
If you want to apply an operator, click Add Operator to the right of the Filters field. A list of metric operators appears. Note that when you hover over an operator, a tool tip displays the Advanced Mode syntax and a description of the operator.
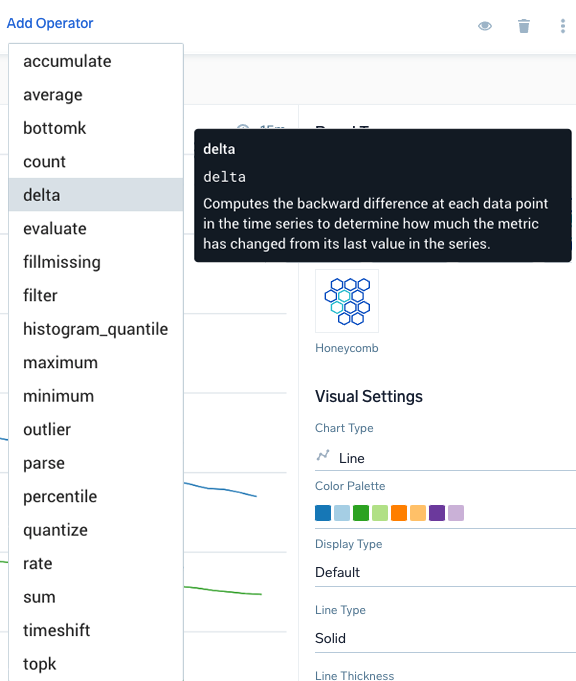
-
Choose an operator from the list. If you choose an operator that supports or requires arguments, you are prompted to supply them. Click the run button to run the updated query. The chart area updates to show your query results with the operator applied.
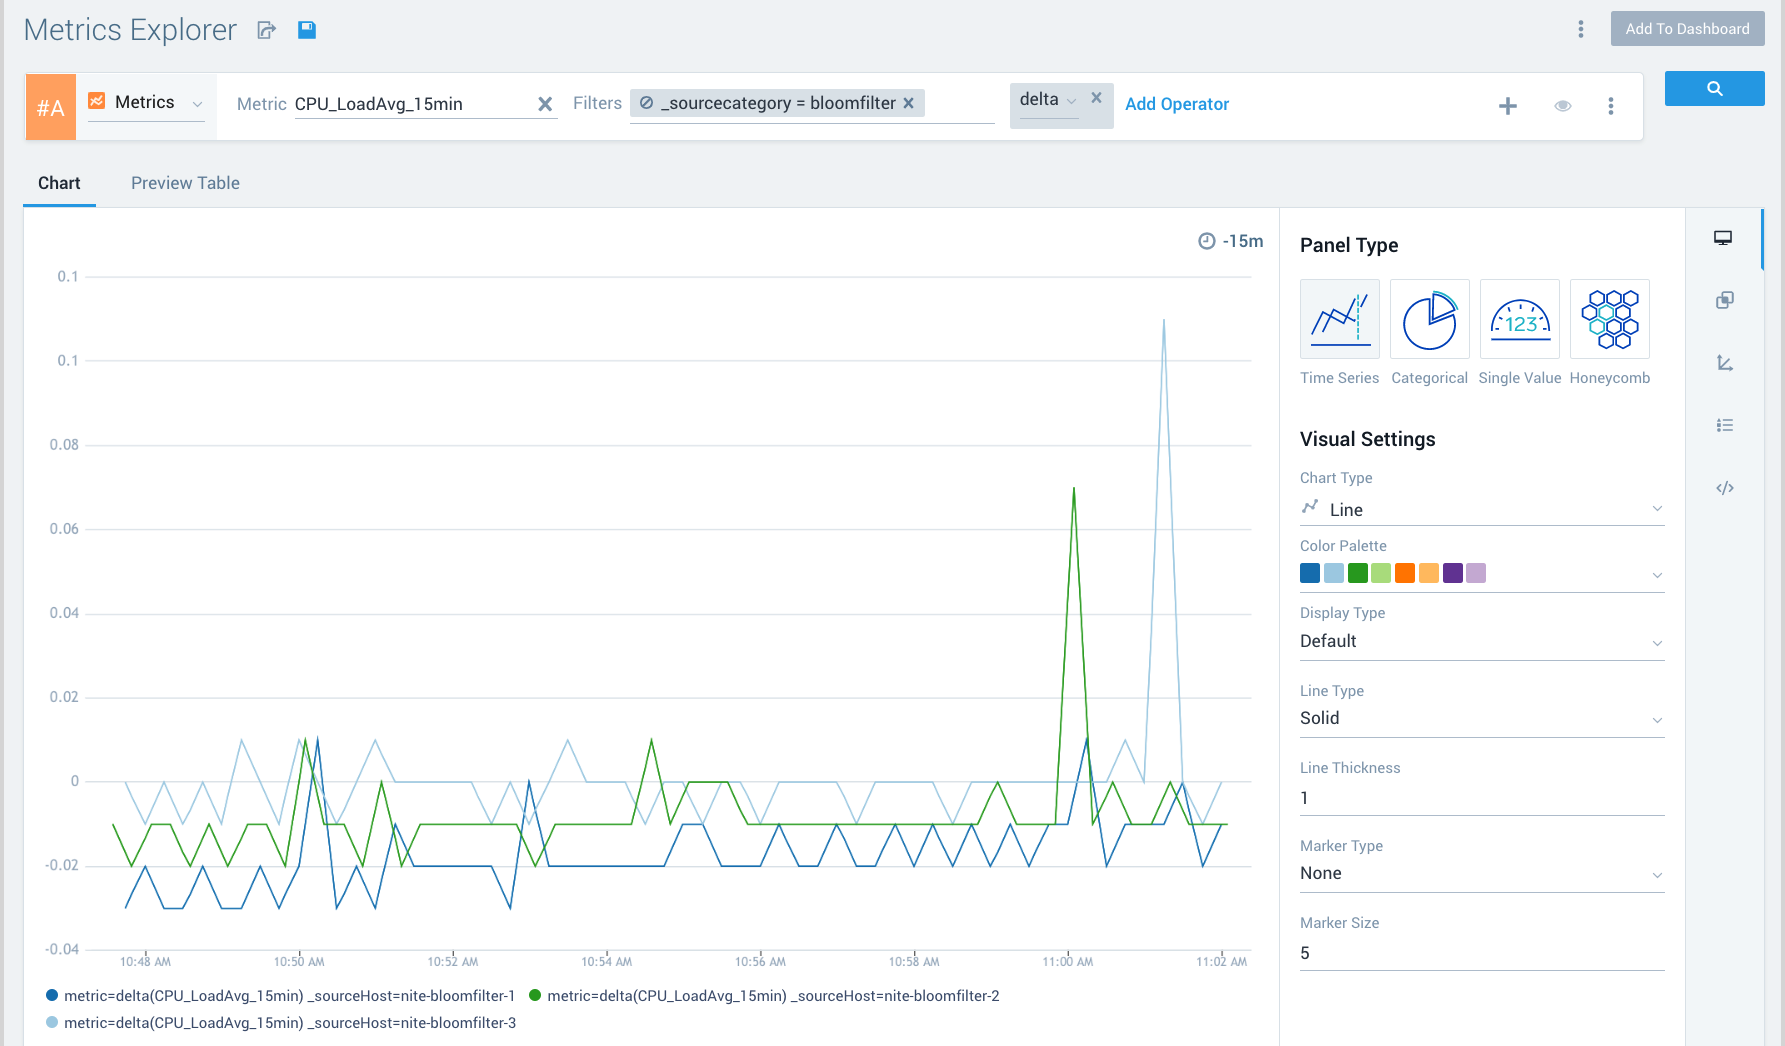
-
Apply additional operators to the query, as desired.
Set Warning and Critical Thresholds
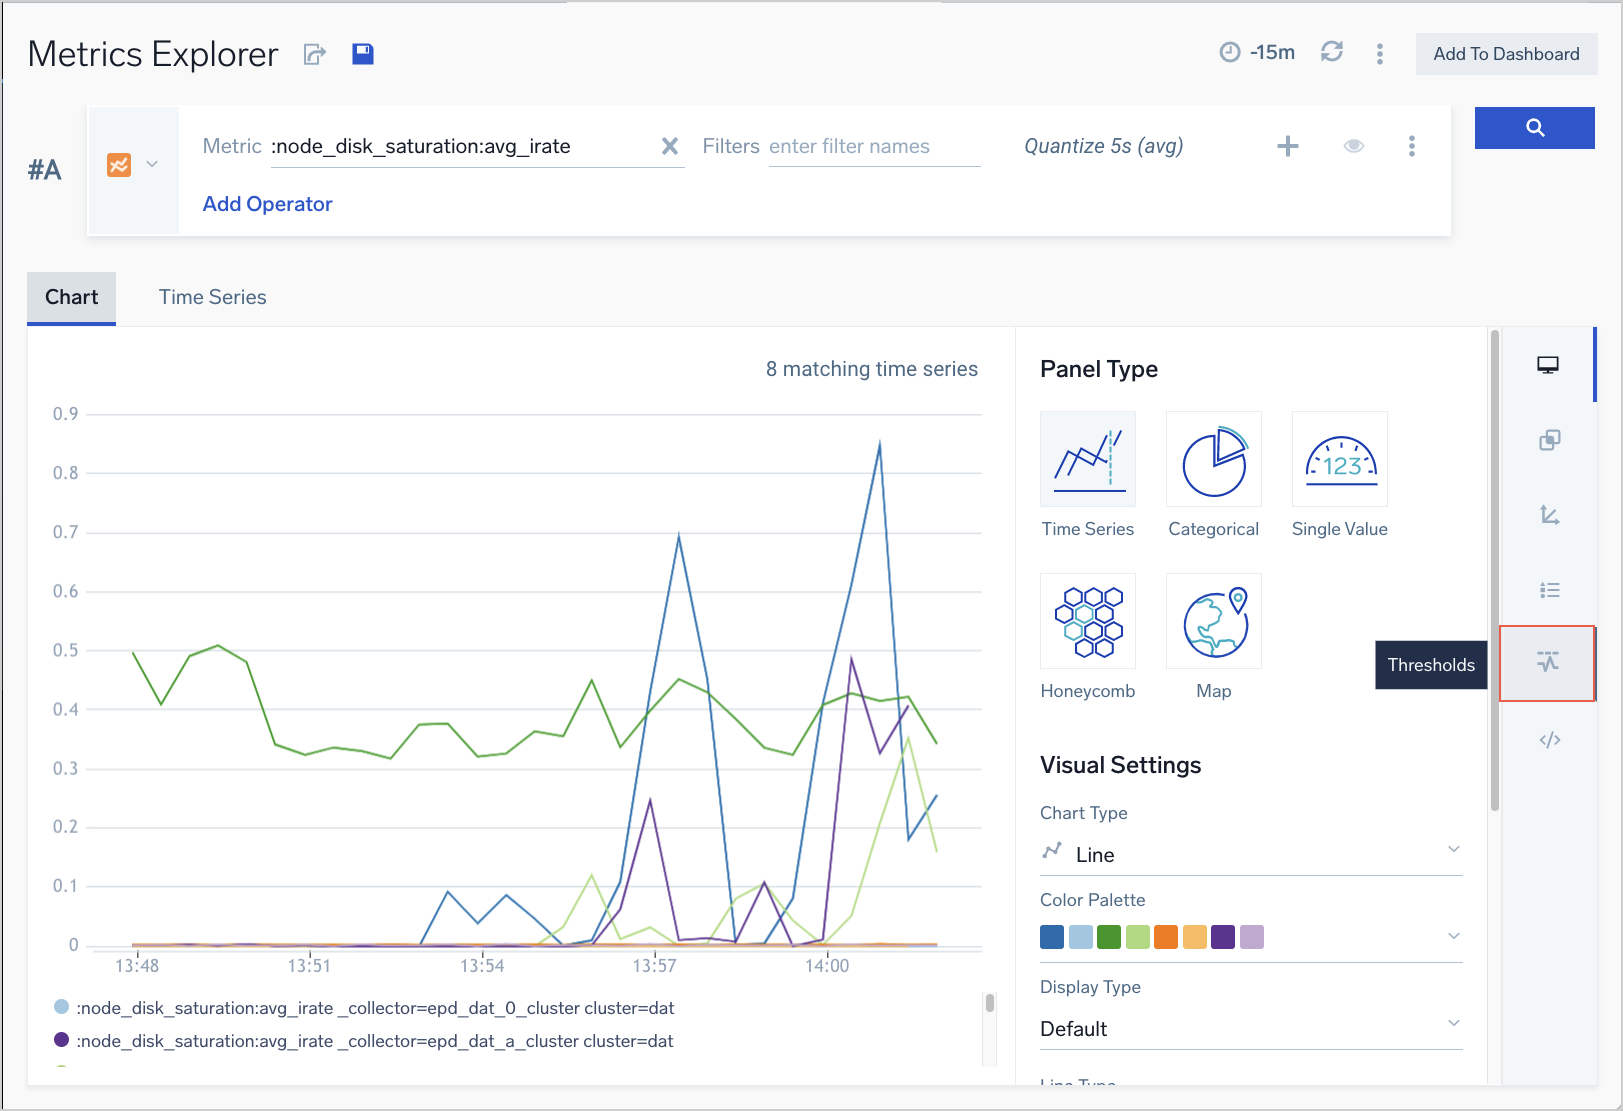
For some chart types, you can use the Thresholds tab in the Display Settings panel to define warning and critical thresholds. The Thresholds tab is available in the Chart view for a Time Series panel, and for these chart types for Categorical panels: Line, Area, Bar, Column, and Table.
To set threshold values
- After you enter your query, in the Chart view, click the Thresholds icon in the right-side pane of icons.
- Click the toggle in the Thresholds pane.
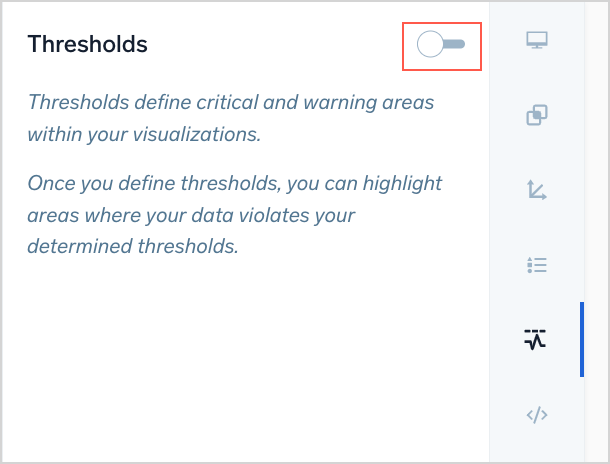
- The Thresholds area updates to display default settings.
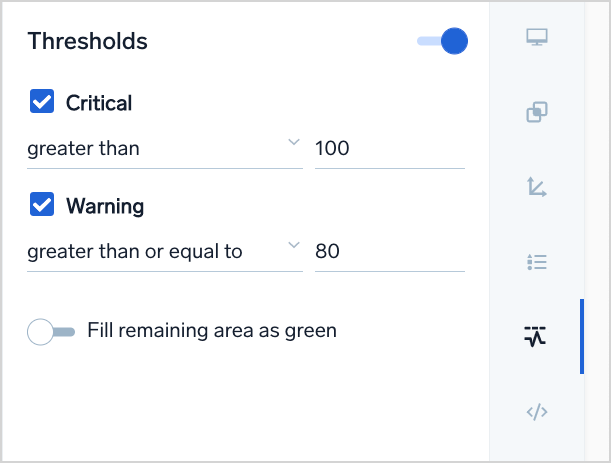
- Configure the appropriate comparator and threshold values, based on your data and requirements. You can choose from the following comparators.
- greater than. Any value greater than the value you specify will violate the threshold.
- greater than or equal to. Any value greater than or equal to the value you specify will violate the threshold.
- less than. Any value less than the value you specify will violate this threshold.
- less than or equal. Any value less than or equal to the value you specify will violate the threshold.
- includes. Any value between the two values you specify will violate the threshold.
- excludes. Every value NOT between the two values you specify will violate the threshold.
- Threshold bands appear on the chart. The red band shows the Critical threshold, the yellow band is Warning.
The chart type in the screenshot below is a line chart. For other chart types, the threshold visualization may vary. For example, in bar and column charts, the bars and columns are shaded yellow, red, and green in accordance with the thresholds defined.
The critical threshold has higher priority than the warning threshold. If the thresholds you define overlap, only the Critical shading (red) is applied to the overlapping area. fill-green.png - If you toggle the Fill remaining area as green option, the portion of the chart with no thresholds is shaded in green.
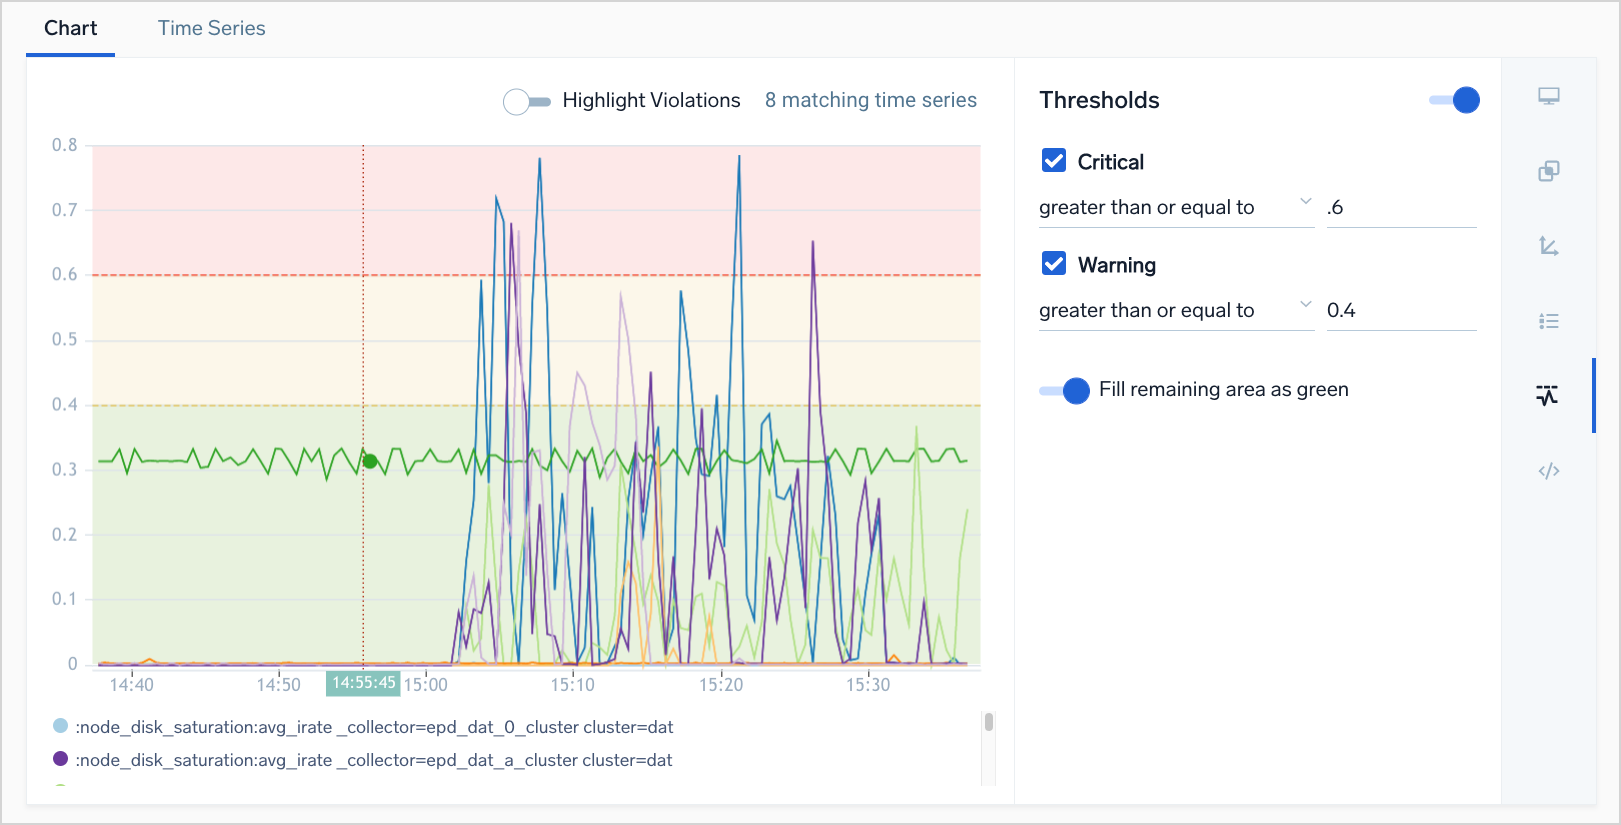
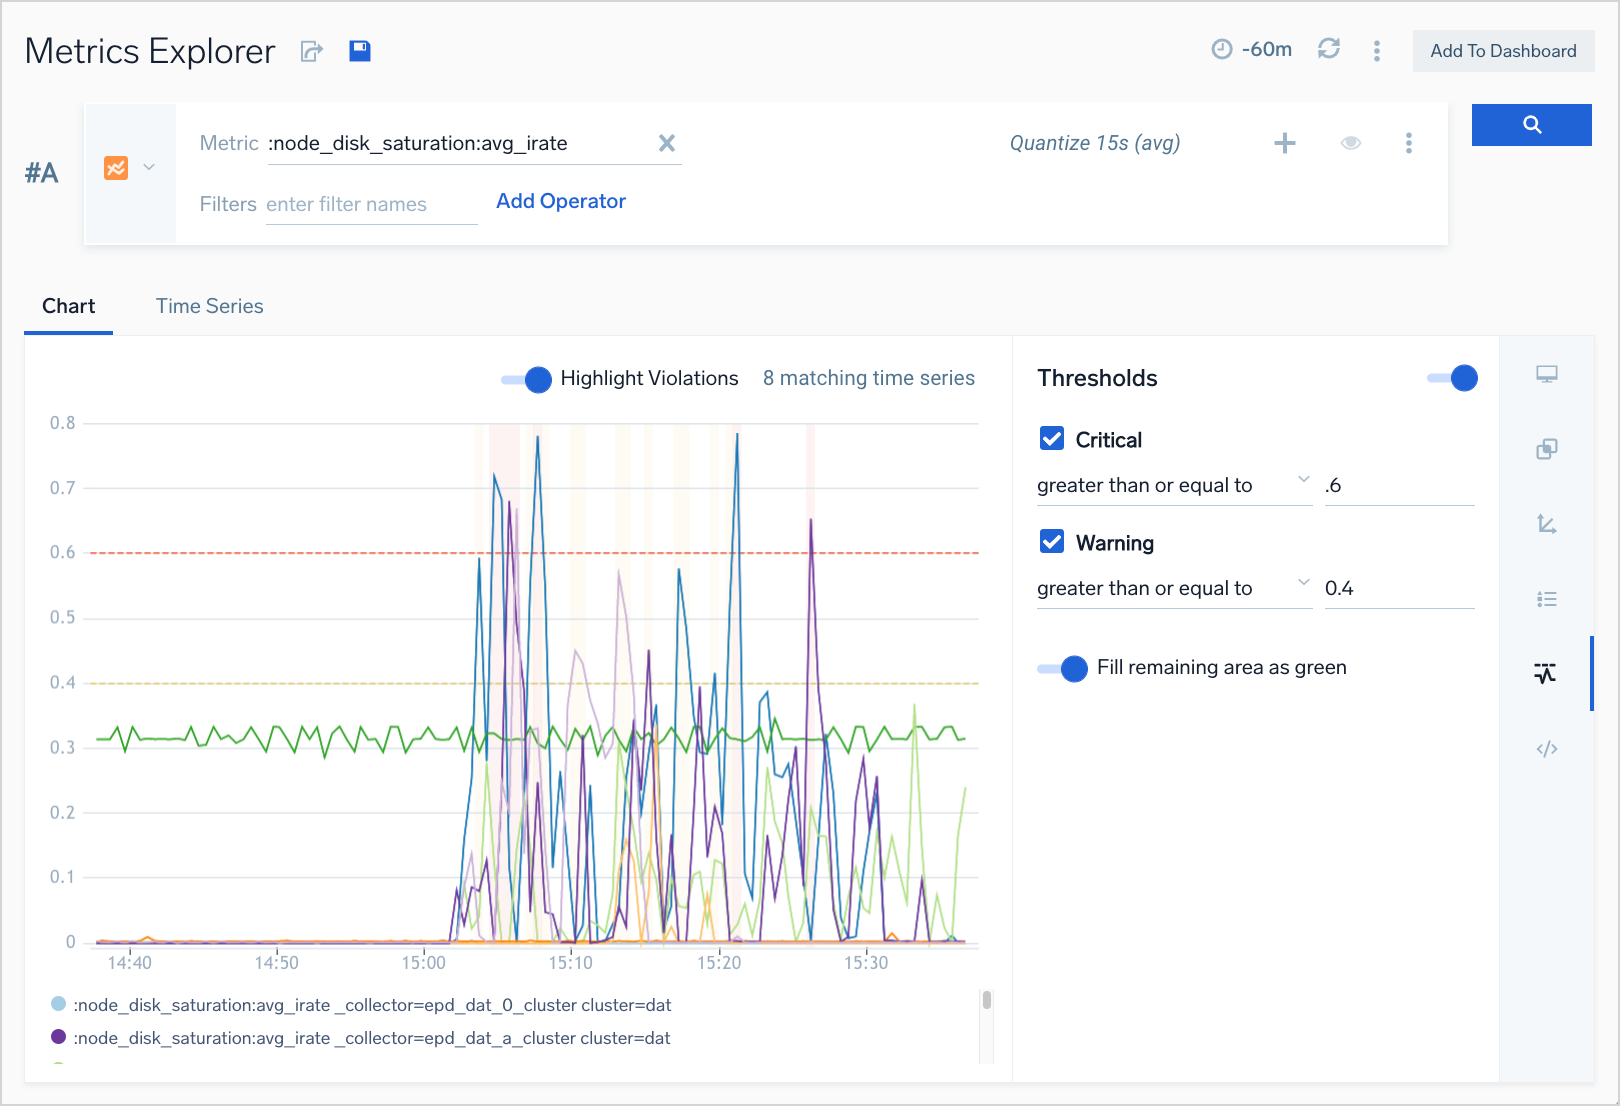
- If you toggle the Highlight Violations option, the horizontal threshold shading is removed. Instead you’ll see vertical red and yellow highlighting in the timelices where those thresholds were violated.
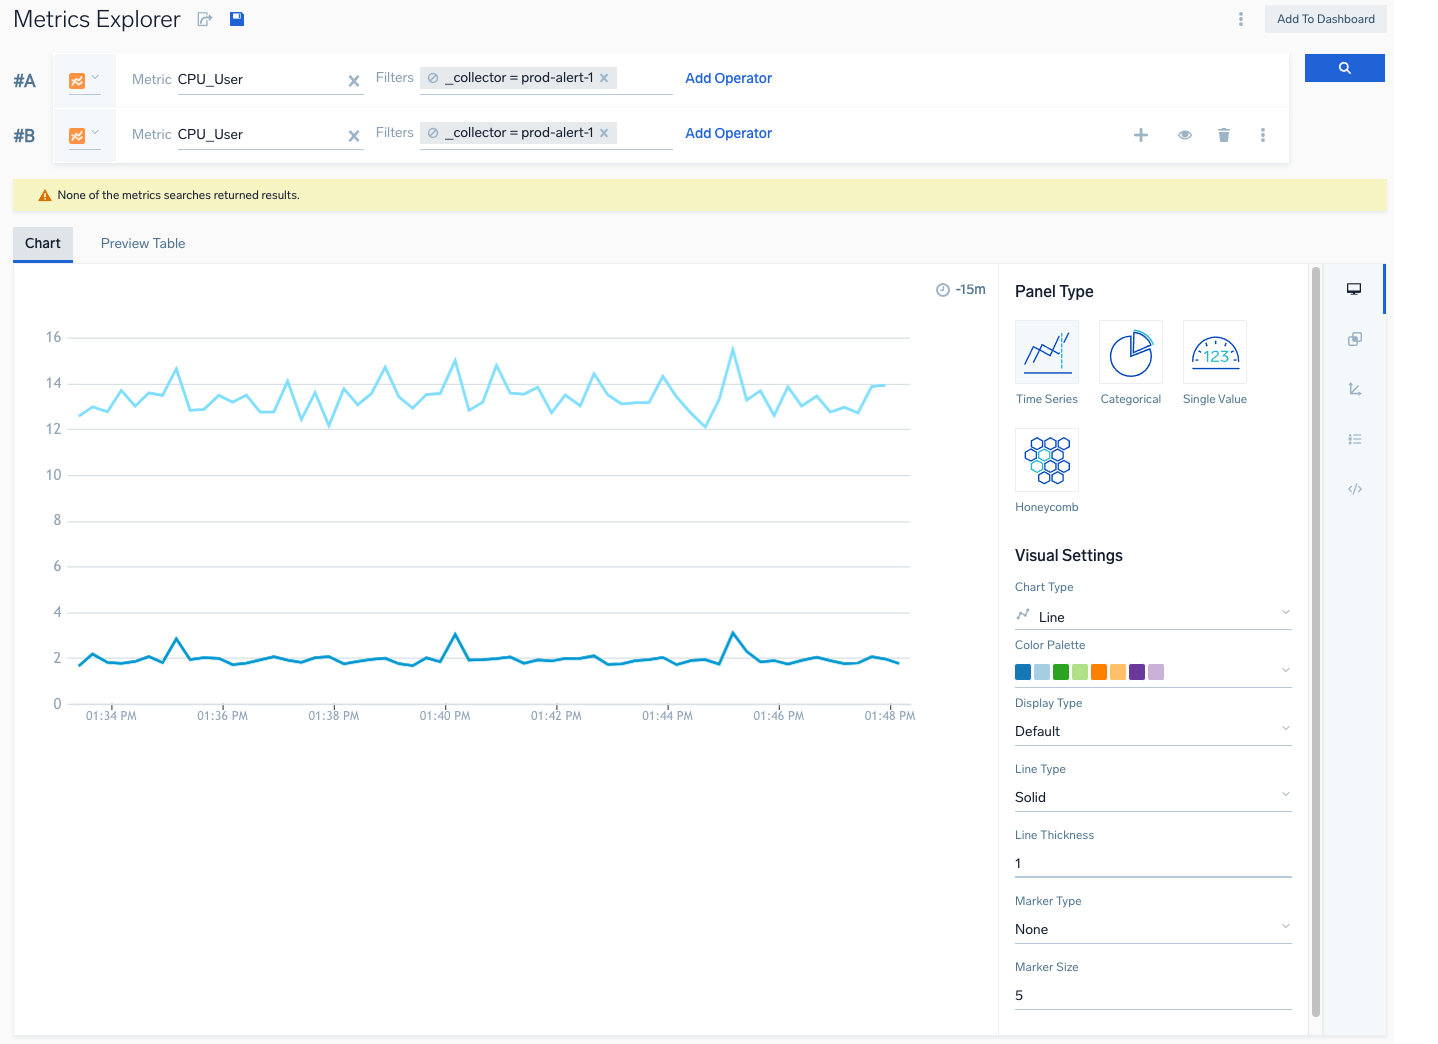
Add another metric query
You can specify up to six queries in the same Metrics tab.
To add an additional query:
- Click Add Query to the right of the query builder area.

- A new row, labeled #B, is added to the query builder area.
- Follow the steps in Create a metric query to build another query, and click the run icon to run the query.
- Your visualization is updated to chart the additional query.
Join metric queries
Metric query joins are only supported in Advanced Mode. The instructions below show how to switch to Advanced mode and enter a join query.
You can perform basic math operations (+, -, *, /) on two or more metrics queries, and use an additional query to apply an operation to the results of the other queries. For example, in the metric query tab below, the two queries return the incoming and outgoing network bytes.
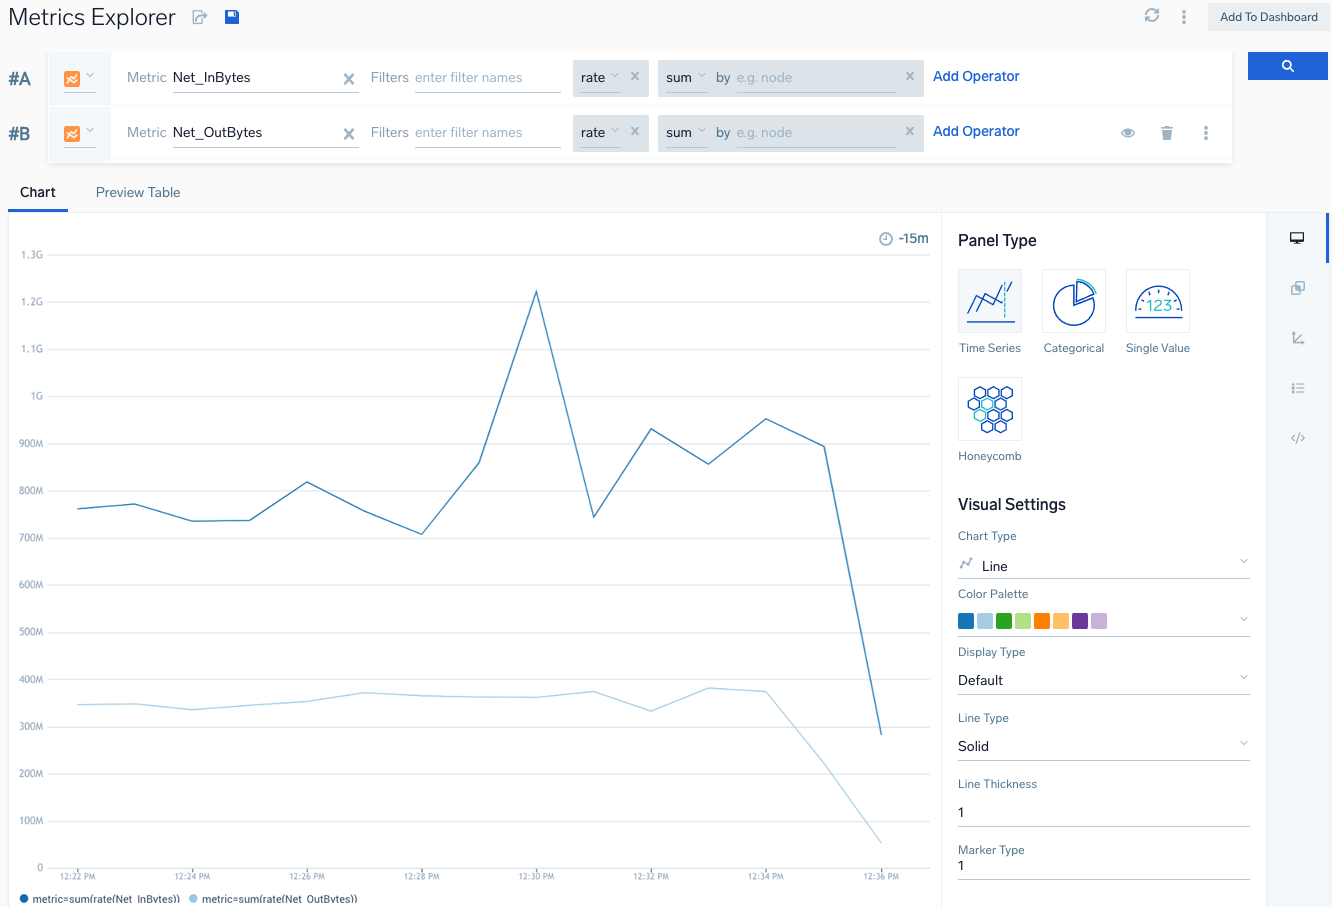
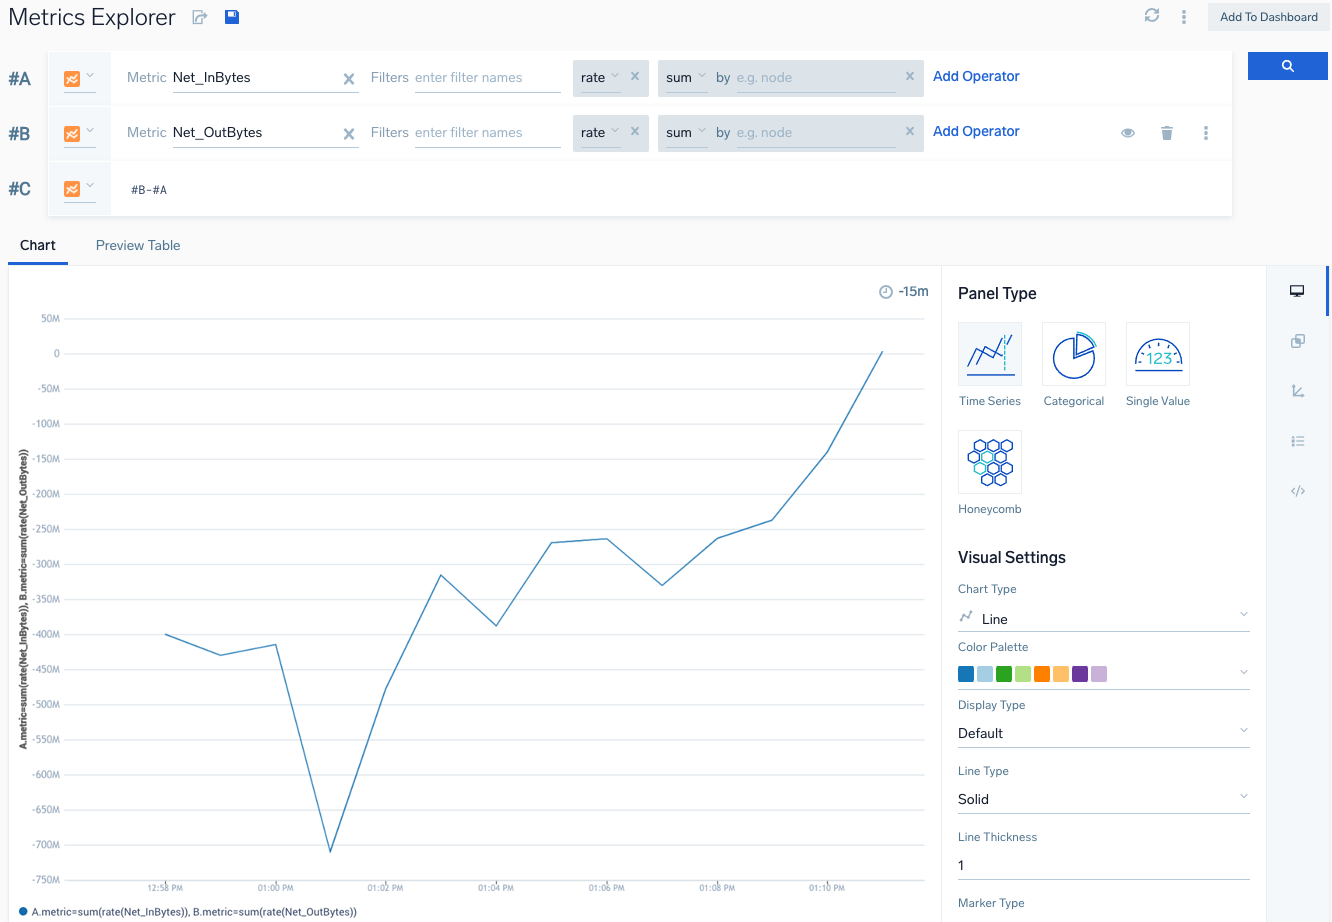
To join the queries, add a third query row, and then switch to advanced mode by choosing Advanced Mode from the three-dot kebab menu in that row.

In Advanced mode, enter:
#B-#A
It returns the difference between the incoming rate and the outgoing rate. In the visualization, display of the first two queries is toggled off, so only the join results are shown.
Hide a query
You can hide a query so that it is not visualized in the chart.
- Click the eye icon to the right of the query builder area in the row that contains the query you want to hide.
- The visualization for the query is hidden. The query label for a hidden query is faded out.

- To make the query visible, click the eye icon again.
Add a monitor to a metric query
- Select Add Monitor from the more options menu.

- Follow the instructions to add a Monitor.
Convert query mode
The Metrics Explorer opens in Basic Mode by default. You can convert between Basic and Advanced anytime.
- Select Advanced Mode from the more options menu.
- Build your query in Advanced Mode.
- To convert to Basic, select Basic Mode from the more options menu.
- The query converts with each filter loaded for editing or removing as needed. You can also add more operators. If the query cannot be converted, a message displays.
Duplicate a metric query
- Select Duplicate Query from the more options menu.

- Your query will be copied to a new row in the query builder area.
Tailoring charts
For information about tailoring charts, see modify a chart.
Add a metric chart to a dashboard
To add a metric chart to a dashboard, click the Add to Dashboard button in the upper right corner of the Metric tab.
Metrics Explorer FAQs
Below are some FAQs about the Metrics Explorer.
What value does Metrics Explorer provide?
The Metrics Explorer gives you more visualization types and makes your metrics easier to discover. Metrics Explorer provides the same visualizations available in Dashboards (New), from tables and category charts, to time series charts and honeycomb visualizations. The Metrics Explorer has richer and more comprehensive autocomplete support, providing suggestions for even very high cardinality queries. The structured query builder approach also makes the metrics experience friendlier to infrequent and inexperienced metrics users.
Can I put logs and metrics on the same panel in the Metrics Explorer?
Yes you can. The experience is consistent with the Dashboards (New) experience and has the same features.
How does autocomplete when searching metrics work?
Autocomplete in the Metrics Explorer works by taking what you type and looking for tokenized prefixes that match your input. We tokenize based on spaces, underscores, hyphens, and a variety of other special characters. For example, assume you have a metric metric_this_is. If you enter is in the Metric field, Sumo Logic will suggest metric_this_is because is is a token in the metric. Similarly, entering met will result in the same recommendation because met is a prefix for the token metric. However, if you enter ric, we won't suggest metric_this_is because ric isn’t a prefix of any of the tokens in token in that metric name.