Configure AWS Observability Alerts
Sumo Logic provides pre-configured alerts designed to promptly assess the availability and performance of specific AWS services. These alerts utilize metric datasets with predefined thresholds aligned with industry best practices and AWS recommendations. They are available for each AWS service integrated into the AWS Observability solution and can be deployed via a CloudFormation template.
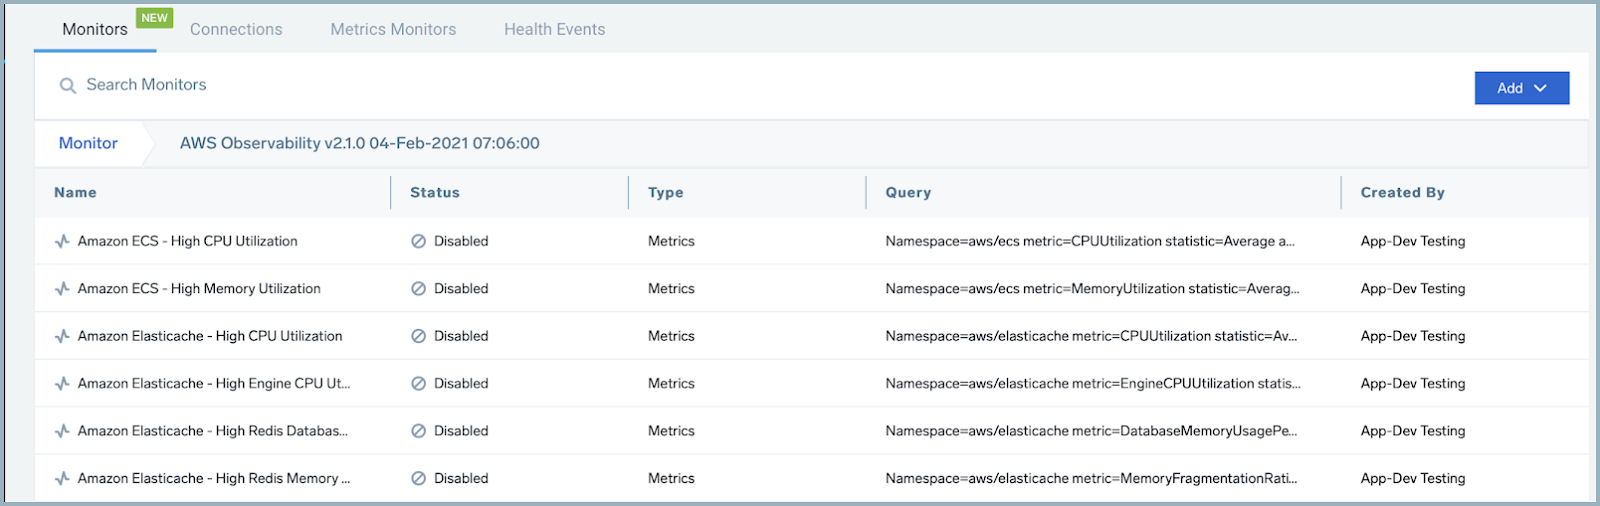
After installing the AWS Observability solution and selecting "Install Dashboards and Alerts," you can configure these alerts by navigating to the AWS Observability folder under Monitors.
To enable the monitors you wish to receive alerts from, see Editing Monitor Settings. To configure alerts to send notifications to other teams or connections, see Create a Monitor.
Sumo Logic provides the following out-of-the-box alerts:
| Alert Name | Alert Description | Alert Condition | Recover Condition |
|---|---|---|---|
| AWS API Gateway - High Authorizer Errors | This alert fires when there are too many API requests (>5%) with authorizer errors within 5 minutes. | > 5 | <=5 |
| AWS API Gateway - High Client-Side Errors | This alert fires when there are too many API requests (>5%) with client-side errors within 5 minutes. This can indicate an issue in the authorization or client request parameters. It could also mean that a resource was removed or a client is requesting one that doesn't exist. Errors could also be caused by exceeding the configured throttling limit. | >=0.05 | < 0.05 |
| AWS API Gateway - High Integration Errors | This alert fires when there are too many API requests (>5%) with integration errors within 5 minutes. | > 5 | <=5 |
| AWS API Gateway - High Integration Latency | This alert fires when we detect the high integration latency for the API requests in a stage within 5 minutes. This alarm is recommended for WebSocket APIs by AWS, and optional for other APIs because they already have separate alarm recommendations for the Latency metric. You can correlate the IntegrationLatency metric value with the corresponding latency metric of your backend such as the Duration metric for Lambda integrations. This helps you determine whether the API backend is taking more time to process requests from clients due to performance issues or if there is some other overhead from initialization or cold start. | >=2000 | < 2000 |
| AWS API Gateway - High Latency | This alert fires when we detect the high Latency in a stage within 5 minutes for REST and HTTP API. Find the IntegrationLatency metric value to check the API backend latency. If the two metrics are mostly aligned, the API backend is the source of higher latency and you should investigate there for issues. View this metric per resource and method and narrow down the source of the latency. | >=2500 | < 2500 |
| AWS API Gateway - High Server-Side Errors | This alert fires where there are too many API requests (>5%) with server-side errors within 5 minutes. This can be caused by 5xx errors from your integration, permission issues, or other factors preventing successful invocation of the integration, such as the integration being throttled or deleted. | >=0.05 | < 0.05 |
| AWS API Gateway - High WAF Errors | This alert fires where there are too many API requests (>5%) with WAF errors within 5 minutes. | > 5 | <=5 |
| AWS API Gateway - High WAF Latency | This alert fires when we detect the high WAF latency for the REST and WebSocket API requests in a stage within 5 minutes. | > 1000 | <=1000 |
| AWS API Gateway - Low Traffic API | This alert fires where there is low message traffic volume for the API within 5 minutes. This can indicate an issue with the application calling the API such as using incorrect endpoints. It could also indicate an issue with the configuration or permissions of the API making it unreachable for clients. This alarm is not recommended for APIs that don't expect constant and consistent traffic. | <=1 | > 1 |
| Amazon RDS - High CPU Utilization | This alert fires when we detect that the average CPU utilization for a database is high (>=85%) for a 5-minute interval. | >= 85 | < 85 |
| Amazon RDS - High Disk Queue Depth | This alert fires when the average disk queue depth for a database is high (>=5) for a 5-minute interval. Higher this value, higher will be the number of outstanding I/Os (read/write requests) waiting to access the disk, which will impact the performance of your application. | >= 5 | < 5 |
| Amazon RDS - High Read Latency | This alert fires when the average read latency of a database within a 5 minutes time interval is high (>=5 seconds). High read latency will affect the performance of your application. | >= 5 | < 5 |
| Amazon RDS - High Write Latency | This alert fires when the average write latency of a database within a 5 minute interval is high (>=5 seconds) . High write latencies will affect the performance of your application. | >= 5 | < 5 |
| Amazon RDS - Low Burst Balance | This alert fires when we observe a low burst balance (<= 50%) for a given database. A low burst balance indicates you won't be able to scale up as fast for burstable database workloads on gp2 volumes. | <= 50 | > 50 |
| Amazon RDS - Low Aurora Buffer Cache Hit Ratio | This alert fires when the average RDS Aurora buffer cache hit ratio within a 5 minute interval is low (<= 50%). This indicates that a lower percentage of requests were served by the buffer cache, which could further indicate a degradation in application performance. | <= 50 | > 50 |
| Amazon RDS MySQL - Excessive Slow Query Detected | This alert fires when we detect the average time to execute a query is more than 5 seconds over a 10 minutes. | >=1 | <1 |
| Amazon RDS MySQL - High Authentication Failure | This alert fires when we detect more then 10 authentication failure over a 5-minute time period. | >10 | <=10 |
| Amazon RDS PostgreSQL - High Authentication Failure | This alert fires when we detect more than 10 authentication failure in Postgres logs over a 5 minute time-period. | >10 | <=10 |
| Amazon RDS PostgreSQL - High Errors | This alert fires when we detect high number (>10) of error/fatal logs in Postgres logs over a 5 minutes time-period. | >10 | <=10 |
| Amazon RDS PostgreSQL - Statement Timeout | This alert fires when we detect Postgres logs show statement timeouts. | >0 | <=0 |
| Amazon RDS PostgreSQL - Excessive Slow Query Detected | This alert fires when we detect the average time to execute a query is more than 5 seconds over a 10 minutes. | >=1 | <1 |
| Amazon RDS MSSQL - Database observing authentication failures from multiple client IPs | This alert fires when we detect more than or equal to 10 client IPs attempting authentication failures on the database over a 15 minute time-period. | >=1 | <1 |
| Amazon RDS MSSQL - Authentication failures from the same client IP on multiple databases | This alert fires when we detect specific client IP attempting authentication failures on more than or equal to 10 databases over a 15 minute time-period. | >=1 | <1 |
| Amazon RDS - Low Free Storage | This alert fires when the average free storage space of a RDS instance is low (< 512MB) for an interval of 15 minutes. | <512 | >=512 |
| Amazon RDS - Low Freeable Memory | This alert fires when the average Freeable memory of an RDS instance is < 128 MB for an interval of 15 minutes. If this value is lower you may need to scale up to a larger instance class. | <128 | >=128 |
| AWS DynamoDB - High Account Provisioned Read Capacity | This alert fires when we detect that the average read capacity provisioned for an account for a time interval of 5 minutes is greater than or equal to 80%. High values indicate requests to the database are being throttled, which could further indicate that your application may not be working as intended. | >= 80 | < 80 |
| AWS DynamoDB - High Account Provisioned Write Capacity | This alert fires when we detect that the average write capacity provisioned for an account for a time interval of 5 minutes is greater than or equal to 80%. High values indicate requests to the database are being throttled, which could further indicate that your application may not be working as intended. | >= 80 | < 80 |
| AWS DynamoDB - High Max Provisioned Table Read Capacity | This alert fires when we detect that the average percentage of read provisioned capacity used by the highest read provisioned table of an account for a time interval of 5 minutes is greater than or equal to 80%. High values indicate requests to the database are being throttled, which could further indicate that your application may not be working as intended. | >= 80 | < 80 |
| AWS DynamoDB - High Max Provisioned Table Write Capacity | This alert fires when we detect that the average percentage of write provisioned capacity used by the highest write provisioned table of an account for a time interval of 5 minutes is greater than or equal to 80%. High values indicate requests to the database are being throttled, which could further indicate that your application may not be working as intended. | >= 80 | < 80 |
| AWS DynamoDB - Multiple Tables Deleted | This alert fires when five or more tables are deleted within 15 minutes. | >= 5 | < 5 |
| AWS DynamoDB - High Read Throttle | This alert fires when we detect that the total read throttle events for a dynamodb table is high (>5) for a time interval of 5 minutes. | >5 | <=5 |
| AWS DynamoDB - High Write Throttle | This alert fires when we detect that the total write throttle events for a dynamodb table is high (>5) for a time interval of 5 minutes. | >5 | <=5 |
| AWS DynamoDB - System Errors | This alert fires when we detect system errors for a dynamodb table is high (>10) for a time interval of 5 minutes. | >10 | <=10 |
| AWS Application Load Balancer - High Latency | This alert fires when we detect that the average latency for a given Application load balancer within a time interval of 5 minutes is greater than or equal to three seconds. | >= 3000 | < 3000 |
| AWS Application Load Balancer - High 4XX Errors | This alert fires when there are too many HTTP requests (>5%) with a response status of 4xx within a 5-minute interval. | >= 5 | < 5 |
| AWS Application Load Balancer - High 5XX Errors | This alert fires when there are too many HTTP requests (>5%) with a response status of 5xx within a 5-minute interval. | >= 5 | < 5 |
| AWS Application Load Balancer - Access from Highly Malicious Sources | This alert fires when an Application Load Balancer is accessed from highly malicious IP addresses within the last 5 minutes. | > 0 | <= 0 |
| AWS Lambda - Low Provisioned Concurrency Utilization | This alert fires when the average provisioned concurrency utilization for 5 minutes is low (<= 50%). This indicates low provisioned concurrency utilization efficiency. | <= 50 | > 50 |
| AWS Lambda - High Percentage of Failed Requests | This alert fires when we detect a large number of failed Lambda requests (>5%) within a 5-minute interval. | >= 5 | < 5 |
| AWS Lambda - High Memory Utilization | This alert fires when we detect a Lambda execution with memory usage of more than 85% within an interval of 10 minutes. | >85 | <=85 |
| AWS Lambda - Throttling | This alert fires when we detect a Lambda running into throttling within an interval of 10 minutes. | >0 | <=0 |
| AWS EC2 - High System CPU Utilization | This alert fires when the average system CPU utilization within a 5 minute interval for an EC2 instance is high (>=85%). | >=85 | <85 |
| AWS EC2 - High Total CPU Utilization | This alert fires when the average total CPU utilization within a 5 minute interval for an EC2 instance is high (>=85%). | >=85 | <85 |
| AWS EC2 - High Memory Utilization | This alert fires when the average memory utilization within a 5 minute interval for an EC2 instance is high (>=85%). | >= 85 | <85 |
| AWS EC2 - High Disk Utilization | This alert fires when the average disk utilization within a 5 minute time interval for an EC2 instance is high (>=85%). | >= 85 | < 85 |
| AWS EC2 CW - Status Check Failed | This alert fires when there is a status check failures within a 5 minute interval for an EC2 instance. | >0 | <=0 |
| AWS EC2 CW - High CPU Utilization | This alert fires when the average CPU Utilization based on cloud watch metrics, within a 5 minute interval for an EC2 instance is high (>=85%). | >85 | <=85 |
| Amazon ECS - High CPU Utilization | This alert fires when the average CPU utilization within a 5 minute interval for a service within a cluster is high (>=85%). | >= 85 | <85 |
| Amazon ECS - High Memory Utilization | This alert fires when the average memory utilization within a 5 minute interval for a service within a cluster is high (>=85%). | >= 85 | <85 |
| Amazon Elasticache - High CPU Utilization | This alert fires when the average CPU utilization within a 5 minute interval for a host is high (>=90%). The CPU Utilization metric includes total CPU utilization across application, operating system and management processes. We highly recommend monitoring CPU utilization for hosts with two vCPUs or less. | >= 90 | < 90 |
| Amazon Elasticache - High Engine CPU Utilization | This alert fires when the average CPU utilization for the Redis engine process within a 5 minute interval is high (>=90%). For larger node types with four vCPUs or more, use the EngineCPUUtilization metric to monitor and set thresholds for scaling. | >= 90 | < 90 |
| Amazon Elasticache - Low Redis Cache Hit Rate | This alert fires when the average cache hit rate for Redis within a 5 minute interval is low (<= 80%). This indicates low efficiency of the Redis instance. If cache ratio is lower than 80%, that indicates a significant amount of keys are either evicted, expired, or don't exist. | <= 80 | > 80 |
| Amazon Elasticache - High Redis Database Memory Usage | This alert fires when the average database memory usage within a 5 minute interval for the Redis engine is high (>=95%). When the value reaches 100%, eviction may happen or write operations may fail based on ElastiCache policies thereby impacting application performance. | >= 95 | < 95 |
| Amazon Elasticache - High Redis Memory Fragmentation Ratio | This alert fires when the average Redis memory fragmentation ratio for within a 5 minute interval is high (>=1.5). Value equal to or greater than 1.5 Indicate significant memory fragmentation. | >= 1.5 | < 1.5 |
| Amazon ElastiCache - Multiple Failed Operations | This alert fires when we detect multiple failed operations within a 15-minute interval for an ElastiCache service. | >= 10 | < 10 |
| AWS Network Load Balancer - High TLS Negotiation Errors | This alert fires when we detect that there are too many TLS Negotiation Errors (>=10%) within a 5-minute interval for a given network load balancer | >= 10 | <10 |
| AWS Network Load Balancer - High Unhealthy Hosts | This alert fires when we detect that are there are too many unhealthy hosts (>=10%) within a 5-minute interval for a given network load balancer | >= 10 | <10 |
| AWS Classic Load Balancer - High Latency | This alert fires when we detect that the average latency for a given Classic load balancer within a time interval of 5 minutes is greater than or equal to three seconds. | >= 3000 | < 3000 |
| AWS Classic Load Balancer - High 4XX Errors | This alert fires when there are too many HTTP requests (>5%) with a response status of 4xx within a 5-minute interval. | >= 5 | <5 |
| AWS Classic Load Balancer - High 5XX Errors | This alert fires when there are too many HTTP requests (>5%) with a response status of 5xx within a 5-minute interval. | >= 5 | <5 |
| AWS Classic Load Balancer - Access from Highly Malicious Sources | This alert fires when the Classic load balancer is accessed from highly malicious IP addresses within last 5 minutes. | >0 | <0 |
| AWS SNS - Failed Notifications | This alert fires where there are many failed notifications (>2) within a 5-minute interval. | >2 | <=2 |
| AWS SNS - Access from Highly Malicious Sources | This alert fires when an Application AWS - SNS is accessed from highly malicious IP addresses within last 5 minutes | >0 | <=0 |
| AWS SNS - Failed Events | This alert fires when an SNS app has high number of failed events (>5) within the last 5 minutes. | >5 | <=5 |
| AWS SNS - Notification to DLQ | This alert fires when an SNS topic messages are moved to a dead-letter queue. | >0 | <=0 |
| AWS SNS - Notification to DLQ Failure | This alert fires when an SNS topic messages couldn't be moved to a dead-letter queue. | >0 | <=0 |
| AWS SQS - Access from Highly Malicious Sources | This alert fires when an Application AWS - SQS is accessed from highly malicious IP addresses within last 5 minutes. | >0 | <=0 |
| AWS SQS - Message processing not fast enough | This alert fires when we detect message processing is not fast enough. That is, the average approximate age of the oldest non-deleted message in the queue is more than 5 seconds for a 5-minute interval. | >5 | <=5 |
| AWS SQS - Messages not processed | This alert fires when we detect messages that have been received by a consumer, but have not been processed (deleted/failed). That is, the average number of messages that are in flight are >=20 for a 5-minute interval. | >=20 | <20 |
| AWS SQS - Queue has stopped receiving messages | This alert fires when we detect that the queue has stopped receiving messages. That is, the average number of messages received in the queue <1 for an interval of 30 minutes | <1 | >=1 |
The information is provided for both Alert conditions and Recover conditions.