AWS API Gateway
Amazon API Gateway service allows you to create RESTful APIs, HTTP APIs, and WebSocket APIs for real-time two-way communication applications in containerized and serverless environments, as well as web applications.
The Sumo Logic AWS API Gateway app provides insights into API Gateway tasks while accepting and processing concurrent API calls throughout your infrastructure, including traffic management, CORS support, authorization and access control, throttling, monitoring, and API version management.
Log and metrics types
The AWS API Gateway app uses the following logs and metrics:
- Amazon API Gateway metrics:
- CloudTrail API Gateway Data Event

- Amazon API Gateway access logs:
Sample log messages
{
   "eventVersion":"1.05",
   "userIdentity":{
      "type":"IAMUser",
      "principalId":"A12445W32RZN24HABCD12",
      "arn":"arn:aws:iam::123408221234:user/bob",
      "accountId":"123408221234",
      "accessKeyId":"ASIAZ123456Y3IMWK7X5",
      "userName":"bob",
      "sessionContext":{
         "sessionIssuer":{

         },
         "webIdFederationData":{

         },
         "attributes":{
            "mfaAuthenticated":"true",
            "creationDate":"2020-02-17T08:08:01Z"
         }
      },
      "invokedBy":"signin.amazonaws.com"
   },
   "eventTime":"2020-02-17T08:08:01Z",
   "eventSource":"apigateway.amazonaws.com",
   "eventName":"GetRestApi",
   "awsRegion":"us-east-1",
   "sourceIPAddress":"149.236.17.11",
   "userAgent":"signin.amazonaws.com",
   "requestParameters":{
      "restApiId":"w1234nsgjxf",
      "template":false
   },
   "responseElements":null,
   "requestID":"1234169e-e70a-44a1-a691-3cd3f857092a",
   "eventID":"051572b0-83ef-49a3-82f6-bbef1ac8c488",
   "readOnly":true,
   "eventType":"AwsApiCall",
   "recipientAccountId":"123408221234"
}
{
  "requestId": "bf04adbf-eacc-4601-8c14-94605f242e1a",
  "extendedRequestId": "Sca3bFUQgi0EYeA=",
  "identitySourceIp": "103.108.207.58",
  "identityCaller": "-",
  "identityUser": "-",
  "requestTime": "01/Feb/2024:06:47:49 +0000",
  "status": "500",
  "authorizerProperty": "-",
  "routeKey": "-",
  "apiId": "9iljix61i7",
  "authorizeError": "-",
  "authorizeLatency": "-",
  "authorizeStatus": "-",
  "authorizerError": "-",
  "authorizerIntegrationStatus": "-",
  "authorizerIntegrationLatency": "-",
  "authorizerLatency": "-",
  "authorizerPrincipalId": "-",
  "authorizerRequestId": "-",
  "authorizerStatus": "-",
  "authenticateError": "-",
  "authenticateLatency": "-",
  "authenticateStatus": "-",
  "connectedAt": "-",
  "connectionId": "-",
  "domainName": "9iljix61i7.execute-api.eu-north-1.amazonaws.com",
  "errorMessage": "Internal server error",
  "errorResponseType": "DEFAULT_5XX",
  "errorValidationErrorString": "-",
  "eventType": "-",
  "identityAccountId": "-",
  "identityCognitoAuthenticationProvider": "-",
  "identityCognitoAuthenticationType": "-",
  "identityCognitoIdentityId": "-",
  "identityCognitoIdentityPoolId": "-",
  "identityPrincipalOrgId": "-",
  "identityUserAgent": "Mozilla/5.0 (Macintosh; Intel Mac OS X 10_15_7) AppleWebKit/537.36 (KHTML, like Gecko) Chrome/121.0.0.0 Safari/537.36",
  "identityUserArn": "-",
  "identityApiKey": "-",
  "identityApiKeyId": "-",
  "integrationError": "Execution failed due to configuration error: PKIX path building failed: sun.security.provider.certpath.SunCertPathBuilderException: unable to find valid certification path to requested target",
  "integrationIntegrationStatus": "-",
  "integrationLatency": "258",
  "integrationRequestId": "-",
  "integrationStatus": "-",
  "contextIntegrationLatency": "258",
  "requestTimeEpoch": "1706770069673",
  "stage": "test",
  "messageId": "-",
  "wafError": "-",
  "wafLatency": "10",
  "wafStatus": "200"
}
Sample queries
Namespace=aws/apigateway metric=Latency statistic=Average account=* region=* apiname=* | avg by apiname, namespace, region, account
"\"eventSource\":\"apigateway.amazonaws.com\"" errorCode account=dev Namespace=aws/apigateway region=us-east-1
| json "eventName", "eventSource", "awsRegion", "userAgent", "recipientAccountId", "userIdentity", "requestParameters", "responseElements", "sourceIPAddress", "errorCode", "errorMessage", "requestID" as event_name, event_source, Region, user_agent, accountId1, userIdentity, requestParameters, responseElements, src_ip, errorCode, errorMessage, requestID nodrop
| where event_source = "apigateway.amazonaws.com" and !isEmpty(errorCode)
| json field=userIdentity "accountId", "arn", "userName", "type" as accountId2, arn, username, type nodrop | parse field=arn ":assumed-role/*" as user nodrop | parse field=arn "arn:aws:iam::*:*" as accountId, user nodrop
| json field=requestParameters "basePath", "domainName" as basePath, domainName nodrop | json field=responseElements "name" as ApiName nodrop // CreateRestApi, CreateApiKey, CreateUsagePlan, CreateUsagePlanKey, CreateUsagePlanKey, ImportApi, ImportRestApi, UpdateRestApi, UpdateUsagePlan provides ApiName
| where (tolowercase(ApiName) matches tolowercase("*")) or isBlank(apiname)
| if (isEmpty(errorCode), "Success", "Failure") as eventStatus
| if (!isEmpty(accountId1), accountId1, accountId2) as accountId
| if (isEmpty(userName), user, userName) as user
| count as eventCount by errorCode
| top 10 errorCode by eventCount, errorCode asc
account=dev region=us-east-1 namespace=aws/apigateway apiname=* apiid stage domainname requestId identityUserAgent
| json "requestId", "apiId", "authorizerError", "errorMessage", "errorResponseType", "status", "integrationLatency", "domainName", "identitySourceIp", "identityUserAgent", "stage", "integrationStatus" as requestId, apiId, authorizerError, errorMessage, errorResponseType, status, integrationLatency, domainName, identitySourceIp, identityUserAgent, stage, integrationStatus
| json "wafLatency", "responseLatency", "responseLength", "path", "httpMethod", "protocol" as wafLatency, responseLatency, responseLength, path, httpMethod, protocol nodrop
| parse field=domainName "*.execute-api.*.amazonaws.com" as  apiid, region
| where account matches "dev" and region matches "us-east-1" and apiid matches "*" and apiname matches "*"
| where !(identityUserAgent=="-")
| count as Frequency by identityUserAgent
| sort by Frequency, identityUserAgent asc
Viewing AWS API Gateway dashboards
We highly recommend you view these dashboards in the AWS Observability view of our AWS Observability solution.
All dashboards have a set of filters that you can apply to the entire dashboard. Use these filters to drill down and examine the data to a granular level.
- You can change the time range for a dashboard or panel by selecting a predefined interval from a drop-down list, choosing a recently used time range, or specifying custom dates and times. Learn more.
- If required, configure the refresh interval rate for a dashboard or panel by clicking the drop-down arrow next to the refresh icon.
- Click the funnel icon in the dashboard top menu bar to filter dashboard with Template Variables.

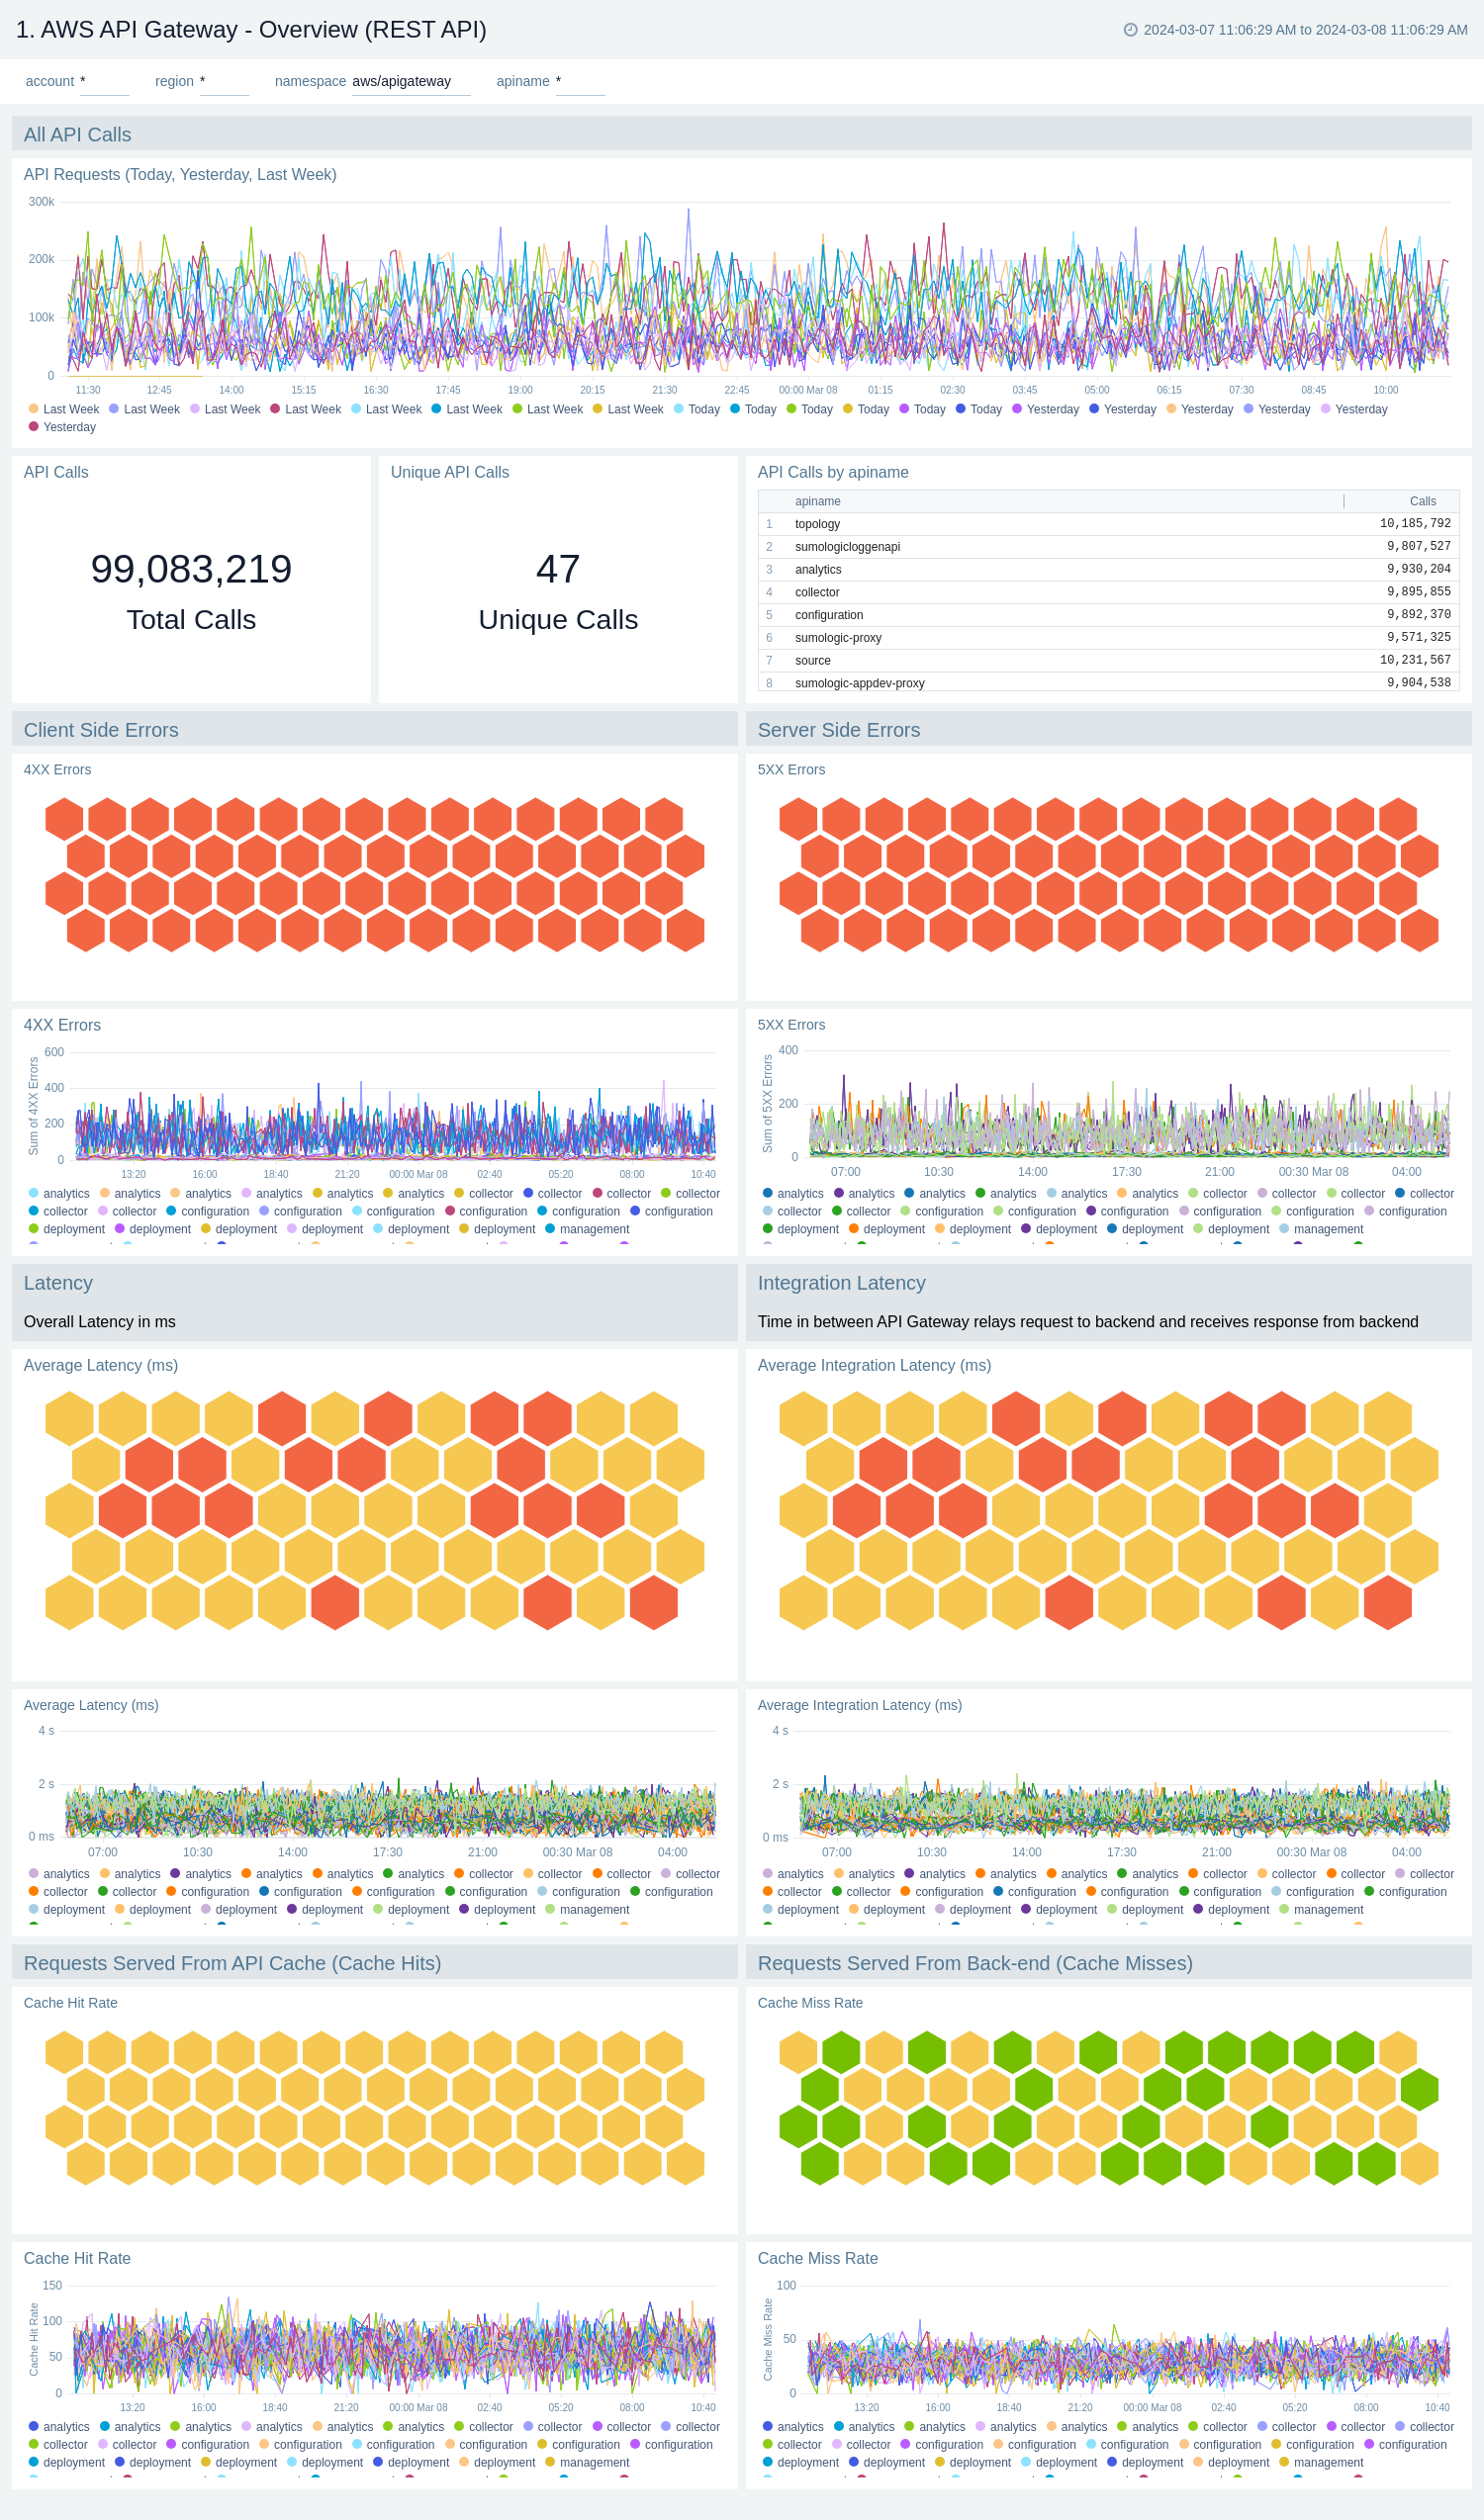
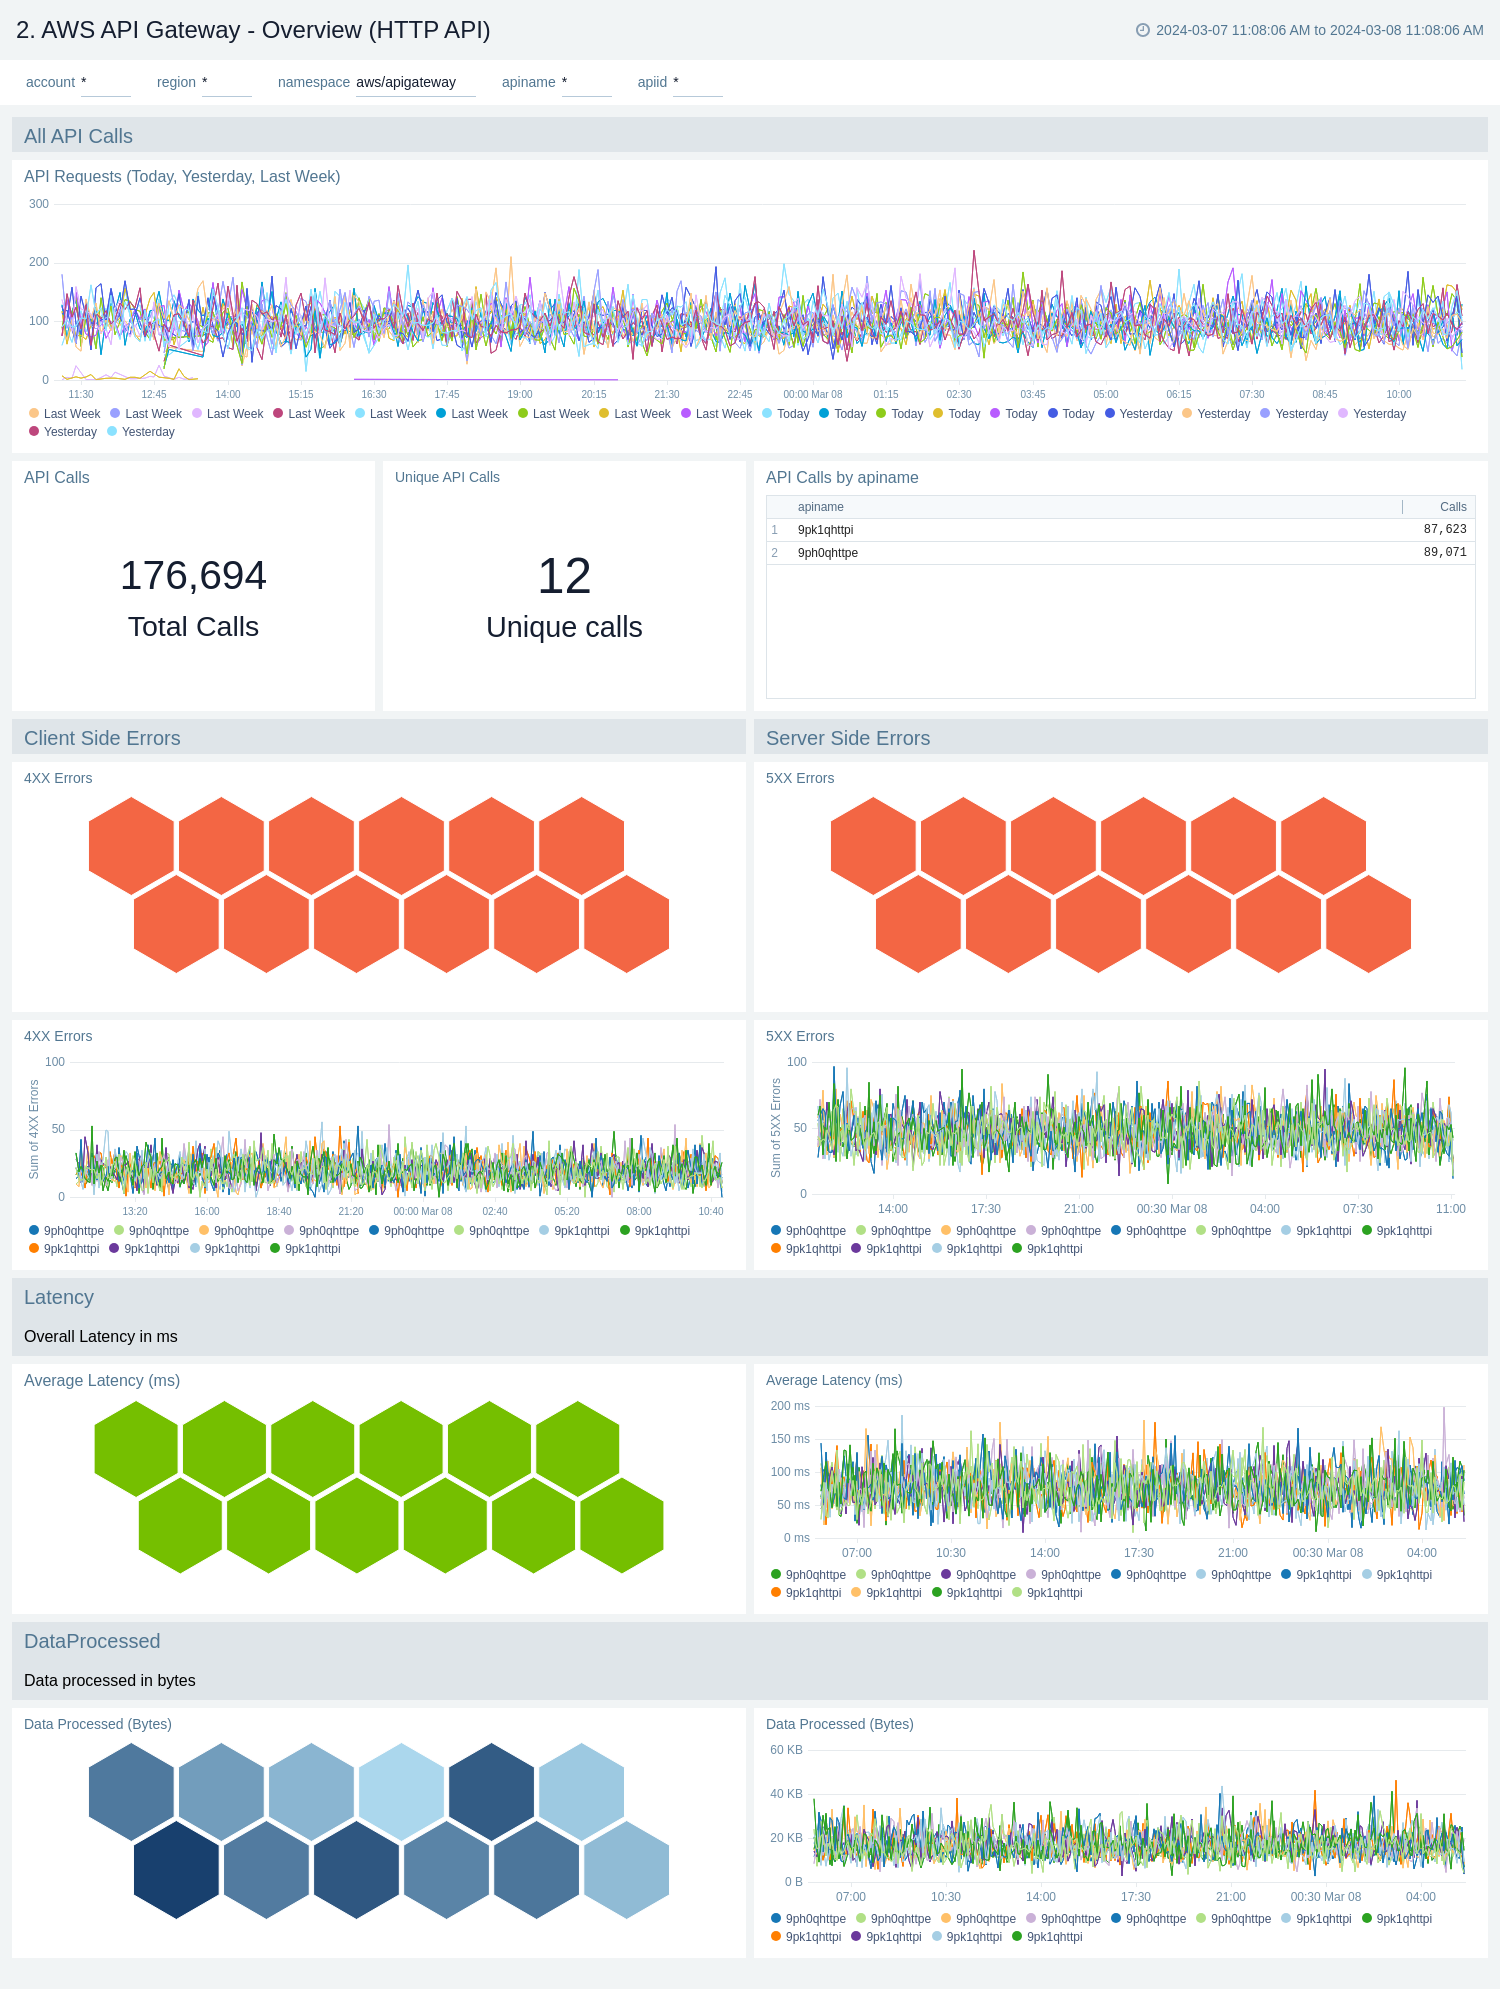
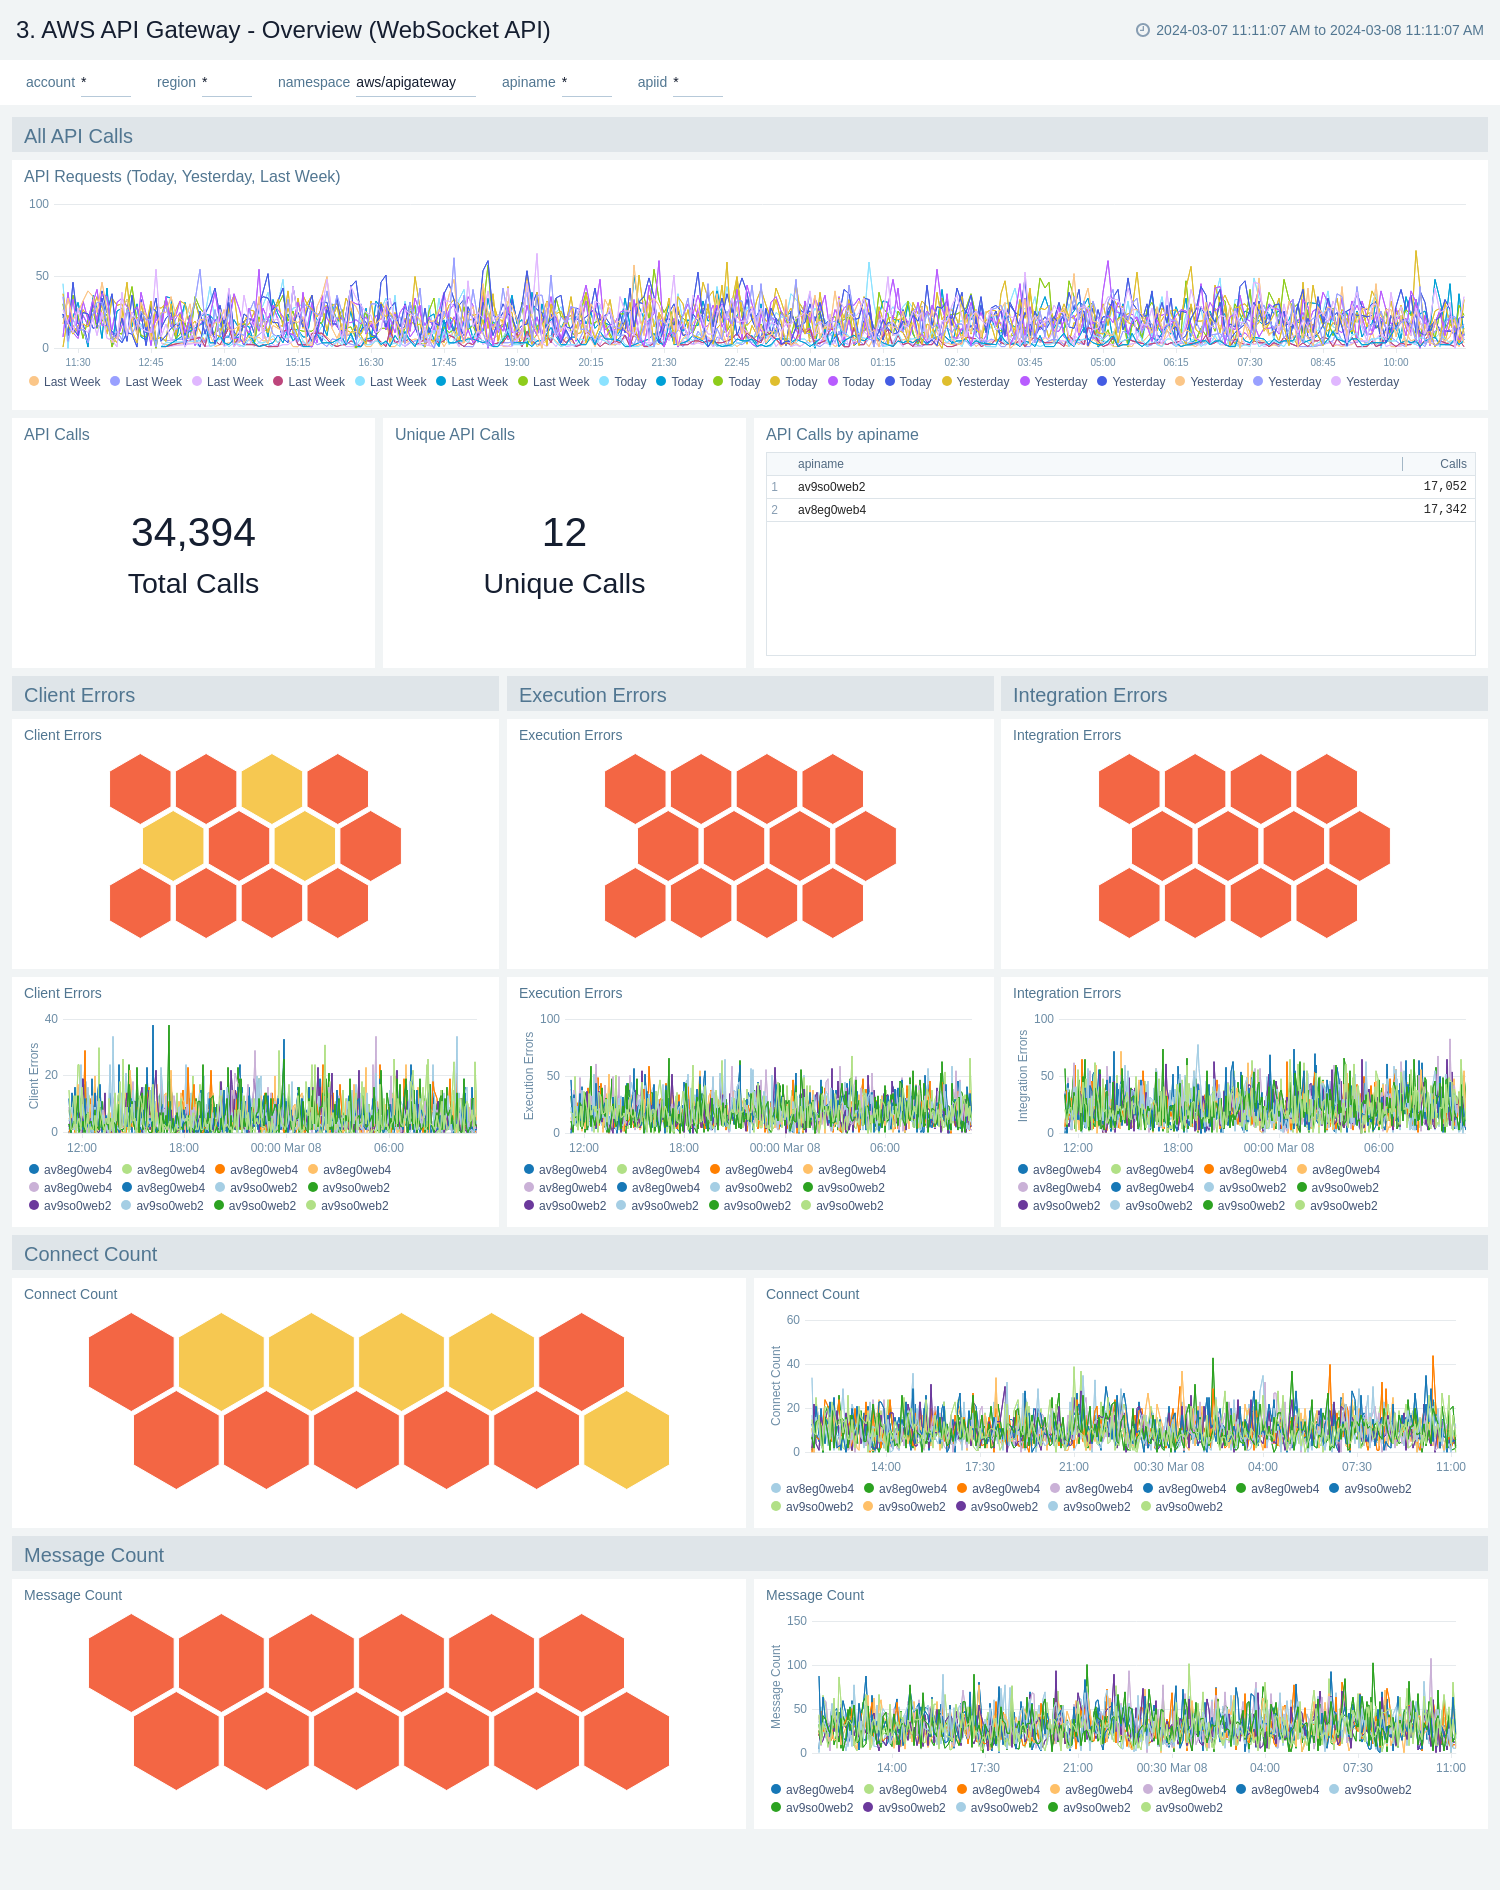
Overview
The AWS API Gateway - Overview dashboards provide insights into API Gateway performance throughout your infrastructure, including API calls, latency, client and server-side errors, connect and message count, data processed, API cache hits, and back-end cache misses.
There are three overview dashboards: AWS API Gateway - Overview (REST API), AWS API Gateway - Overview (HTTP API), and AWS API Gateway - Overview (WebSocket API).
Use these dashboards to:
- Get a high-level overview of your API Gateway infrastructure.
- Compare API requests made today, yesterday, and last week to identify any abnormal deviations in load.
- Get quick statistics on the number of requests and frequently used APIs.
- Monitor the number of client-side and server-side errors processed by API Gateway instances.
- Monitor relative, backend, and overall API responsiveness.
- Monitor API cache hits and misses by API Gateway across your infrastructure to optimize cache capacities and achieve desired performance.
AWS API Gateway - Overview (REST API)
AWS API Gateway - Overview (HTTP API)
AWS API Gateway - Overview (WebSocket API)
Access Logs
Access logs contains information about who has accessed your API and how the caller accessed the API. To populate the dashboards, you must explicitly enable access logs.
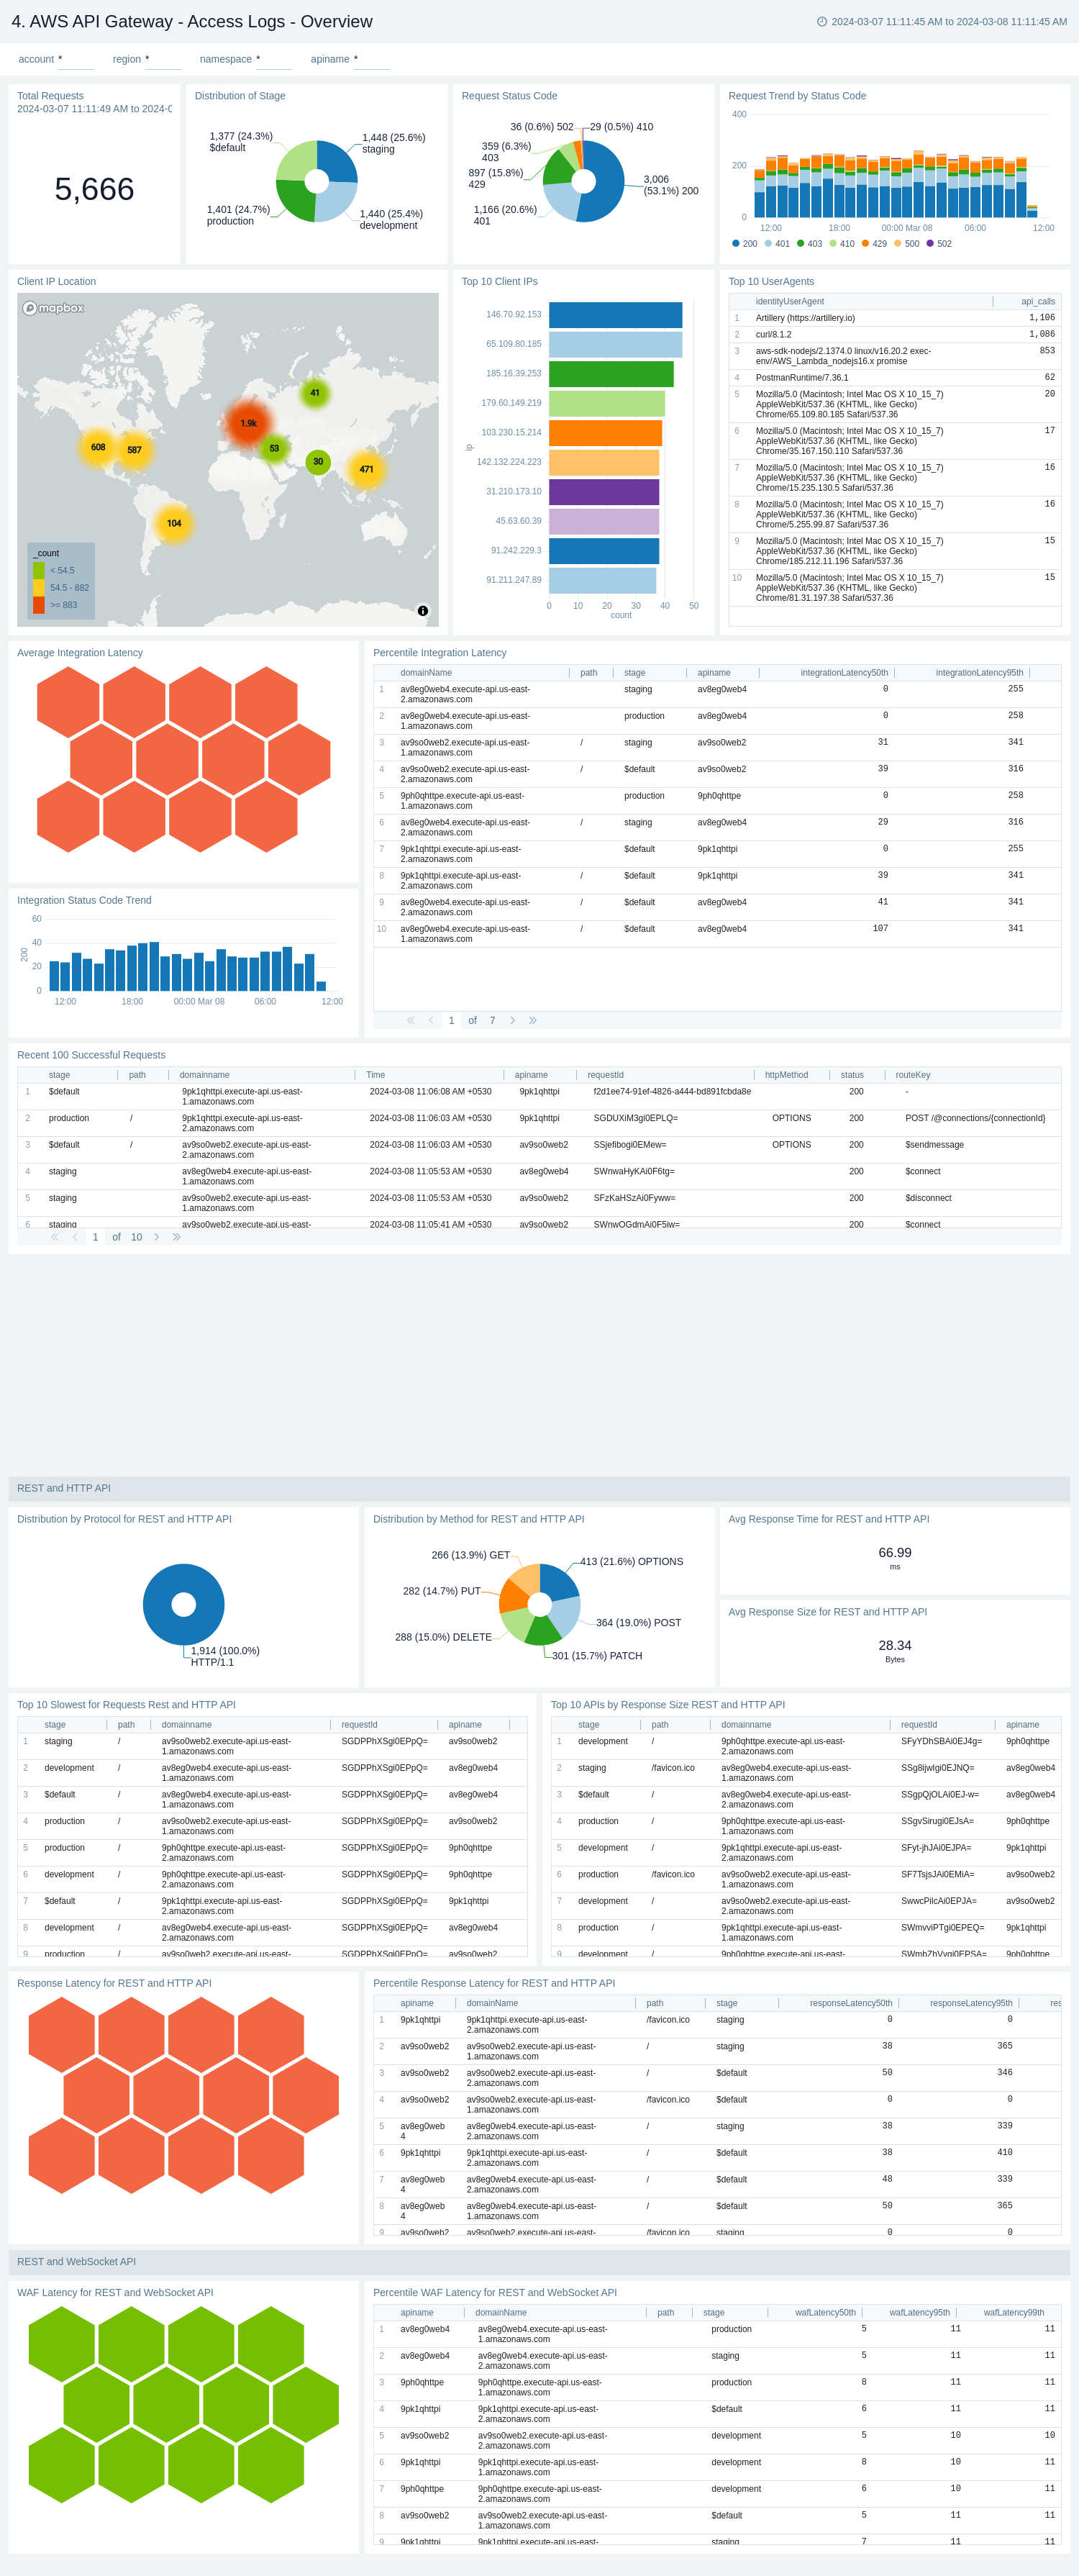
AWS API Gateway - Access Logs - Overview
The AWS API Gateway - Access Logs - Overview dashboard provides insights on Request's latency, Request trend, Distribution of requests by Method, Stage, and Protocol, Client's location, Request status code trend, and slowest requests.
Use this dashboard to:
- Monitor Latency across your infrastructure for all kind of APIs.
- Monitor total API call, average response size, and length and request trend.
- Monitor API requests trend by stage, HTTP method, user agent and protocol.
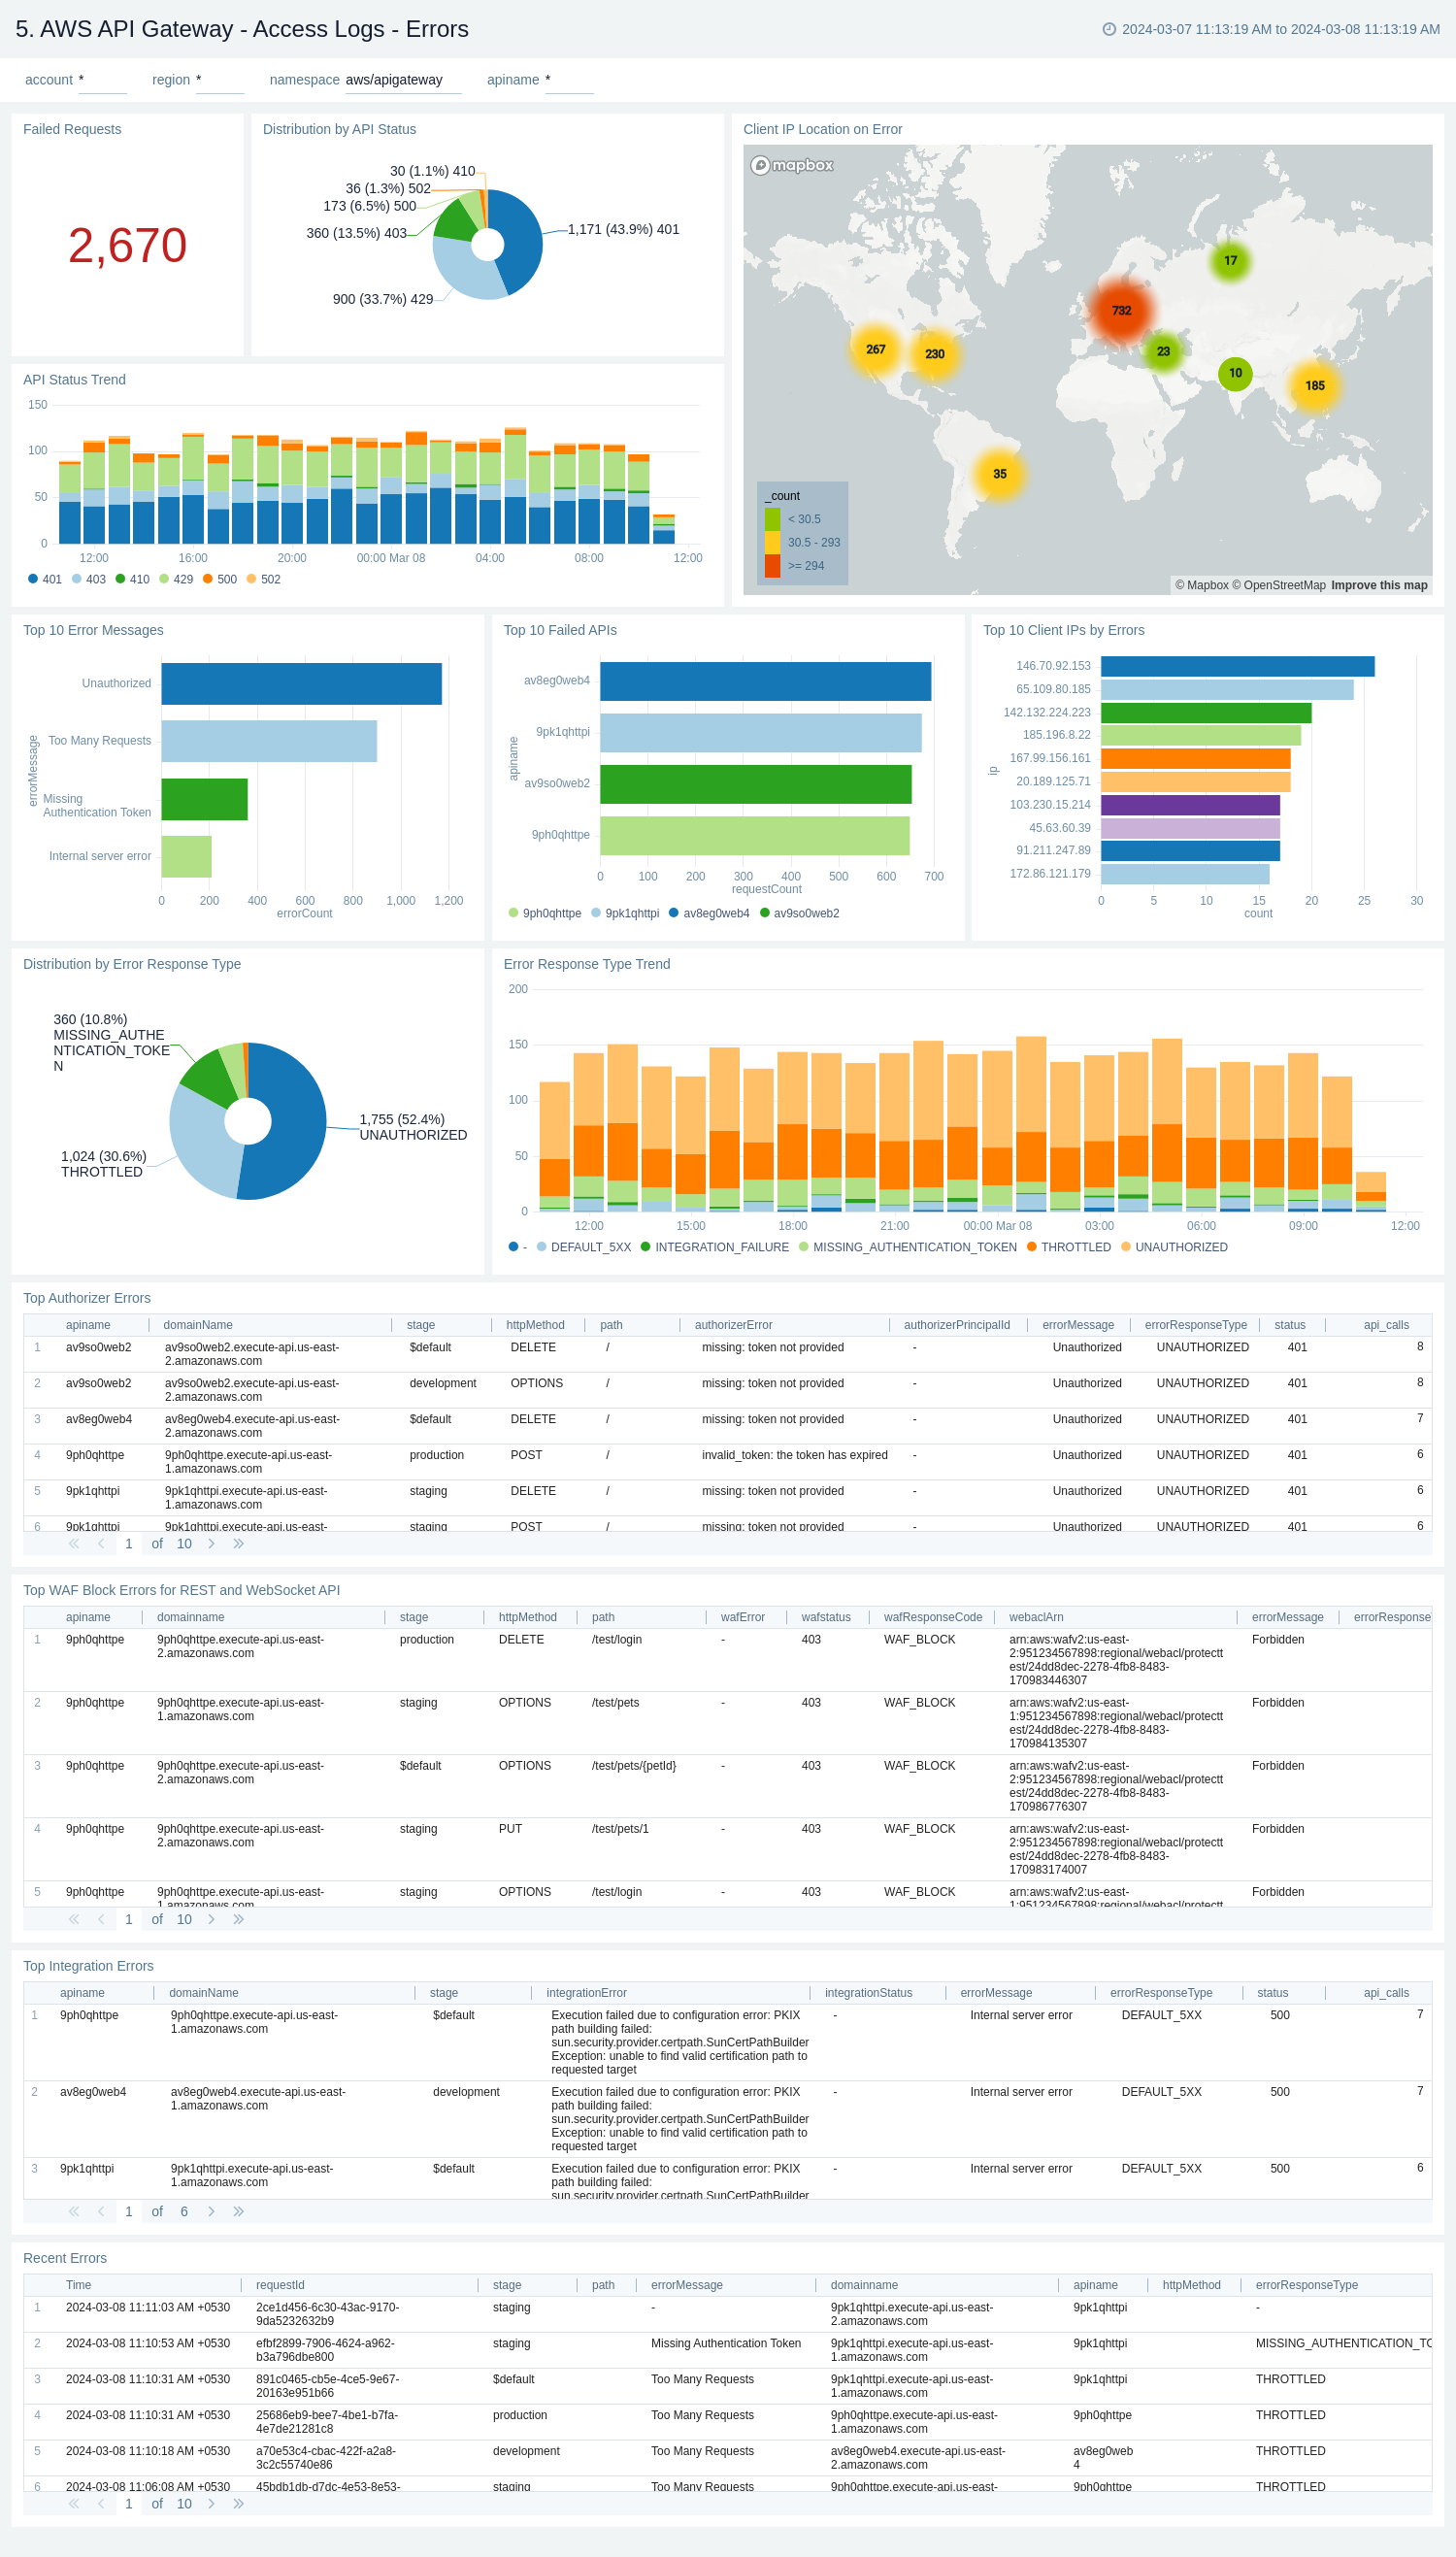
AWS API Gateway - Access logs - Errors
The AWS API Gateway - Access logs - Errors dashboard provides insights on statistics of the top 20 failed requests, error messages trends, client's location, errors by response type, recent authorizer errors, missing authentication token errors, and WAF errors.
Use this dashboard to:
- Monitor all the failed requests, error messages, and their trends.
- Monitor failed requests with their distribution by response type and client IP.
- Monitor recent authorizer and missing authentication token errors.
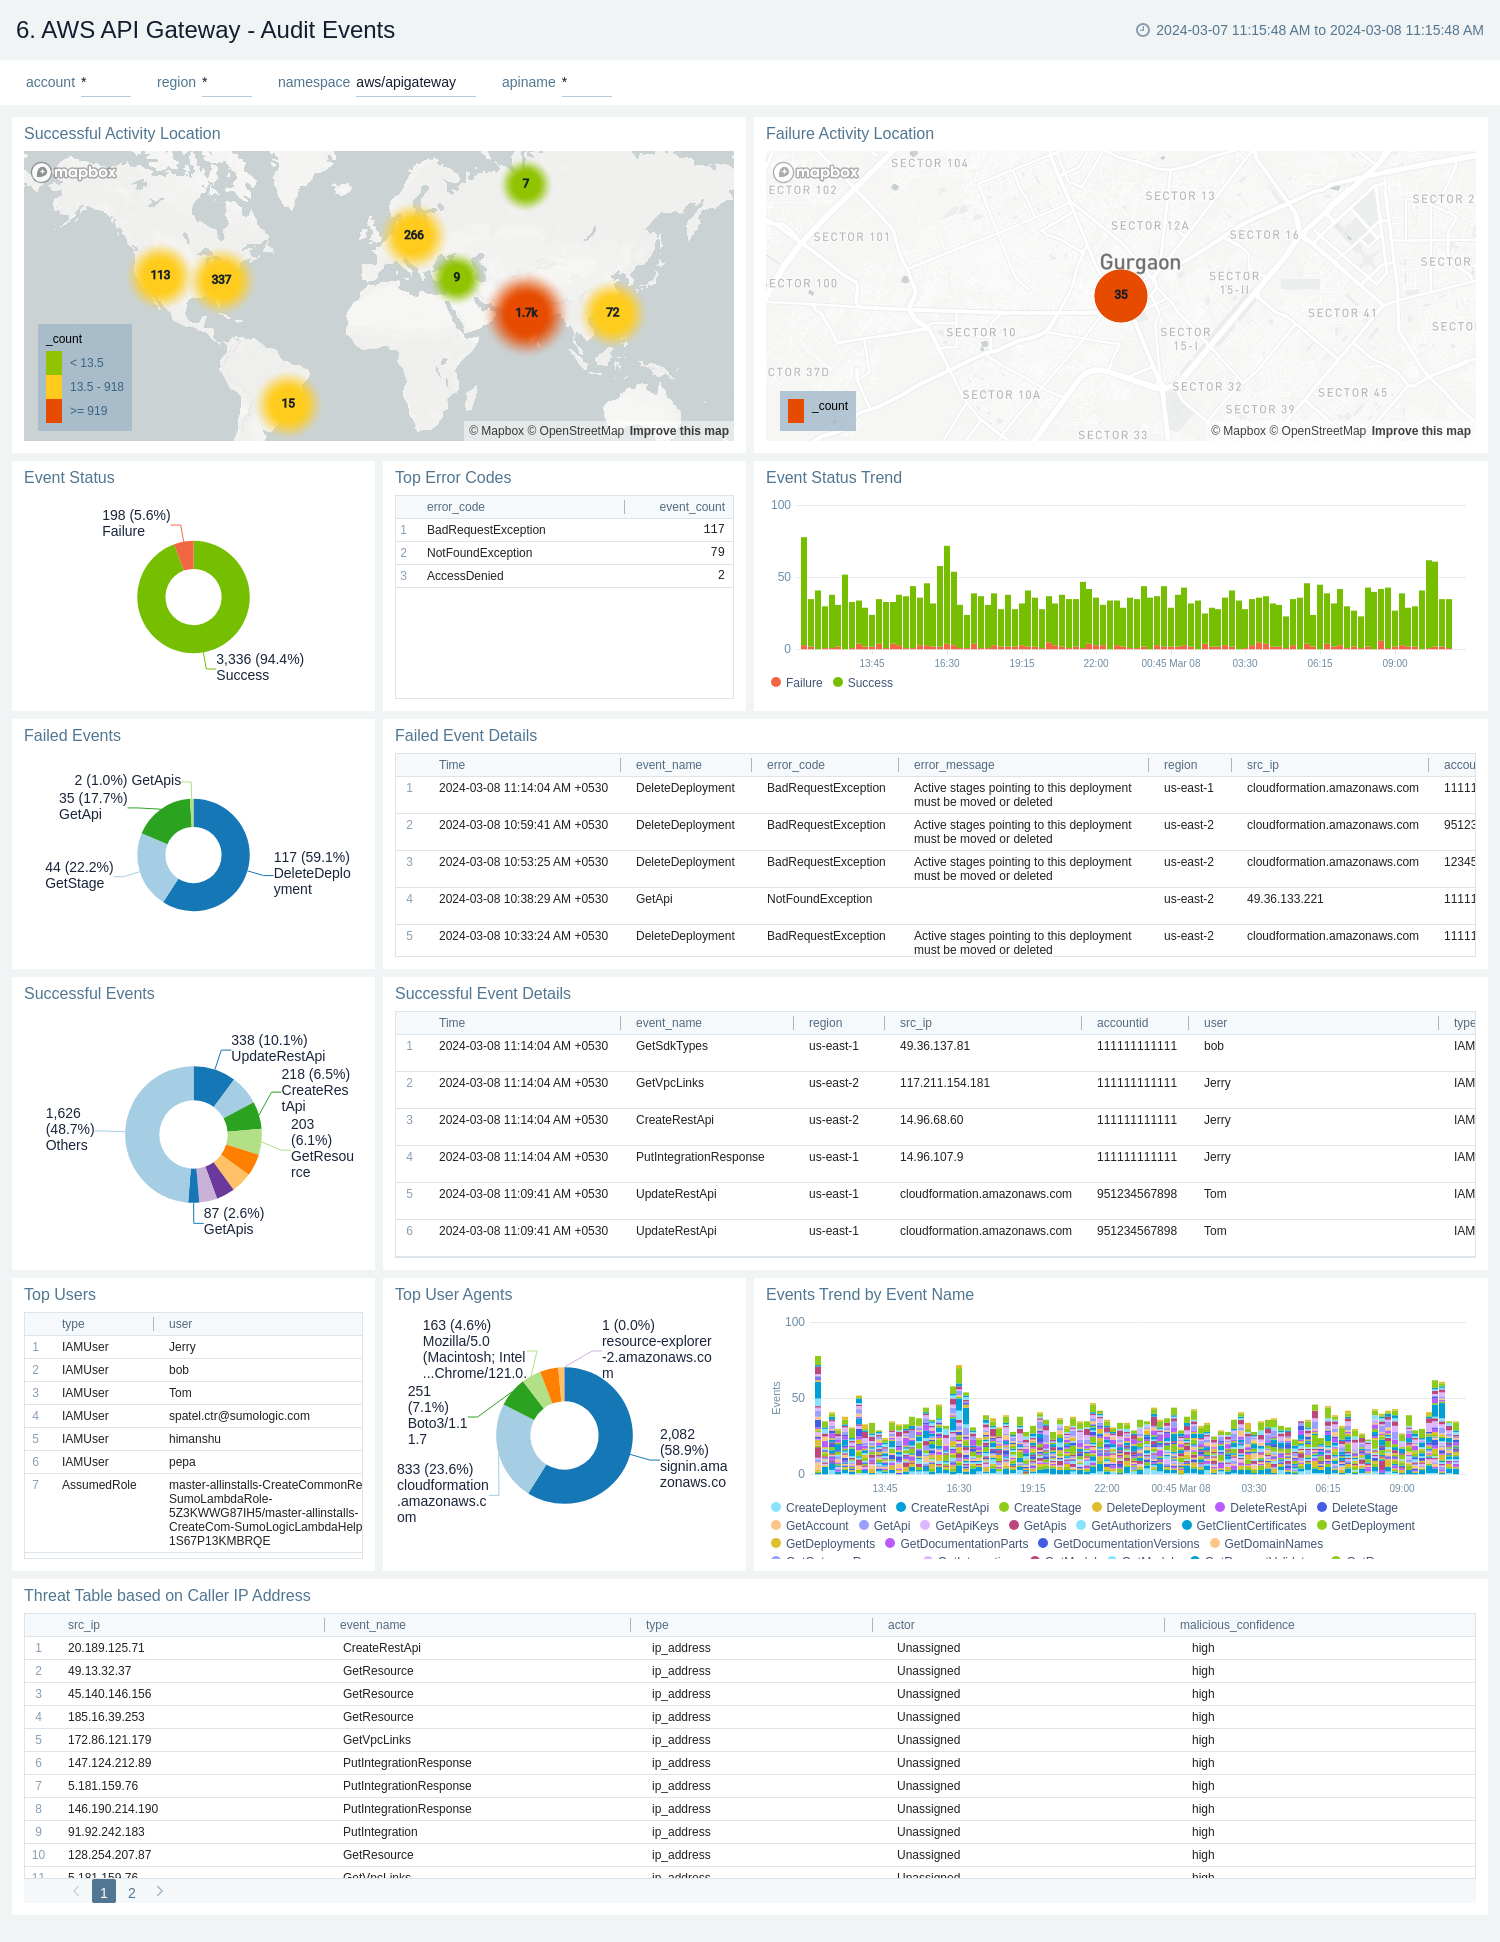
Audit Events
The AWS API Gateway - Audit Events dashboard provides detailed audit insights into API Gateway events by various dimensions including event names, trends, regions, user agents, and recipient account IDs.
Use these dashboards to:
- Monitor all API Gateway-related audit logs available via CloudTrail events.
- Monitor incoming user activity locations for both successful and failed events to ensure the activity matches with expectations.
- Monitor successful and failed API Gateway events, users and user agents / fail activities, and failure reasons.
- Monitor requests coming in from known malicious IP addresses detected via Sumo Logic Threat Intel.
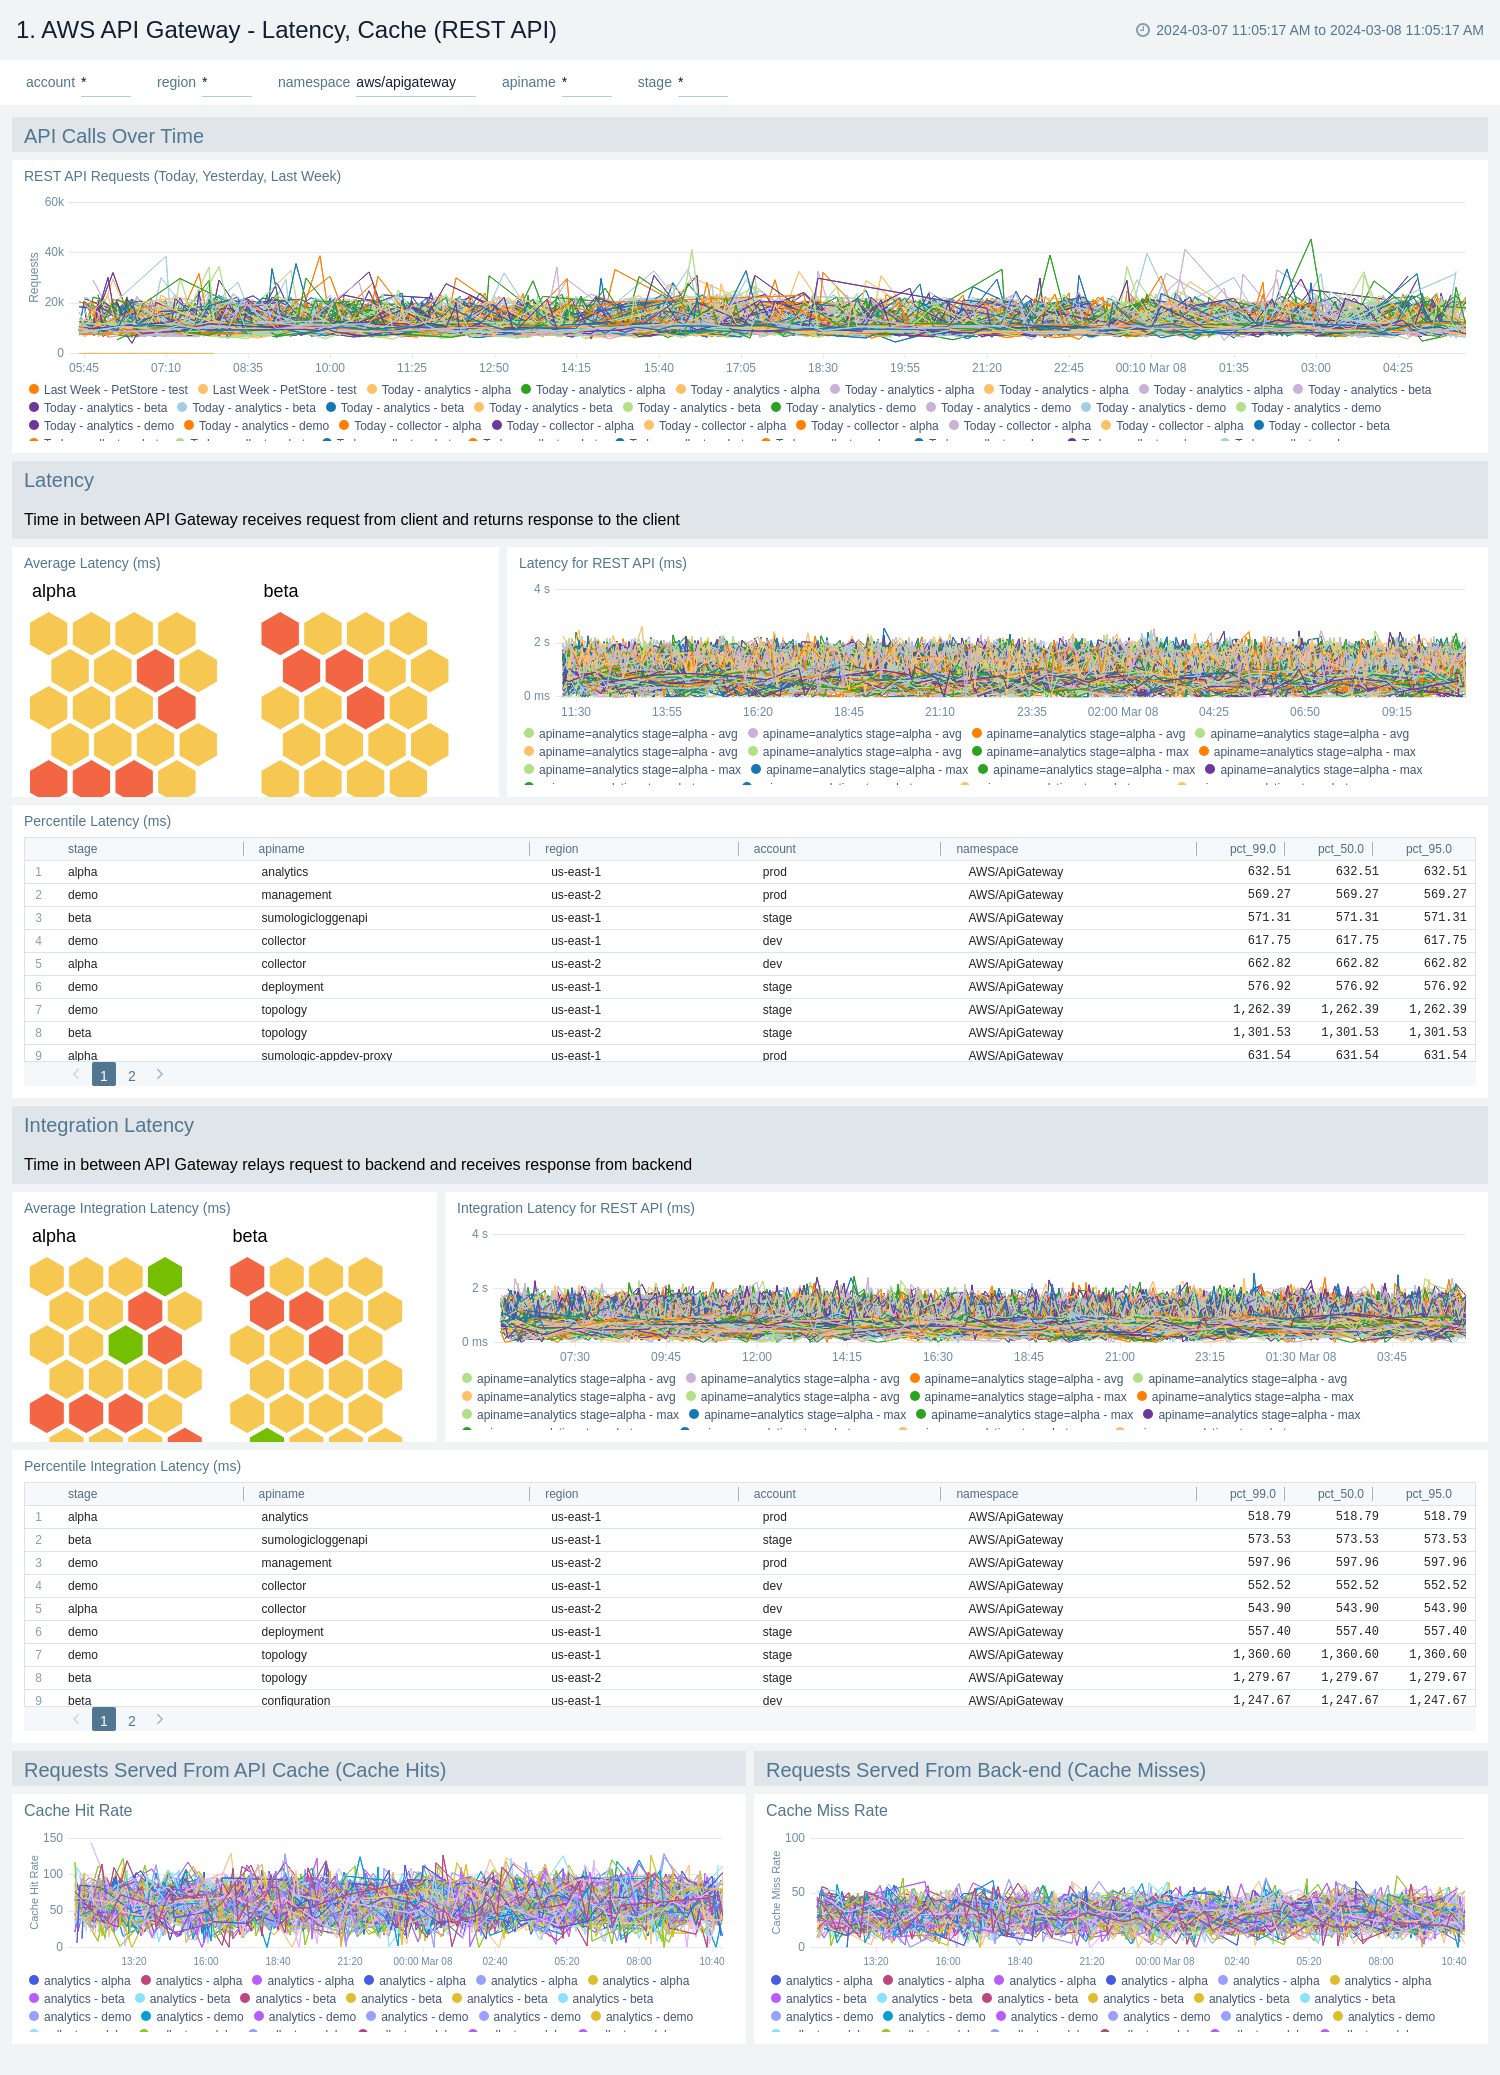
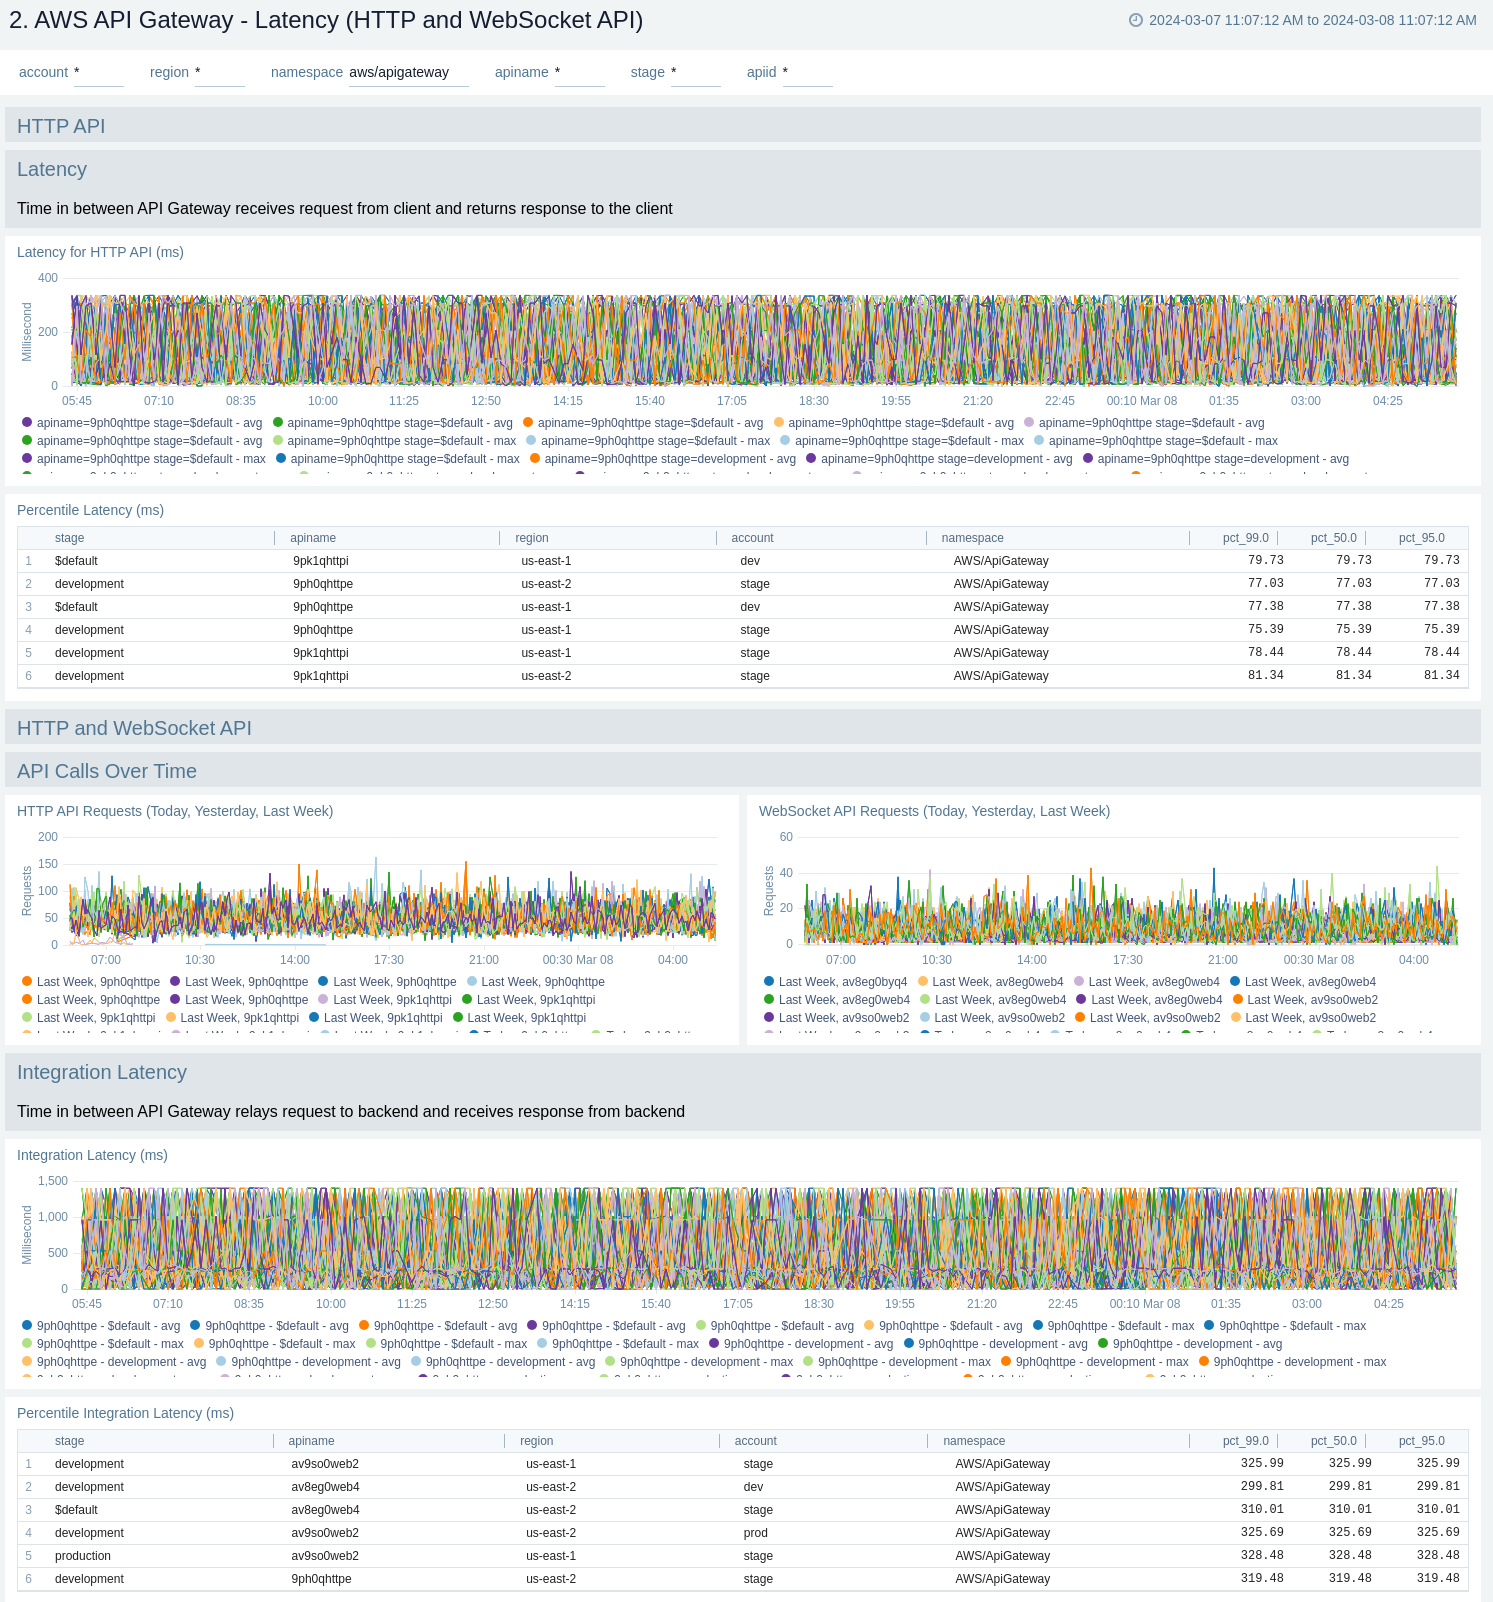
Latency and Cache
The AWS API Gateway - Latency, Cache dashboards provide insights into API Gateway performance including API requests, latency, integration latency, and its statistics, API cache hits, and back-end cache misses.
Cache related panels will populate for apis which have cache enabled.
There are two dashboards related to latency and cache: AWS API Gateway - Latency, Cache (REST API) and AWS API Gateway - Latency (HTTP and WebSocket API).
Use these dashboards to:
- Monitor the overall responsiveness of API calls (latency), comparing times (in milliseconds) between receiving a request from and returning a response to a client.
- Monitor the responsiveness of the backend (integration latency), comparing times (in milliseconds) between API Gateway relay requests to and receiving a response back from the backend.
- Monitor API cache hits and misses to optimize cache capacities across your infrastructure and achieve desired performance.
- Compare API requests made today, yesterday, and last week to identify any abnormal deviations.
AWS API Gateway - Latency, Cache (REST API)
AWS API Gateway - Latency (HTTP and WebSocket API)
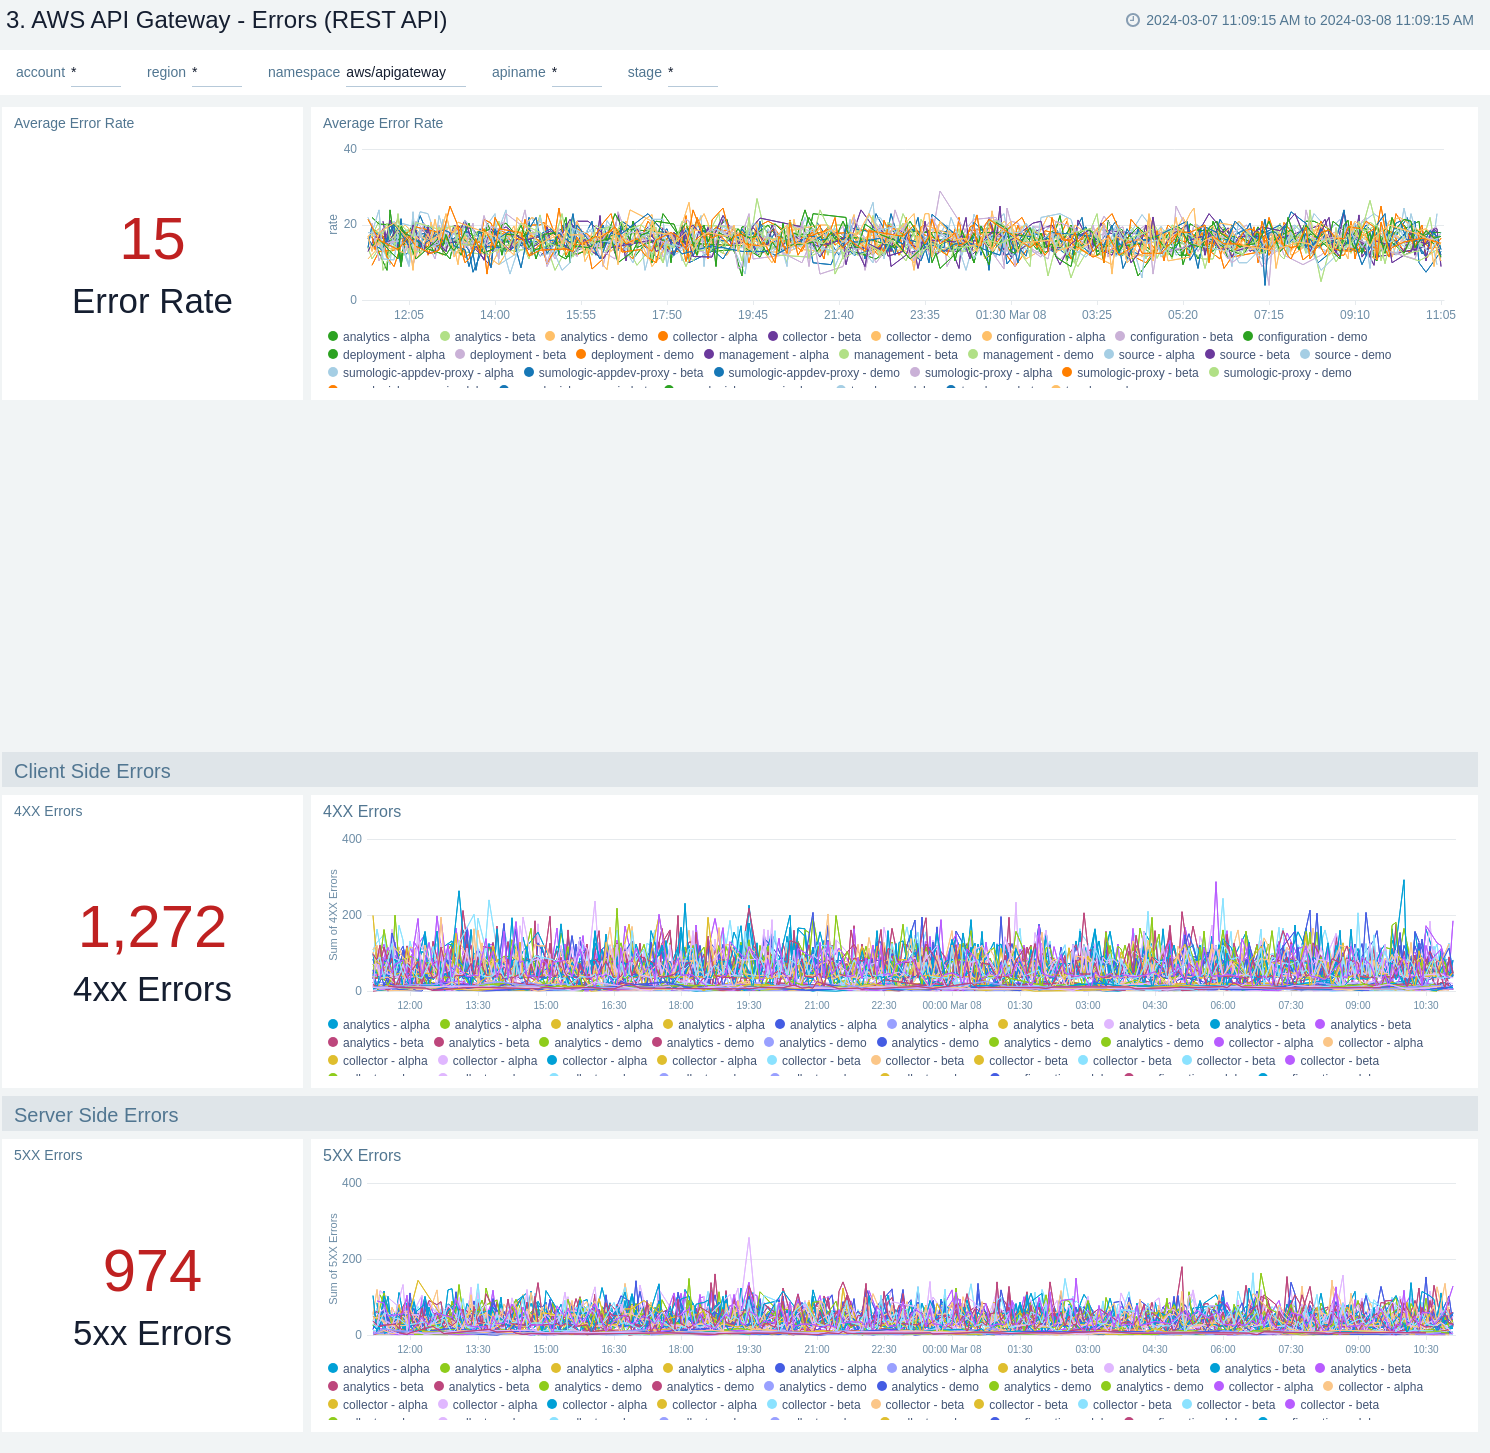
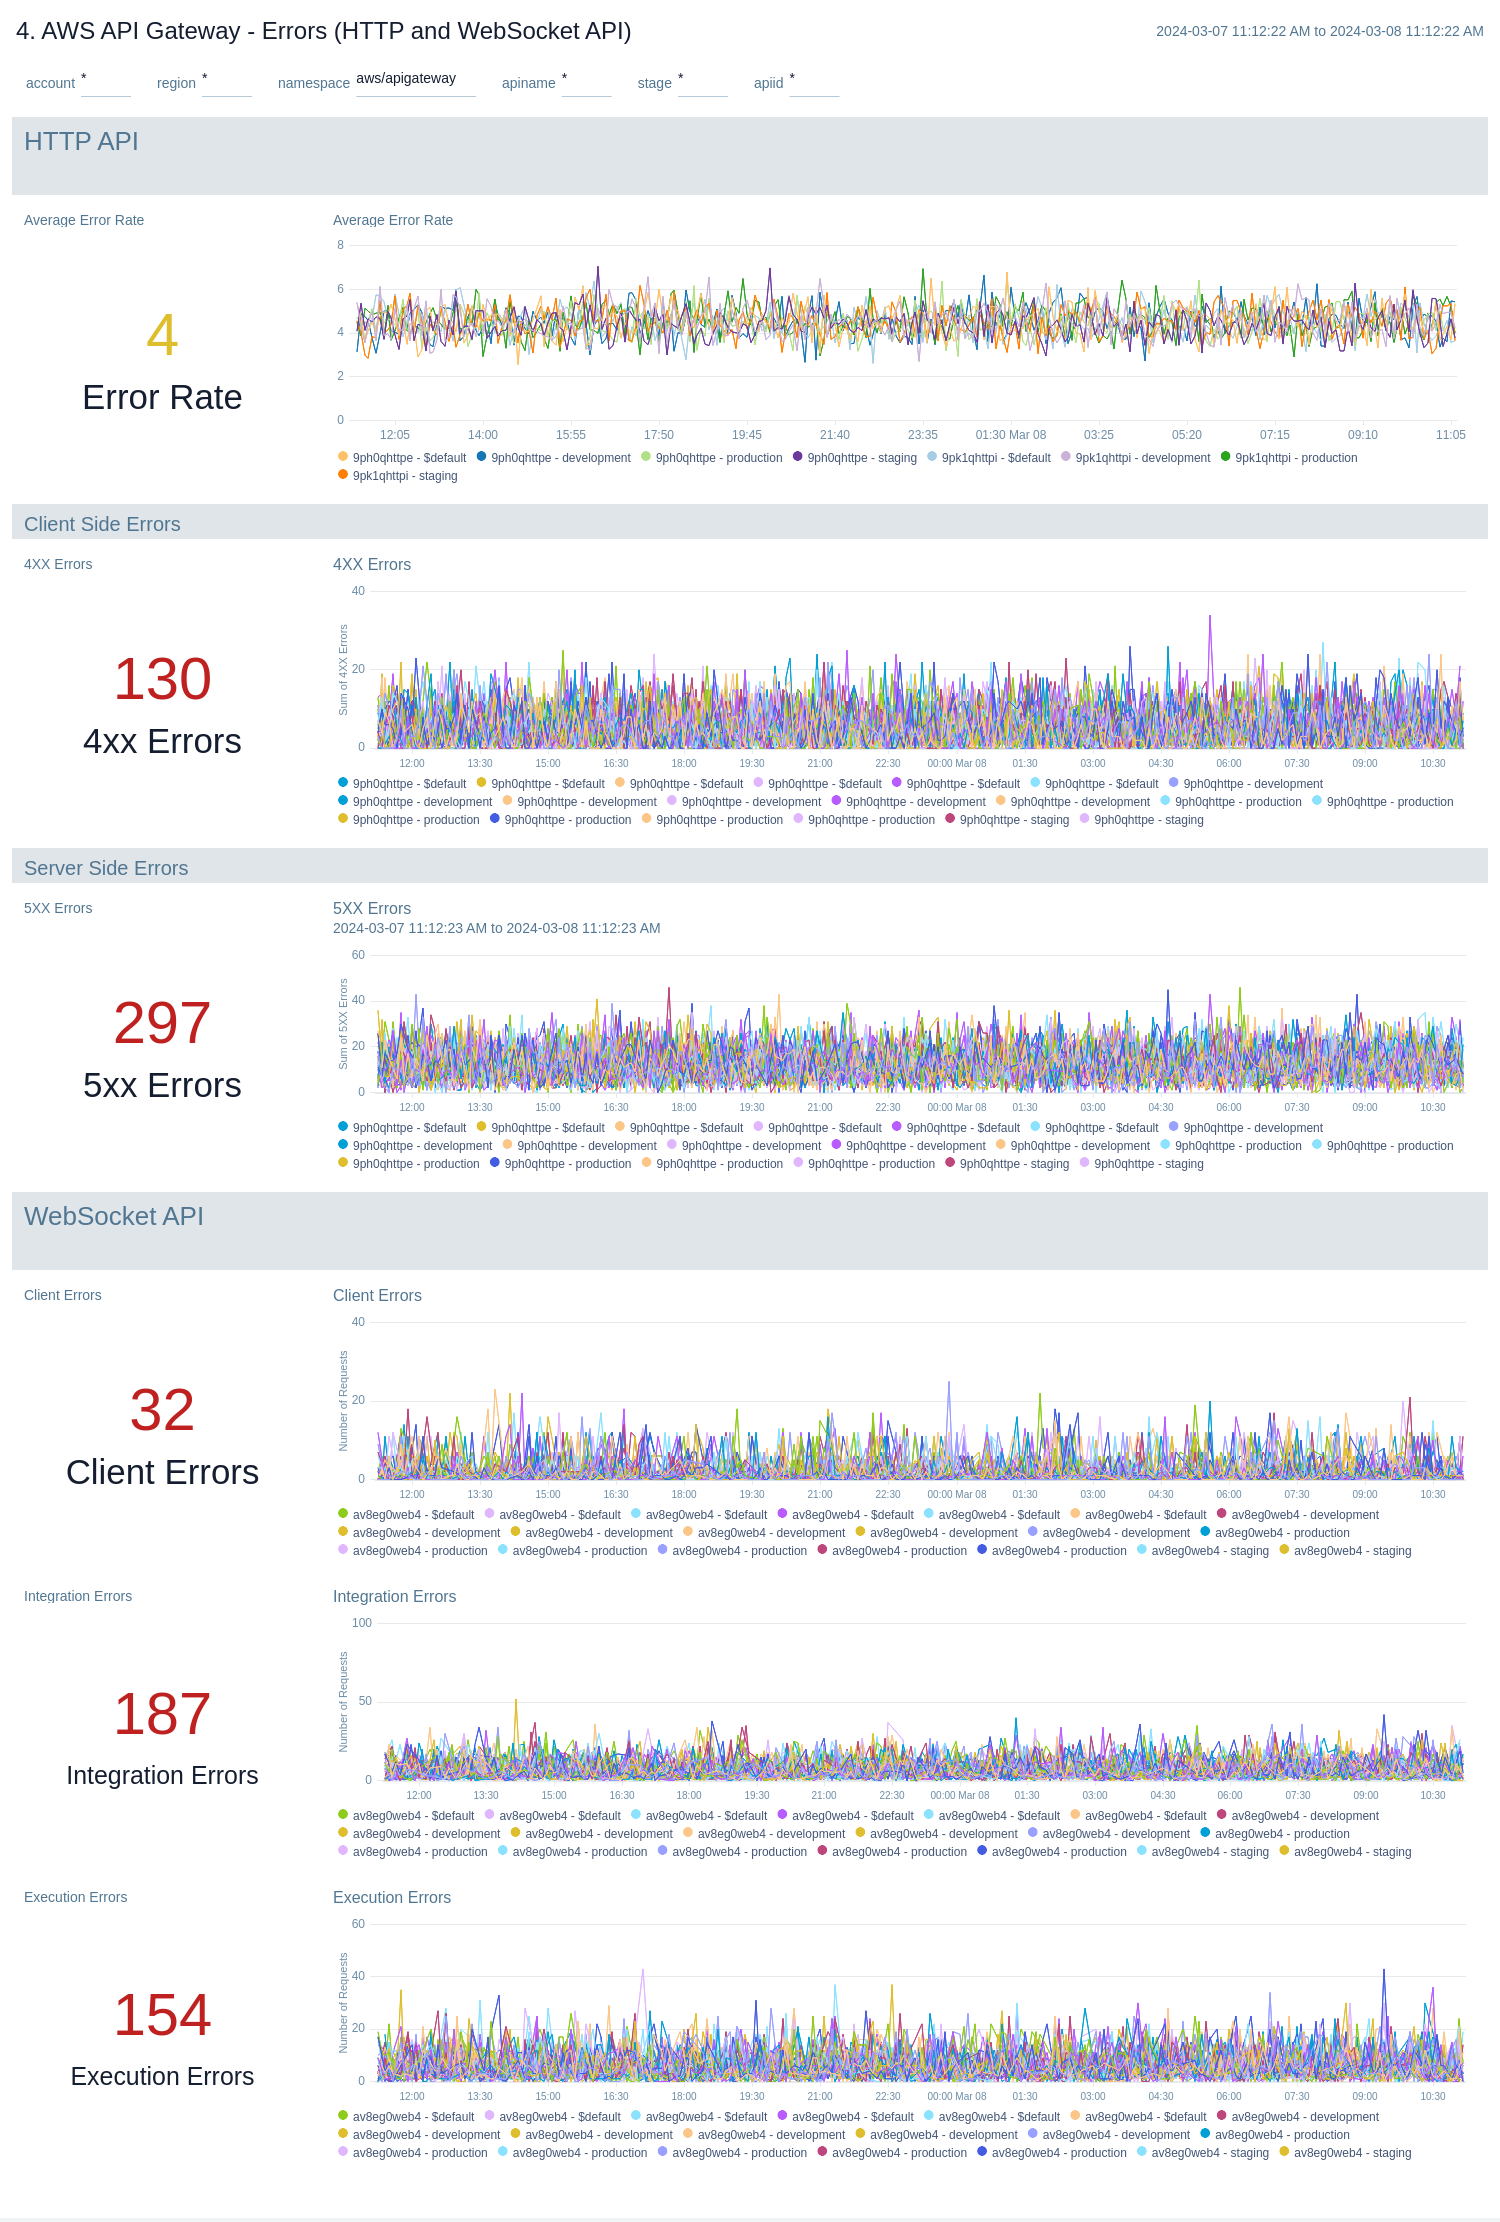
Errors
The AWS API Gateway - Errors dashboards provide insights into API Gateway HTTP 4xx and 5xx code errors throughout your infrastructure, including API requests, client errors, integration errors, execution errors, client-side errors, and server-side errors.
There are two dashboards related to errors: AWS API Gateway - Errors (REST API) and AWS API Gateway - Errors (HTTP and WebSocket API).
Use these dashboards to:
- Monitor the total number of client-side errors based on API name and region across your infrastructure.
- Monitor the total number of server-side errors based on API name and region across your infrastructure.
- Monitor the total number of client, integration and execution errors based on API name and region across your infrastructure.
- Compare API requests made today, yesterday, and last week to identify any abnormal deviations.
AWS API Gateway - Errors (REST API)
AWS API Gateway - Errors (HTTP and WebSocket API)
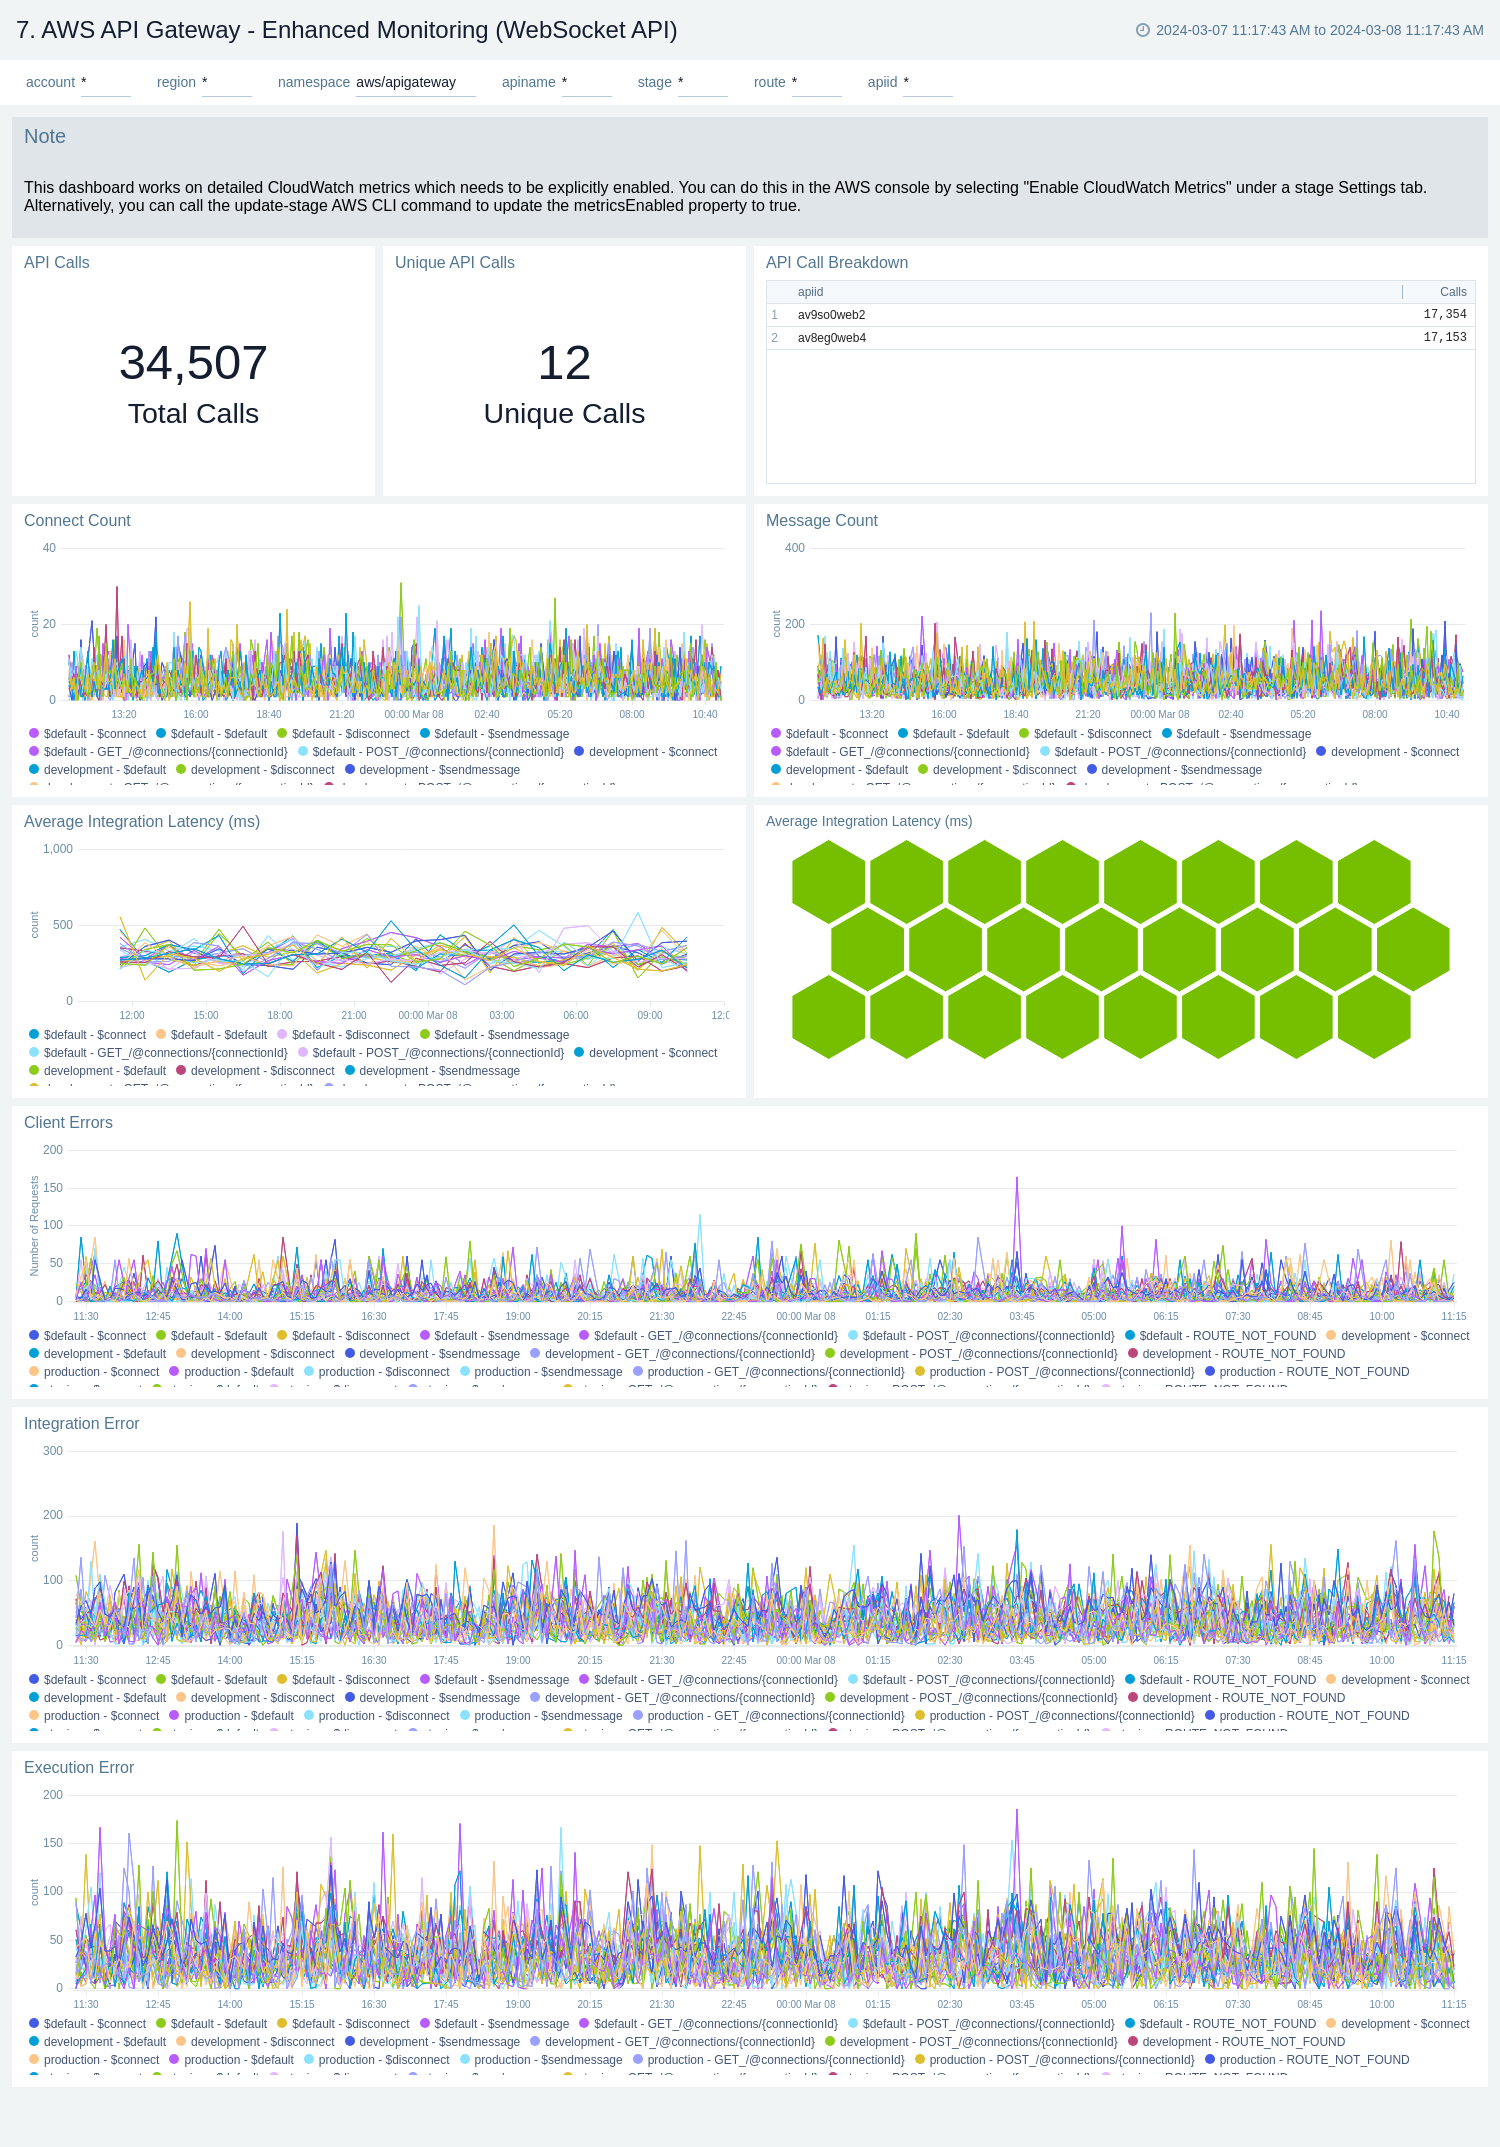
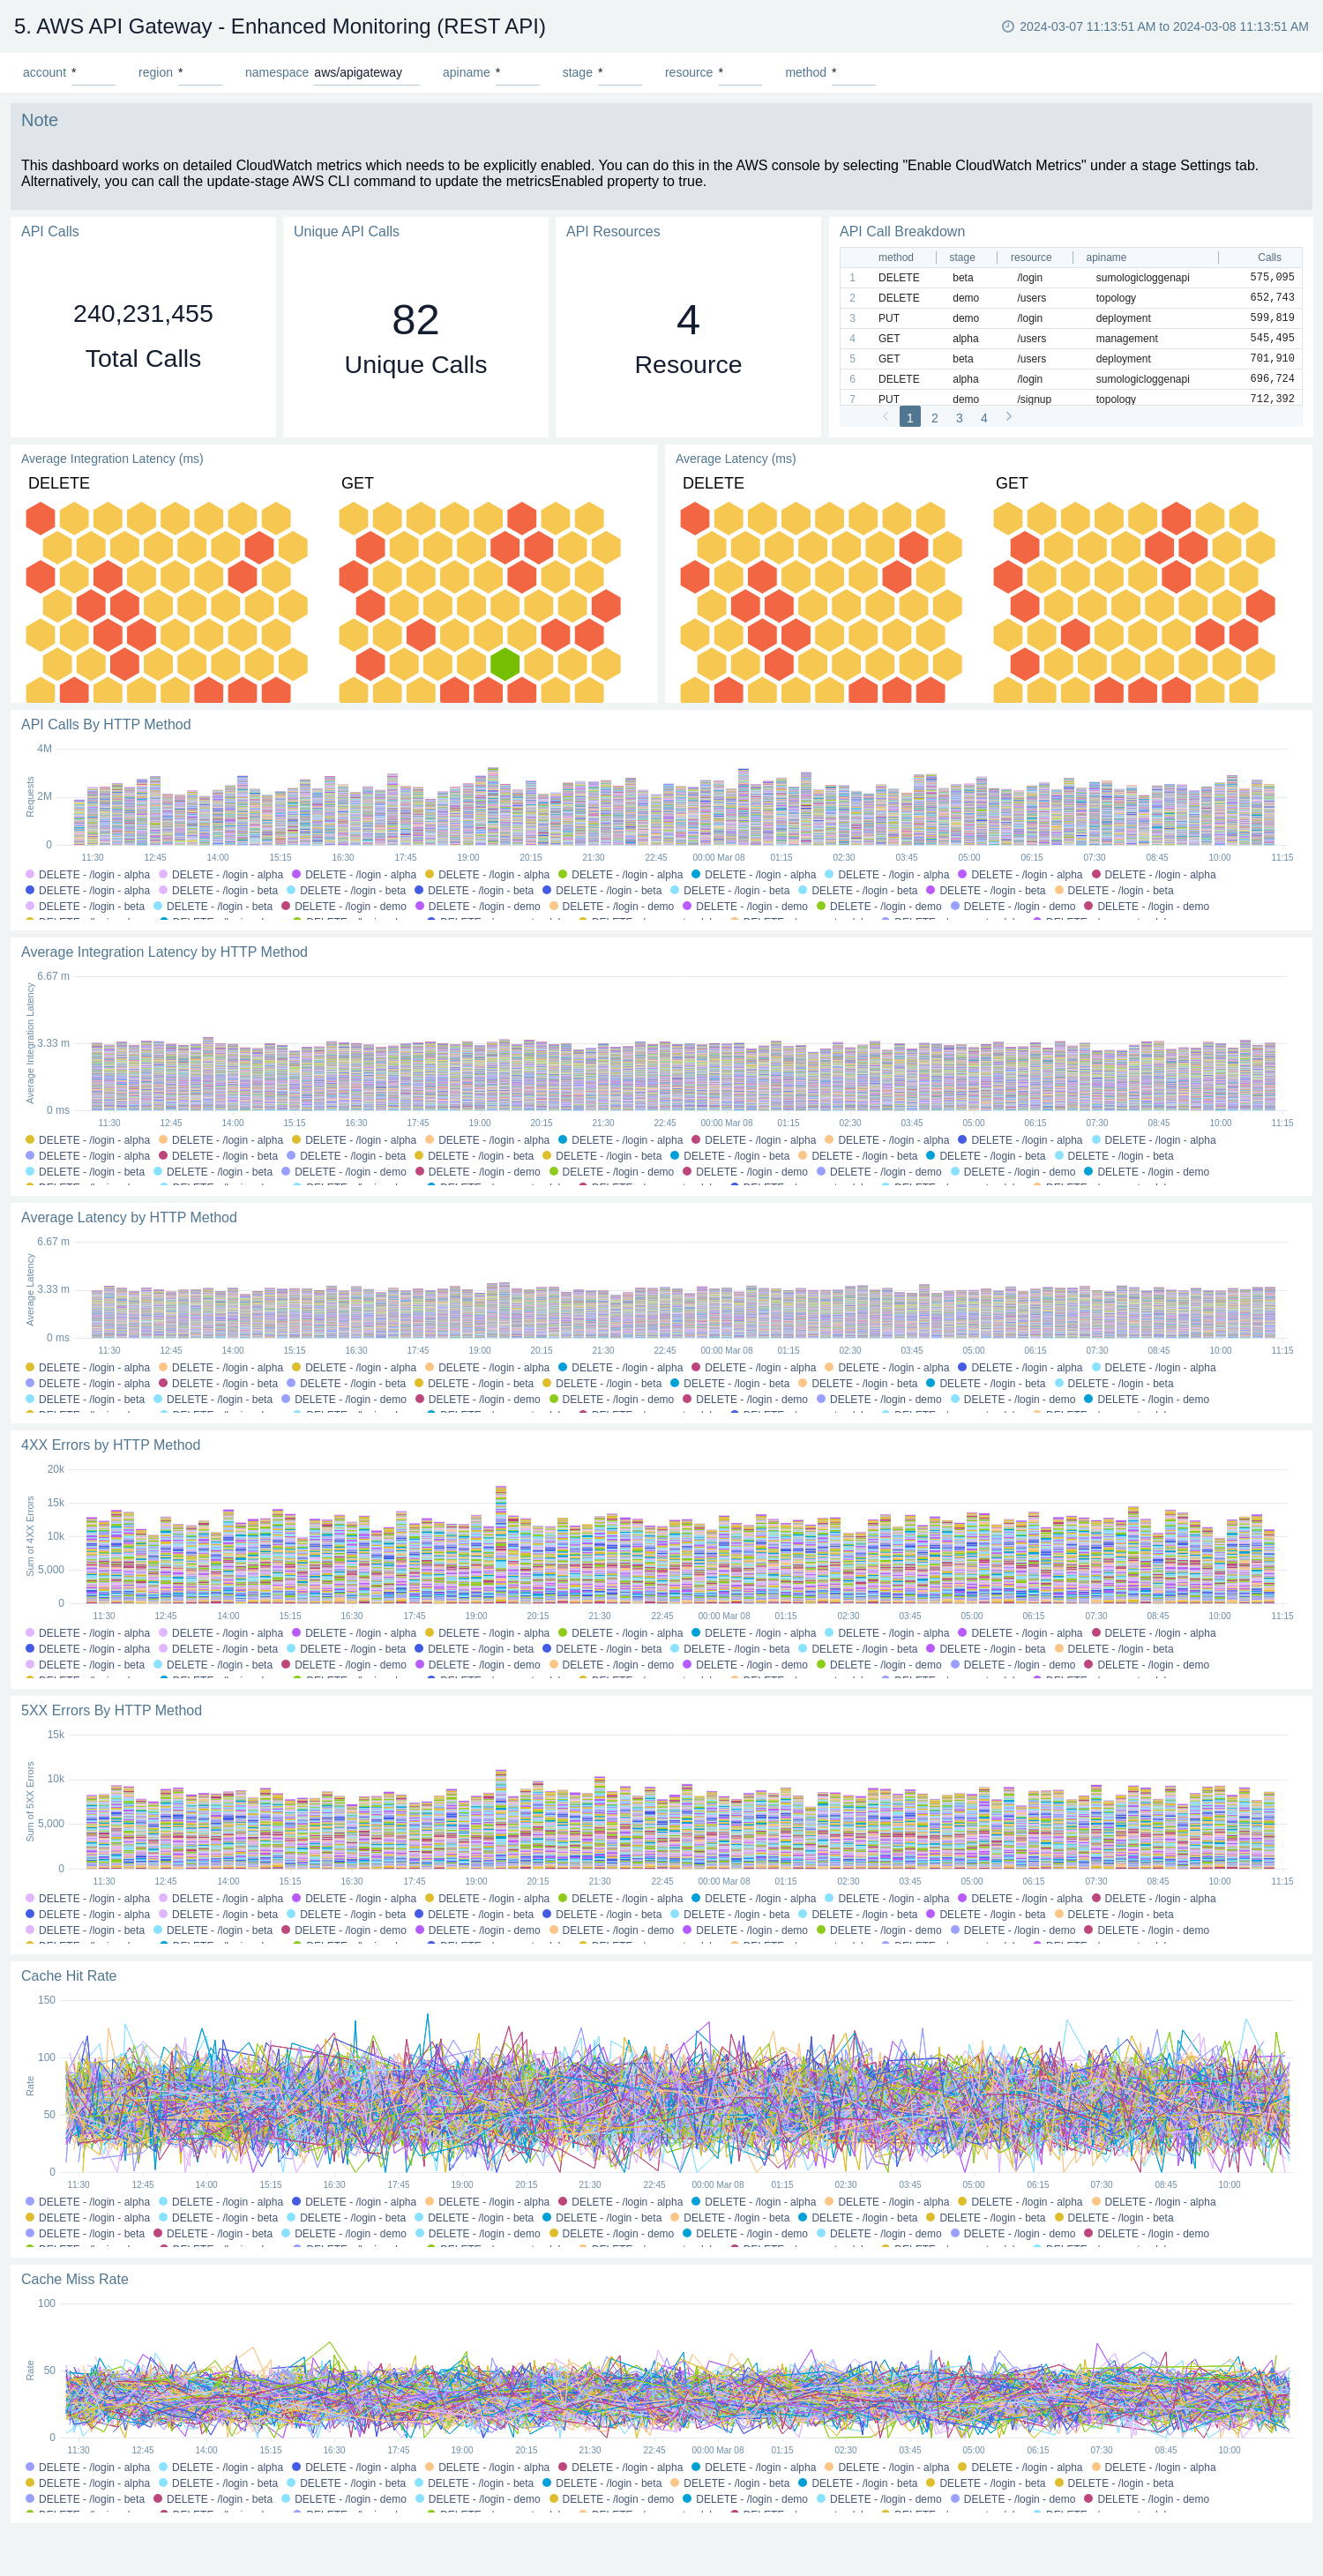
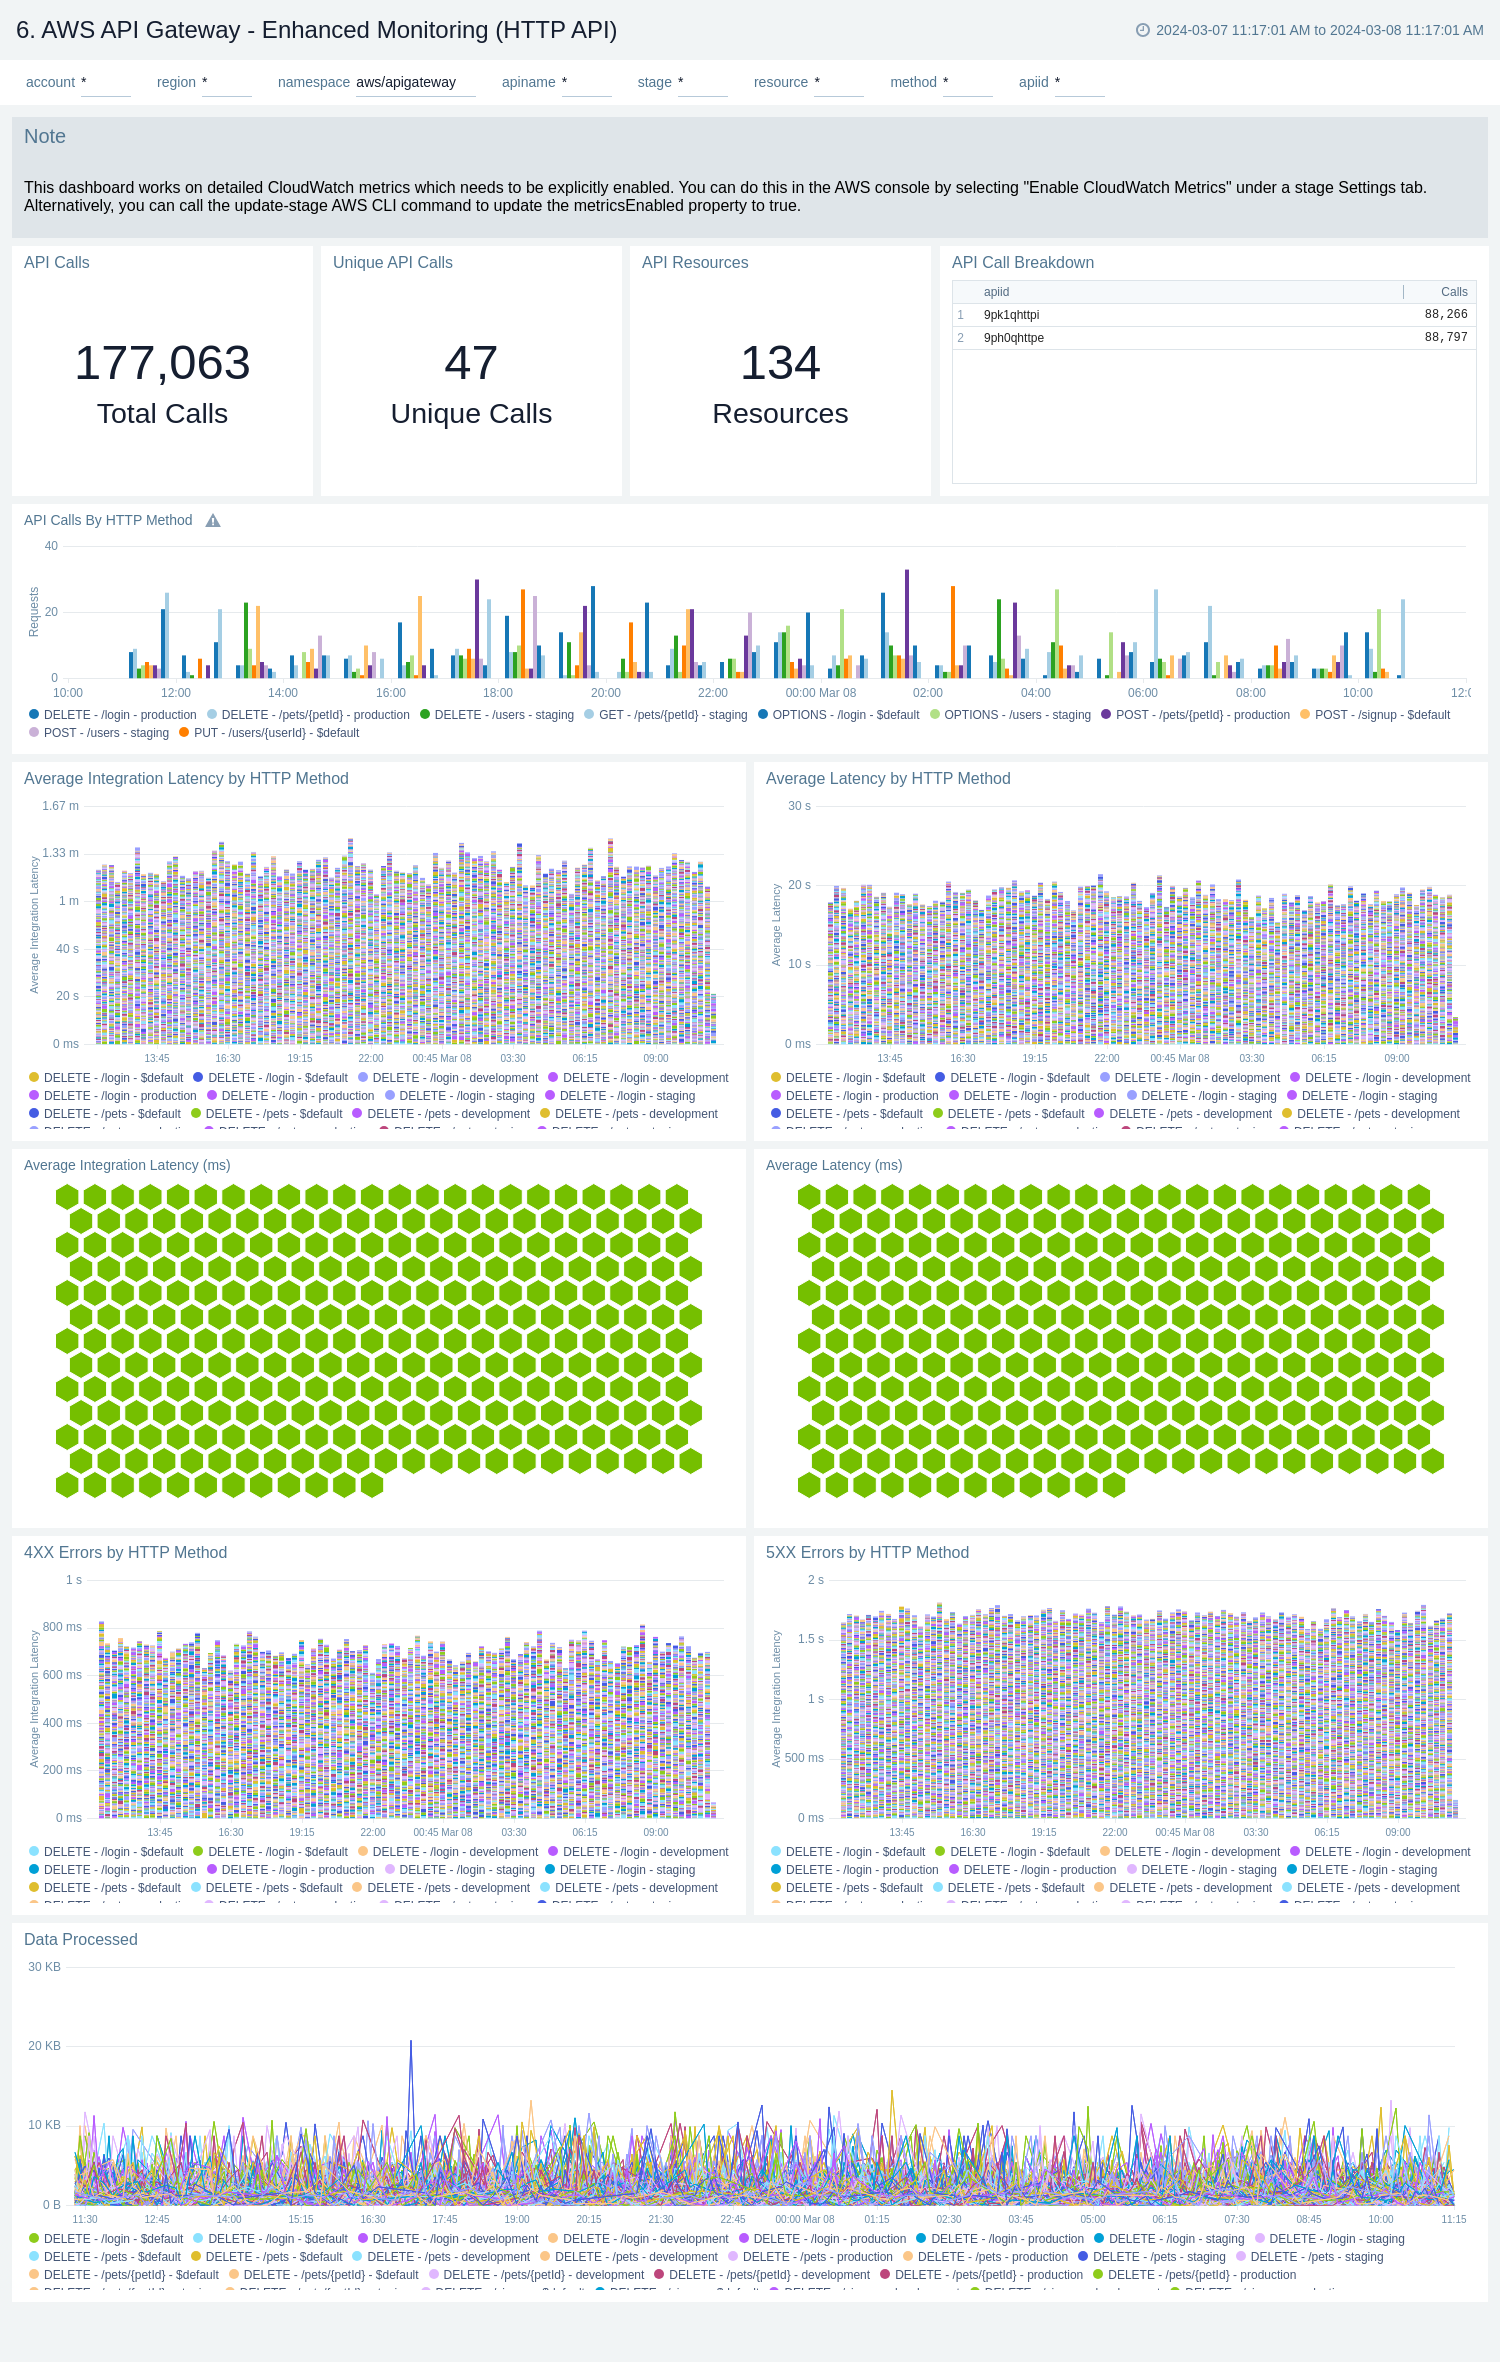
Enhanced Monitoring
The AWS API Gateway - Enhanced Monitoring dashboards provide detailed insights into API Gateway performance throughout your infrastructure, including the number and types of API calls, API resources, cache hits, and misses, latency averages, data processed, and errors by HTTP method, resource and stage.
To populate the dashboards, you must explicitly enable detailed CloudWatch metrics.
There are three dashboards related to enhanced monitoring: AWS API Gateway - Enhanced Monitoring (REST API), AWS API Gateway - Enhanced Monitoring (HTTP API), and AWS API Gateway - Enhanced Monitoring (WebSocket API).
Use these dashboards to:
- Monitor API Gateways across your infrastructure using enhanced metrics.
- Monitor API requests trend by resource, HTTP method, and deployment stage.
- Monitor API cache hits and misses to optimize cache capacities to achieve desired performance.
- Monitor the overall responsiveness of API calls and the backend origin servers
- Monitor the total number of client-side and server-side errors based on HTTP methods
AWS API Gateway - Enhanced Monitoring (REST API)
AWS API Gateway - Enhanced Monitoring (HTTP API)
AWS API Gateway - Enhanced Monitoring (WebSocket API)