Introduction to the Automation Service
This section introduces the Automation Service in a class-style format. For the best learning experience, follow the exercises in order from start to finish.
The Sumo Logic Automation Service is a key set of automation features integrated with Sumo Logic's Log Analytics Platform and Cloud SIEM. Automations allow you to set up actions to run automatically when certain conditions are met. Automated actions allow your organization to respond quickly and without necessarily needing human input to a wide array of security events and incidents. Automated actions can include integrations provided by Sumo Logic as well as third-party vendors. Actions can be customized, and you can create your own as well.
The Automation Service is a subset of automation capabilities adapted from Sumo Logic Cloud SOAR. These capabilities are available to all Sumo Logic users, even if you are not a Cloud SOAR customer.
The Automation Service differs from Cloud SOAR in the following ways:
- The Automation Service does not include the incident and case management features from Cloud SOAR.
- The Automation Service does not support daemon and trigger action types. The Automation Service can only use triggers built into Cloud SIEM and the Log Analytics platform.
- Playbooks, integrations, and actions available in the Automation Service may differ from those in Cloud SOAR automation.
For full information on feature differences, see Cloud SOAR Compared to the Automation Service.
In this article, we will walk you through how the Automation Service works, and you'll have the opportunity to go through some exercises to create automations.
Why automate?
Automations are a key feature of Sumo Logic's log analytics and security products that can help manage insights and alerts without a lot of manual effort. Automations are composed of "smart actions" such as enrichments and notifications that can be automatically triggered under a set of circumstances, such as an alert firing, or when a Cloud SIEM insight is created or closed. Sumo Logic automations are powered by playbooks, a pre-defined set of actions in a linear or branching workflow to execute when the proper circumstances arise.
There are several reasons you might want to automate some security tasks:
- Faster responses. Automating parts of your SOC can mean faster response times.
- Consolidate tools. Orchestrate all your security tools in one location with integrations and custom APIs.
- Close the skills gap. Analysts of all skill levels can deploy playbooks. Veteran analysts can spend more time on threat hunting.
Automation with alerts
Automations and playbooks can also be used within Sumo Logic's Log Analytics Platform as a response to alerts. For instance, a monitor that detects suspicious behavior can generate an alert, and also automatically run a playbook to respond to the event. See Automated Playbooks in Monitors.
Automation with Cloud SIEM
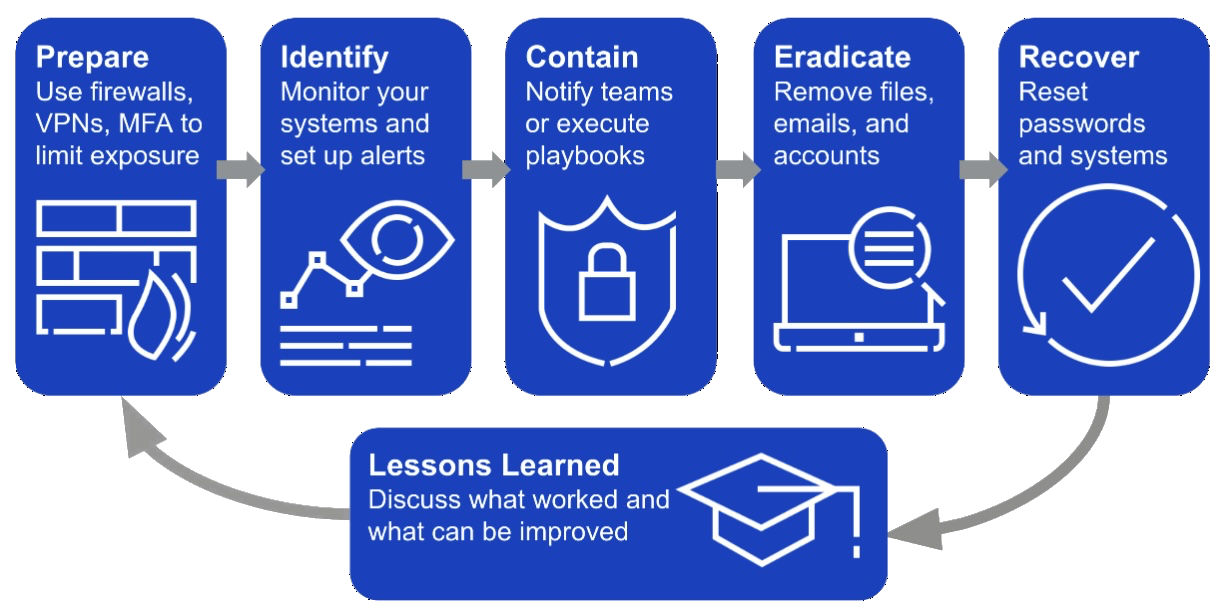
Typically, playbooks can be used in Cloud SIEM to help partially or fully automate one or more steps of the incident response cycle:
Automation with Cloud SOAR
Strictly speaking, the Automation Service is a subset of functionality provided by Cloud SOAR that is available to use in other parts of Sumo Logic, like alerting and Cloud SIEM. However, the same functionality is natively built into Cloud SOAR for incident management. See Cloud SOAR Automation.
App Central integrations and playbooks
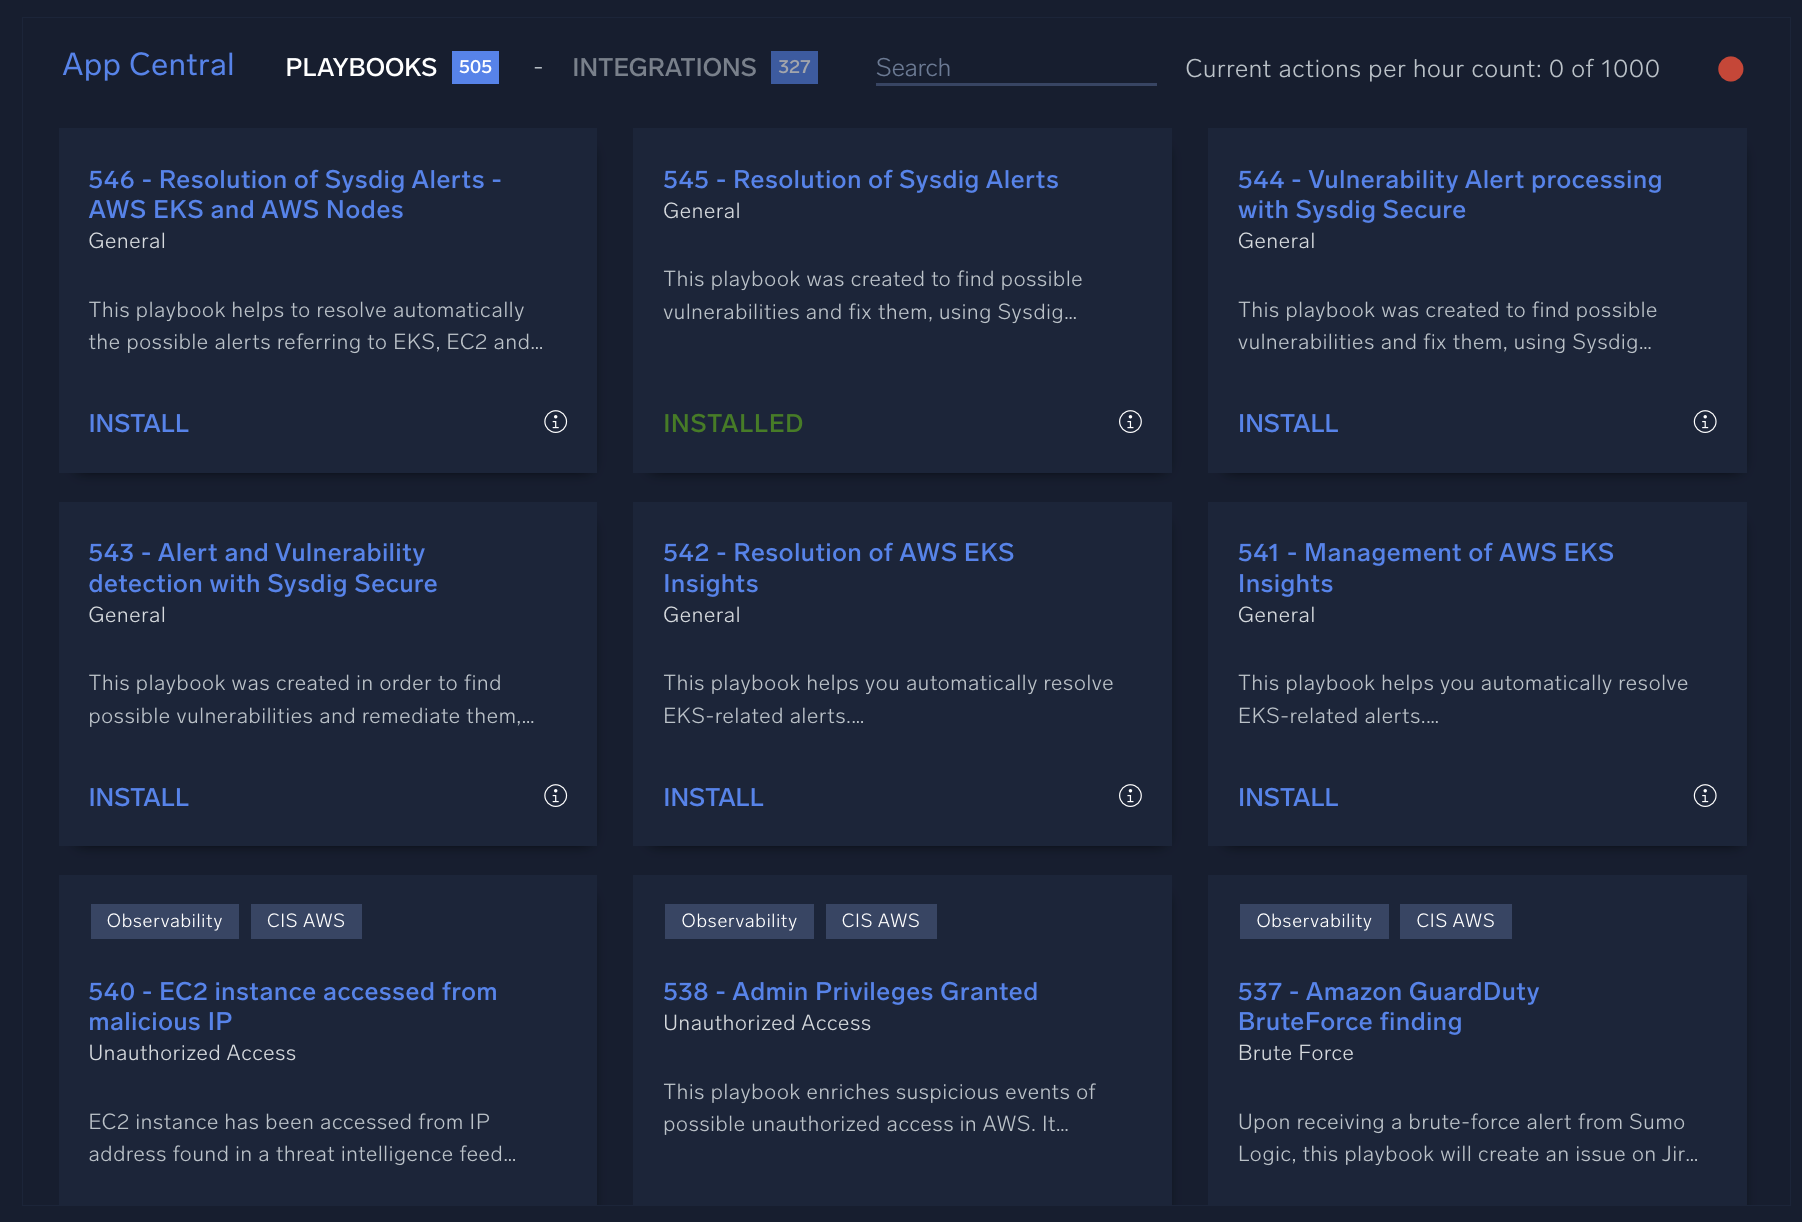
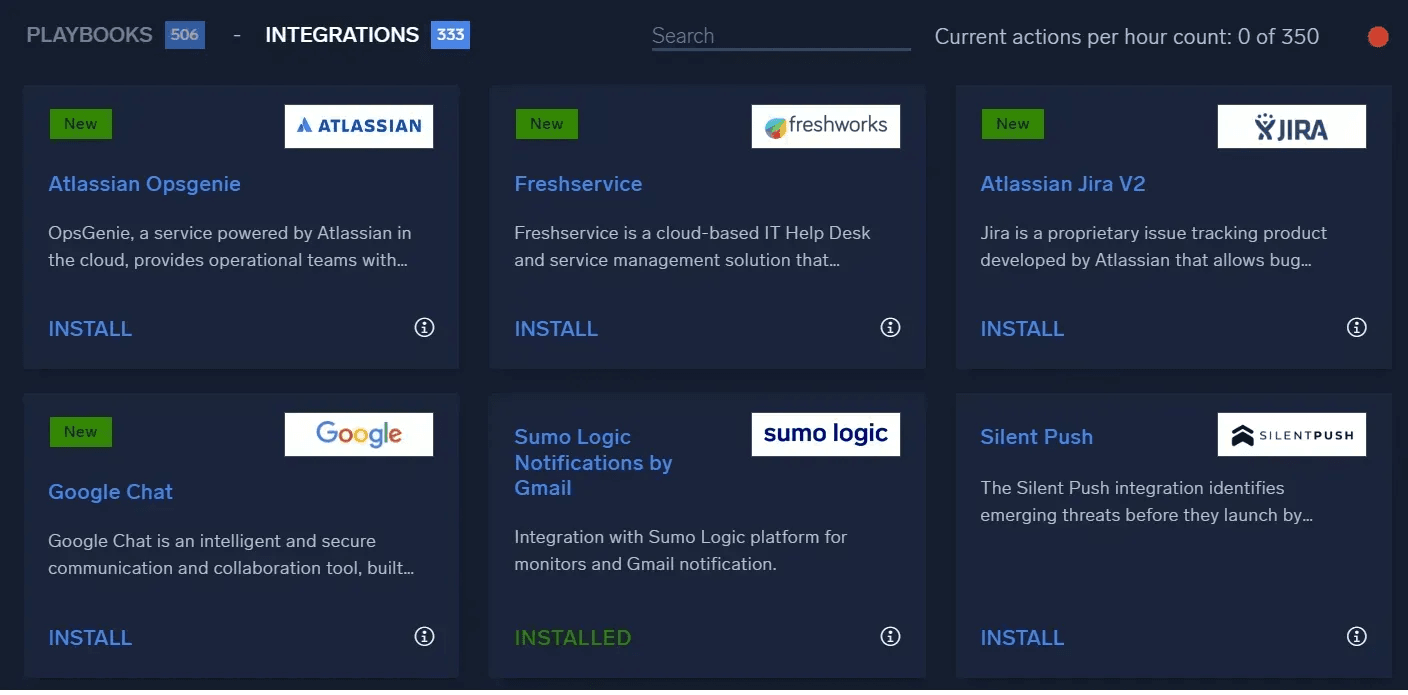
App Central is a central repository of out-of-the-box solutions that can help any organization get going with automations quickly without needing customization or development. The Automation Service comes with hundreds of pre-built playbooks and integrations as part of App Central.
As a Sumo Logic administrator, you can explore App Central and install any integrations your team requests. You can also create custom integrations using APIs from the Integrations page. These integrations will connect Automation Service features to other tools like CrowdStrike, ServiceNow, or Jira. Once all your tools are integrated, App Central can be a single, central location for orchestrating your security response.
Explore the Automation Service UI
Let's check out the Automation Service UI and learn about installing and configuring integrations.
- Navigate to the App Central page.
New UI. To access App Central, in the main Sumo Logic menu select Automation > App Central. You can also click the Go To... menu at the top of the screen and select App Central.
Classic UI. In the main Sumo Logic menu select Automation and then and click App Central in the left navigation bar. - The App Central Integrations page shows a long list of installed and available integrations to augment Automation Service functionality with both Sumo Logic and third-party vendor functionality.
- Choose a sample integration from the list and click on it. A popup window will appear showing the details of the integration, including version, description, and a list of "actions" that are supported in automations.
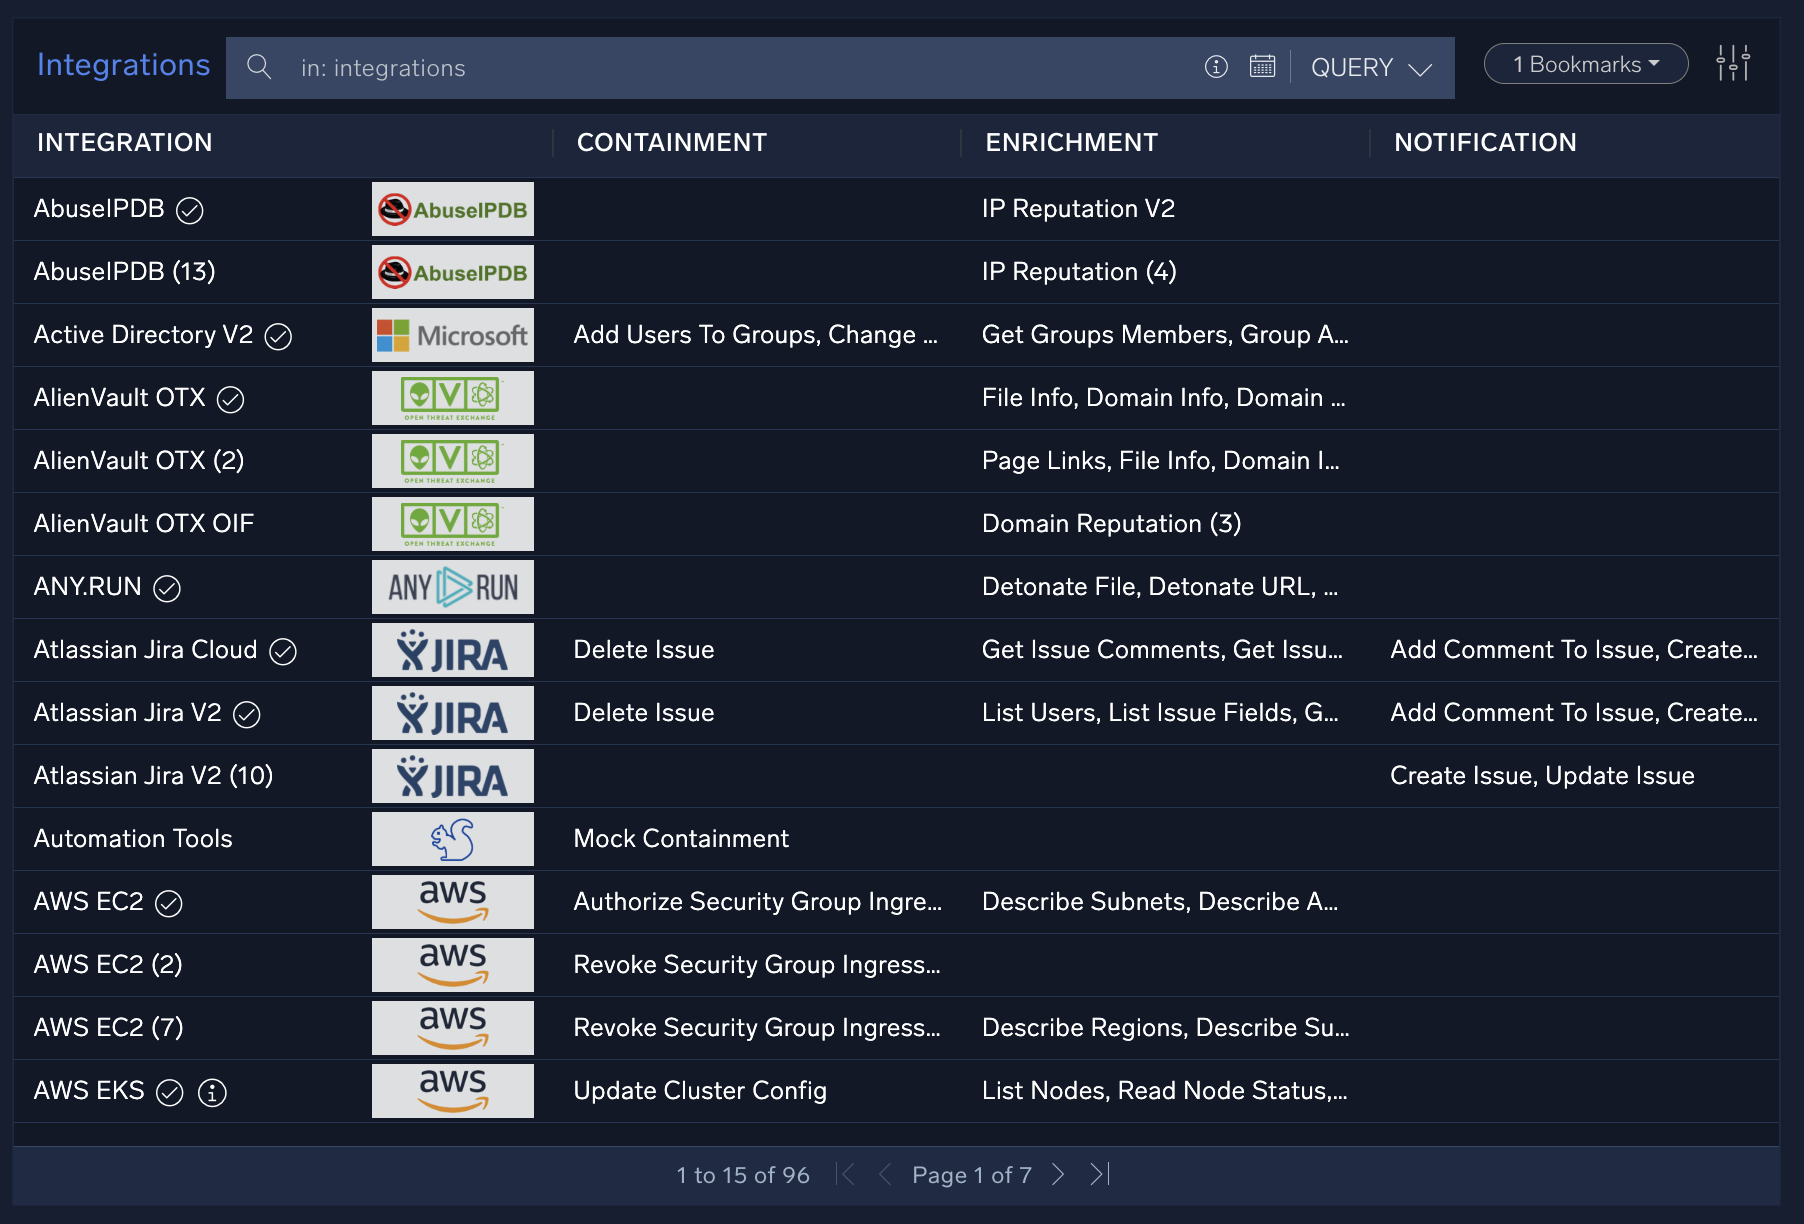
- Navigate to the Integrations page to show installed integrations.
Classic UI. In the main Sumo Logic menu, select Automation and then select Integrations in the left nav bar.
New UI. In the main Sumo Logic menu, select Automation > Integrations. You can also click the Go To... menu at the top of the screen and select Integrations. - In this view, you can see the integrations that have already been installed and configured in the system. Locate an integration called Sumo Logic Log Analytics in the list and click on it. The panel on the right will show the integration details, including available actions. Many integrations after install will require appropriate configuration using "resources".
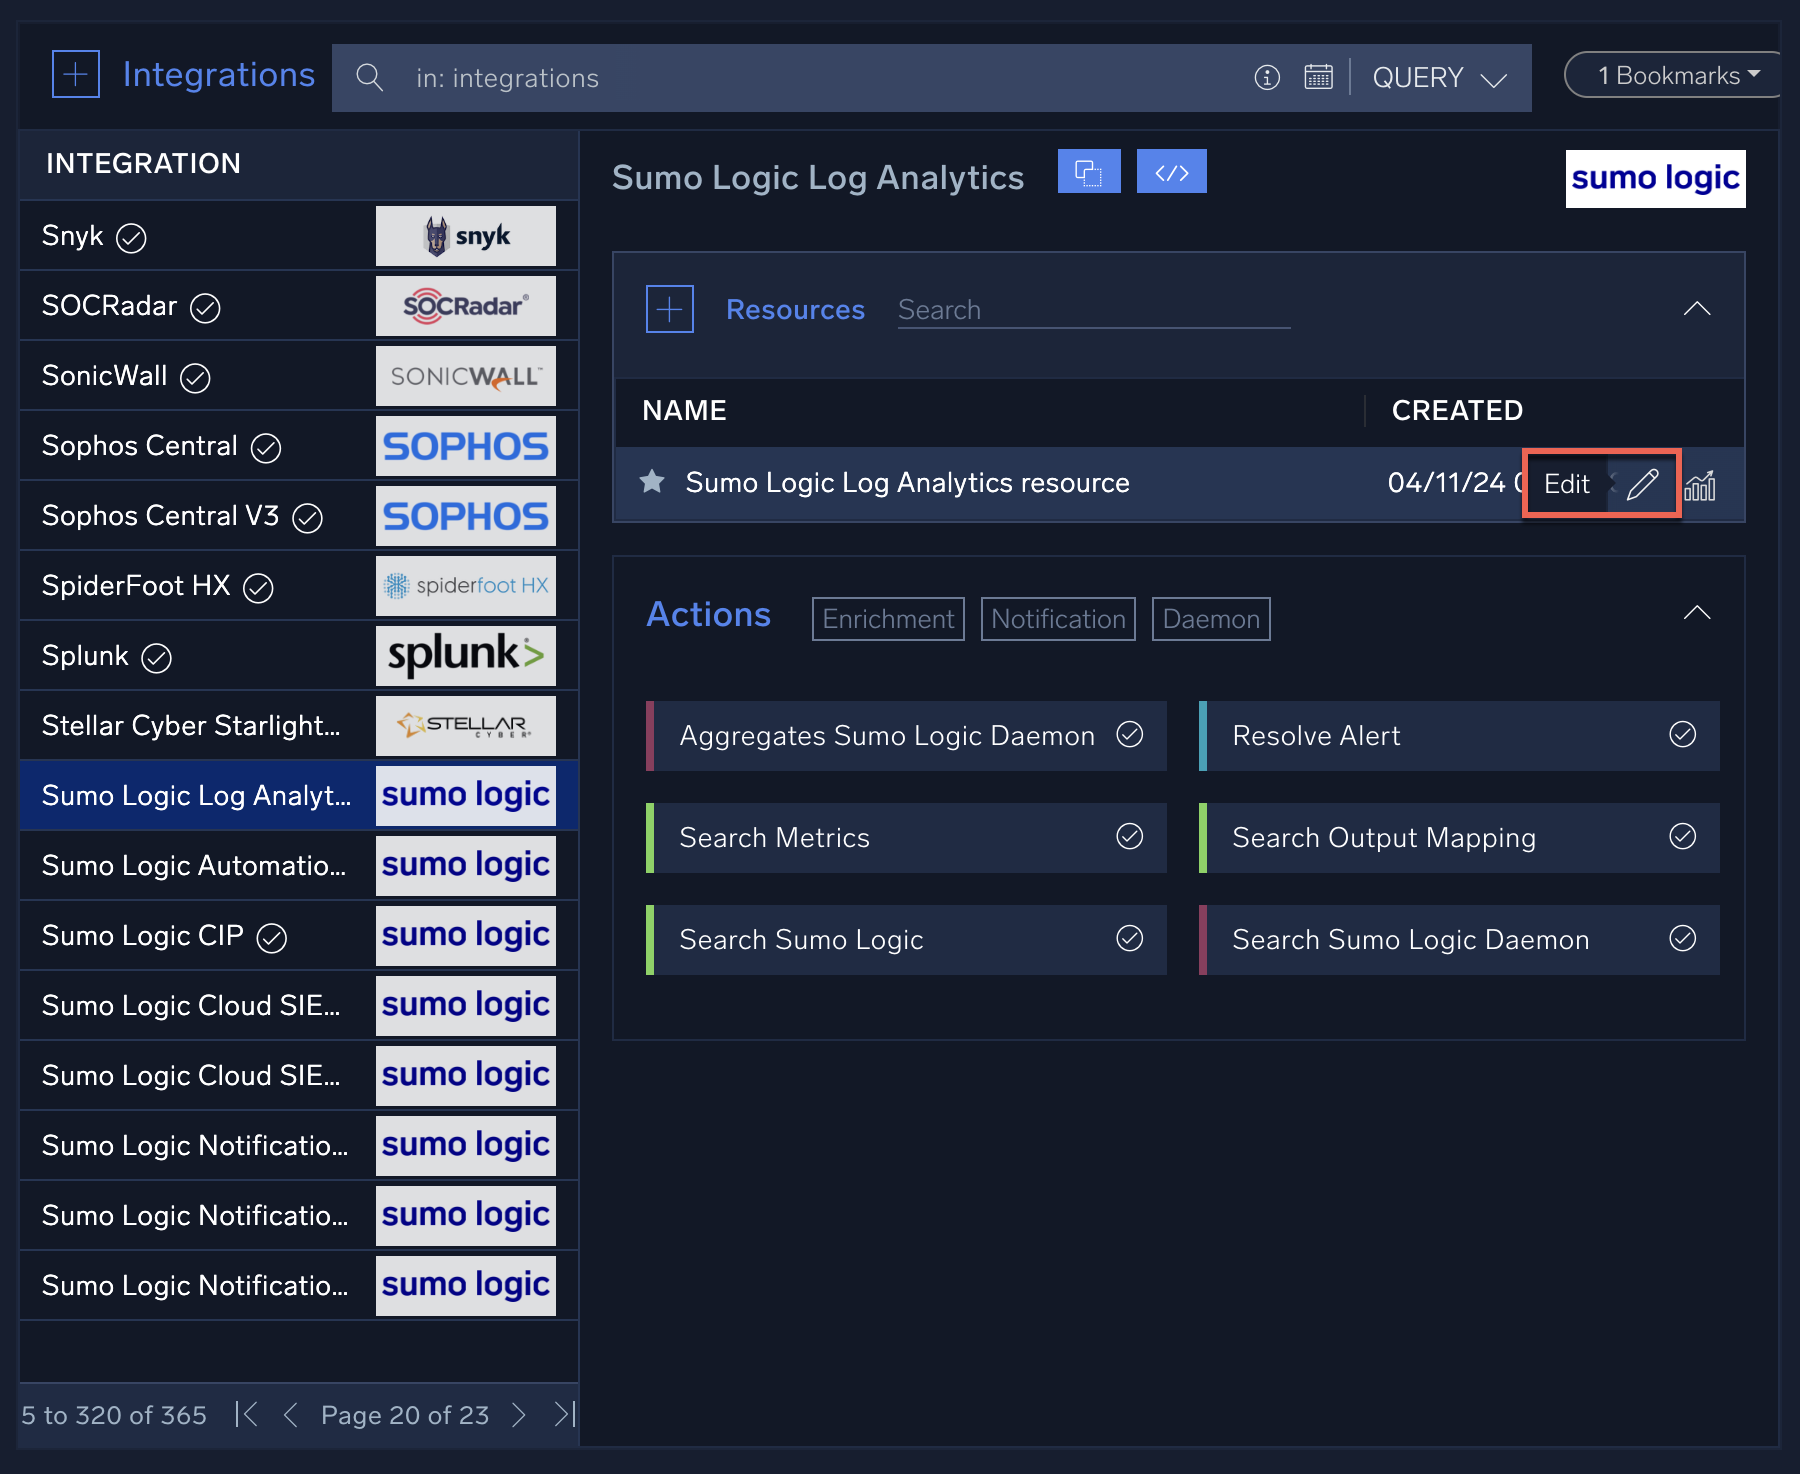
- Move the mouse cursor over the existing resource called Sumo Logic Log Analytics resource, then click the Edit (pencil) icon. You will see a dialog showing the configuration fields for this resource.
note
When you create a resource or configure an existing one, you need to enter the appropriate connection information such as the API web URL (for either Sumo Logic or a third-party service) and associated API keys (see Configure Authentication for Automation Integrations). Many Sumo Logic integrations require you to create an access ID and access key through the Sumo Logic UI to use in configuring integrations. Some third-party integrations may require you to visit their website and sign up for an account in order to obtain the appropriate URL and/or credentials for their API.
- Click the Test button after you have configured the resource to test the connection info. You will see a small popup that indicates whether the test was successful. It may take a few seconds to execute depending on the integration.
Playbooks
Once you’ve identified a potential security incident, you can respond to it by executing a playbook. Playbooks are automated, or partially automated, workflows that act based on information from an incident or alert. A playbook can enrich data, contain threats, notify teams, and other actions with custom APIs. These actions help automatically orchestrate many parts of the investigation, containment, eradication, and recovery processes.
Custom playbooks allow you to automate any task that uses a custom API. You can also use them to automate tasks that aren’t part of the hundreds of default playbooks included in the Automation Service.
Playbooks are built from nodes connected together in a flowchart. Whether you’re customizing a playbook or creating one from scratch, you can choose from several node types:
- Actions. Enrich data, execute APIs, send notifications, or use other integrations.
- Conditions. If-then statements that allow playbooks to branch in different directions.
- Tasks. Assign a manual task to another user.
- Filter. Use designated criteria to filter data outputs from previous nodes.
- Embedded playbooks. Run another playbook.
Each of these node types are color-coded in a playbook. The following image shows a sample playbook. Note the different actions and enrichments, along with the branches that execute different sequences of actions based on conditions.
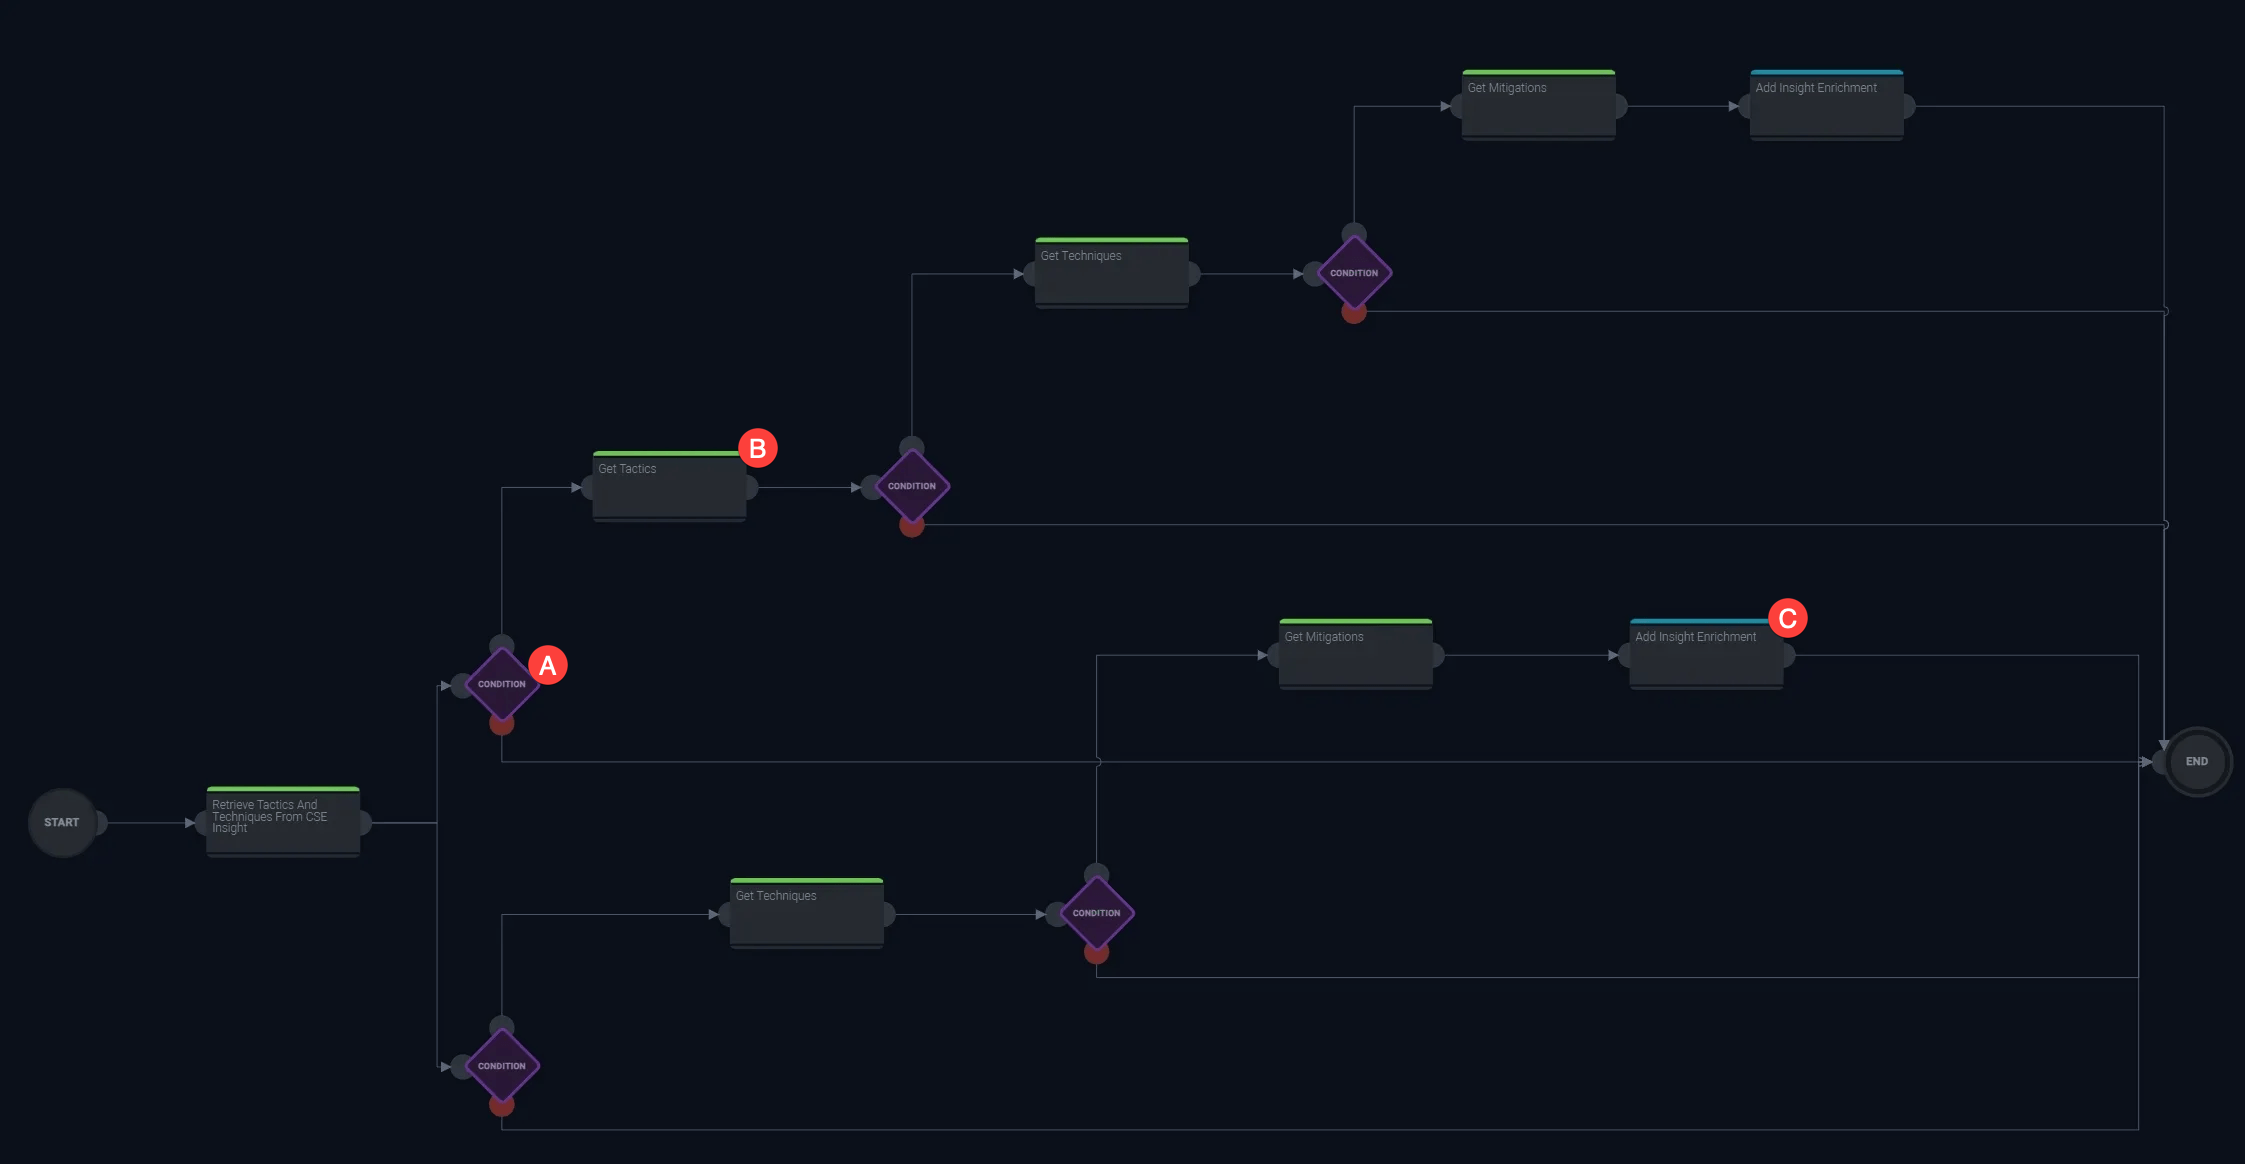
- A. Condition. Conditions, represented by a purple diamond, allow your playbook to branch in different directions based on an if-then statement.
- B. Enrichment. Green nodes are enrichments. These might add additional information from a threat intel database or convert data from one type to another.
- C. Notification. Blue nodes are notification actions, such as a Slack or email alert.
Action nodes use integrations. These integrations broadly fall into several types:
- Enrichments. Add information, metadata, or context, such as from a threat intelligence database.
- Containment. Reduces further damage by isolating files or machines related to a threat.
- Notifications. Alerts sent via email, Slack, PagerDuty, or most other services you can connect with an API.
- Custom. Scripts and any other automations you can create using YAML, Perl, Python, PowerShell, or Bash.
Custom actions can also include trigger actions, which run based on an event type until certain criteria are met. For example, if malware is detected, a trigger action could run an anti-malware cleanup software until no malware is detected. Similarly, you can create scheduled actions that run at certain intervals. For example, you could create a scheduled action that checks for malicious IP addresses every 5 minutes until no more malicious IP addresses are found.
Best practices
Before you begin creating or customizing a playbook, decide what you’d like to automate. Think about what conditions you want met, and what actions or integrations you want to accomplish based on different flows. Once you have a design in mind for the flow of your playbook, you can create or customize a new one.
The Sumo Logic Automation Service includes hundreds of prebuilt playbooks. Start by searching the catalog to see if an out-of-the-box solution meets your needs. You can also use these playbooks as templates, saving time by modifying an existing playbook instead of building one from scratch.
Create a playbook for Cloud SIEM insights
The Automation Service allows us to create automations that will run whenever Cloud SIEM insights are created or closed. These automations are powered through "playbooks" as discussed in the previous section, predefined actions run in an automated workflow to respond to an incident.
To create the playbook as described below, you must first configure the following integrations that the playbook will use:
Now that those integrations are configured, let’s use the Automation Service to create a playbook for use in Cloud SIEM:
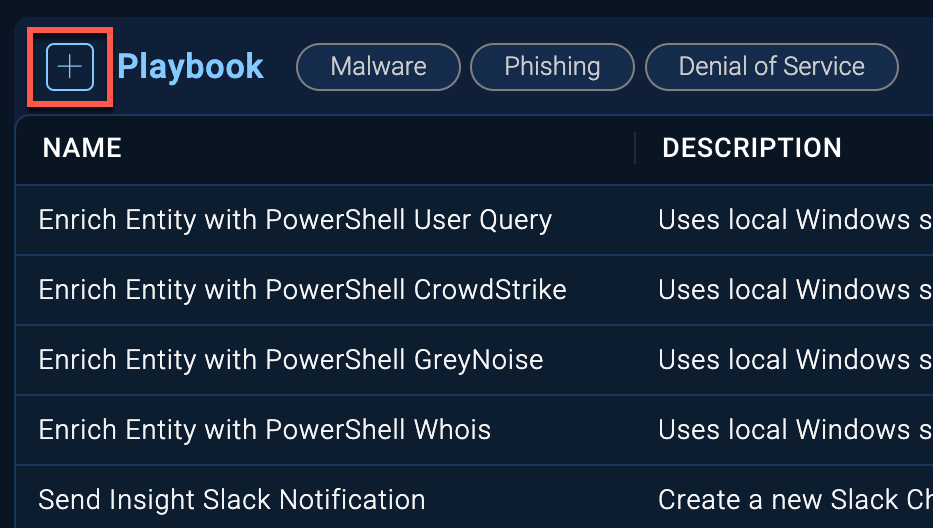
- Go to the Playbooks page.
New UI. In the main Sumo Logic menu, select Automation > Playbooks. You can also click the Go To... menu at the top of the screen and select Playbooks.
Classic UI. In the main Sumo Logic menu, select Automation > Playbooks.
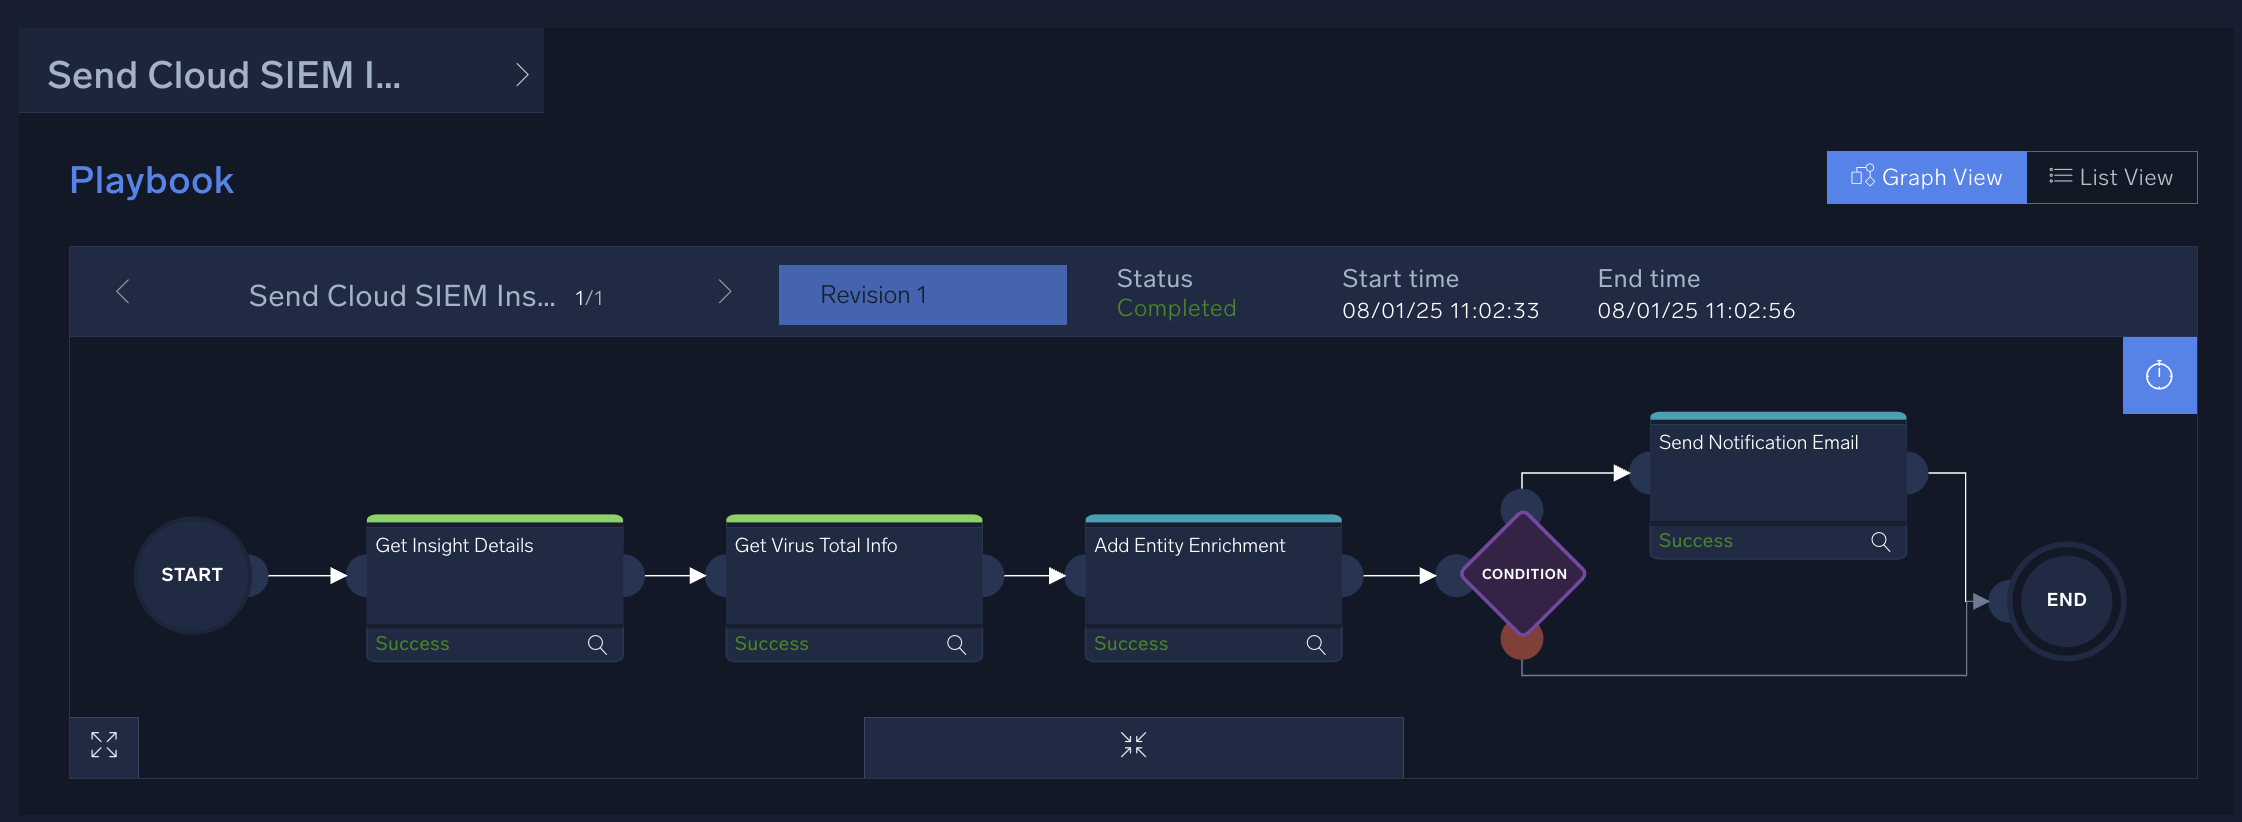
The list of playbooks displays. You can click on any of the existing playbooks which will open the playbook diagram in the sidebar on the right. You can view here the individual nodes and sequences in the selected playbook, to give you an idea of the type of actions and structures that you can create. Playbooks can have any number of actions, as well as branching conditions to manage different sequences of actions, depending on selected criteria. You can click on any component of a playbook to see more detailed information about each node. - Let's create a playbook of our own that will send an email notification when a Cloud SIEM insight is created with a high severity.
- Click the plus icon near the top to create a new playbook.
- Enter a name for the playbook, such as "Send Cloud SIEM Insight Email Notification". You can optionally enter a description. Select Cloud SIEM as the Type for the playbook.
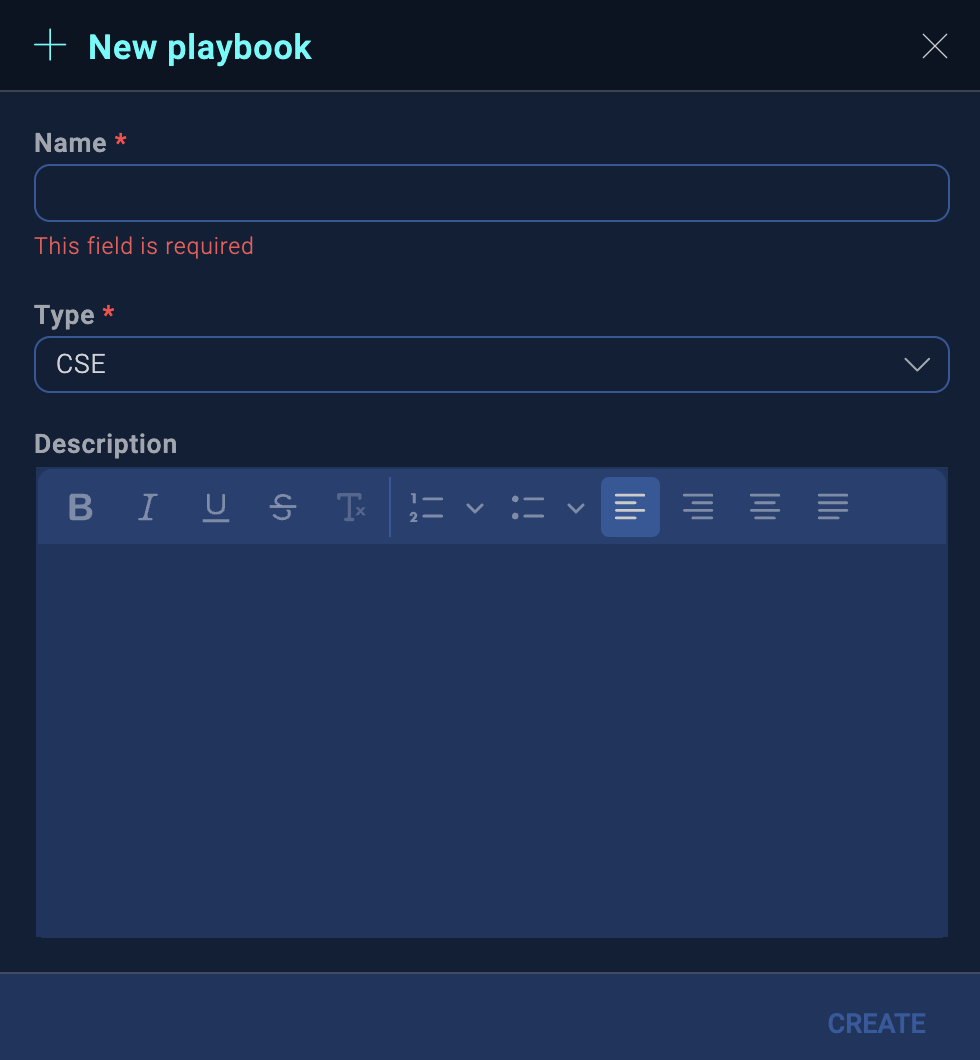
- Click Create when finished.
- On the following screen you will see the starting template for your new empty playbook, with Start and End nodes. Switch to edit mode by clicking on the Edit (pencil) icon in the bottom toolbar.

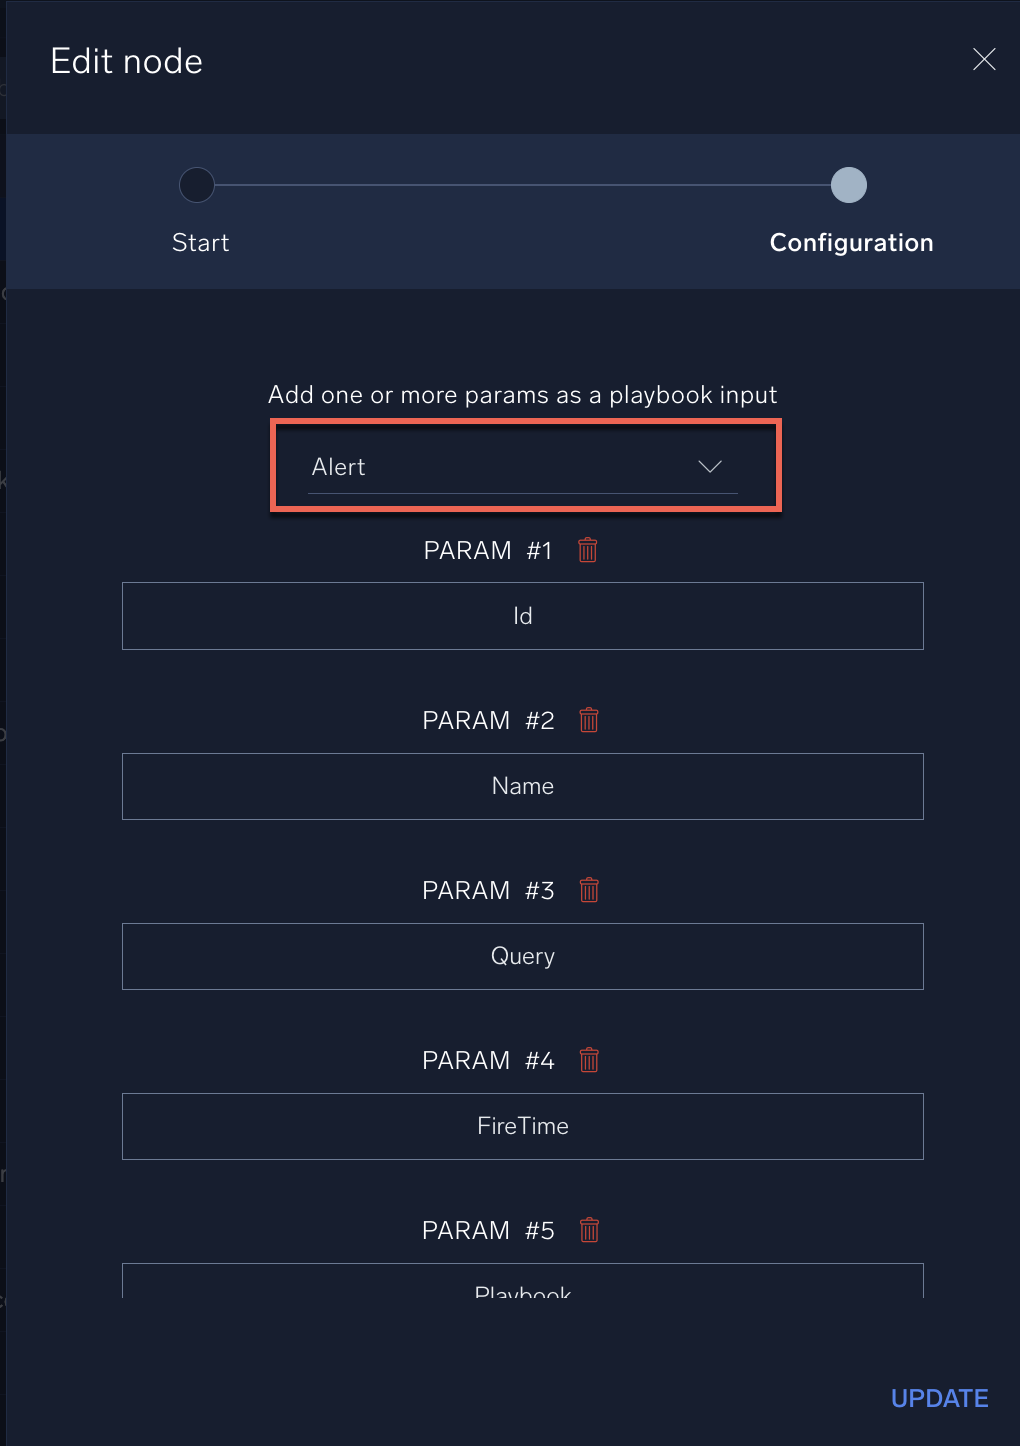
- Before we start adding actions to our playbook, we’ll want to set up the initial configuration of the playbook so we get the proper inputs from the Cloud SIEM insight. Mouse over the Start node, and click the Edit (pencil) icon.

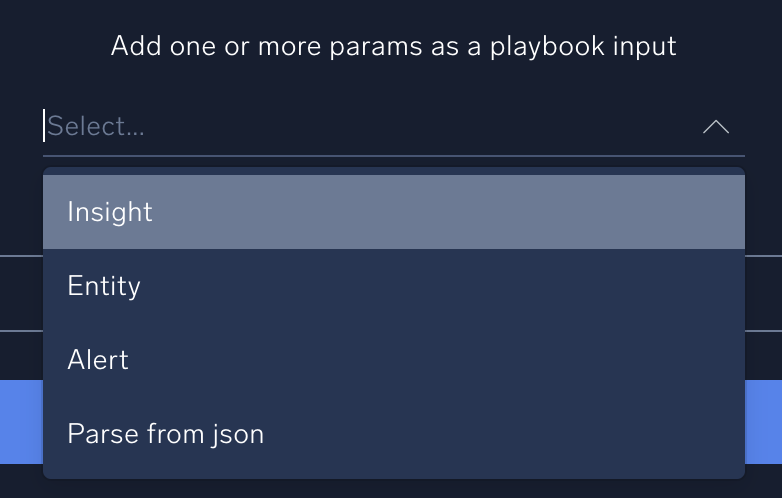
- In the Edit Node popup, go to the Add one or more params as a playbook input field and select Insight. Choosing Insight automatically populates the popup view with a number of input parameters that will be added to the playbook from the corresponding insight. (For more information about these parameters, see Insight payload variables.)
- Click Update to save and close the input parameters.
- Click the plus icon near the top to create a new playbook.
- Now let's add an action node to the playbook.
- Click the + symbol on the Start node.
- Choose the Action node tpe.
- Use the following parameters to configure the node. If a field is not listed, keep the default value. Make sure you fill out the listed configuration fields in order, as some fields will only appear in the dialog box after you’ve selected fields above it.
- Name. Type "Get Insight Details".
- Integration. Sumo Logic Cloud SIEM.
- Type. Enrichment.
- Action. Get Insight.
- Insight ID. Click the gear icon and select Playbook inputs and then input.readableId.
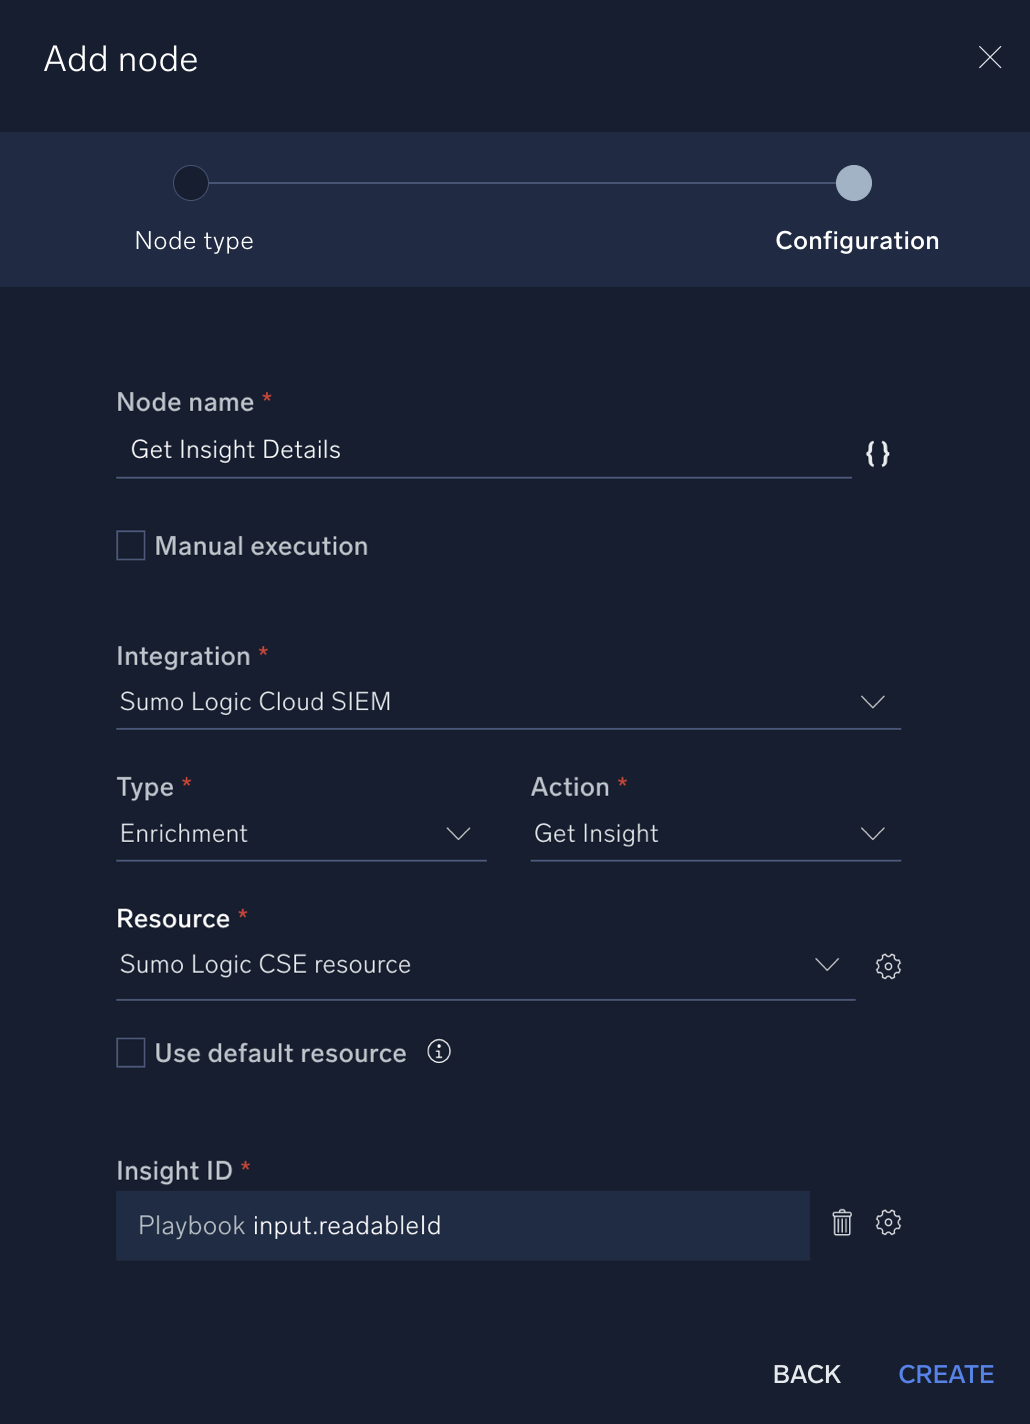
- Click Create when finished.
- Add another action to the playbook by hovering your mouse over the Get Insight Details node you just created and clicking the + icon.
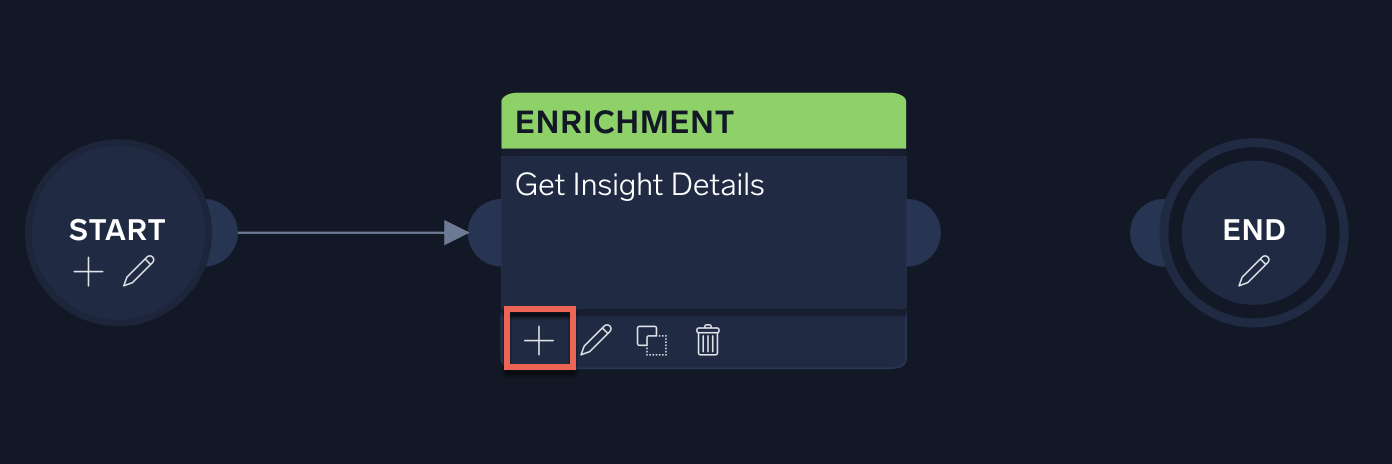
- Choose the Action node tpe.
- In the Add Node dialog box, use the parameters outlined below:
- Name. Type "Get VirusTotal Info".
- Integration. VirusTotal V3.
- Type. Enrichment.
- Action. IP Reputation.
- IPs. Click the gear icon and select Playbook inputs then input.entity.value.
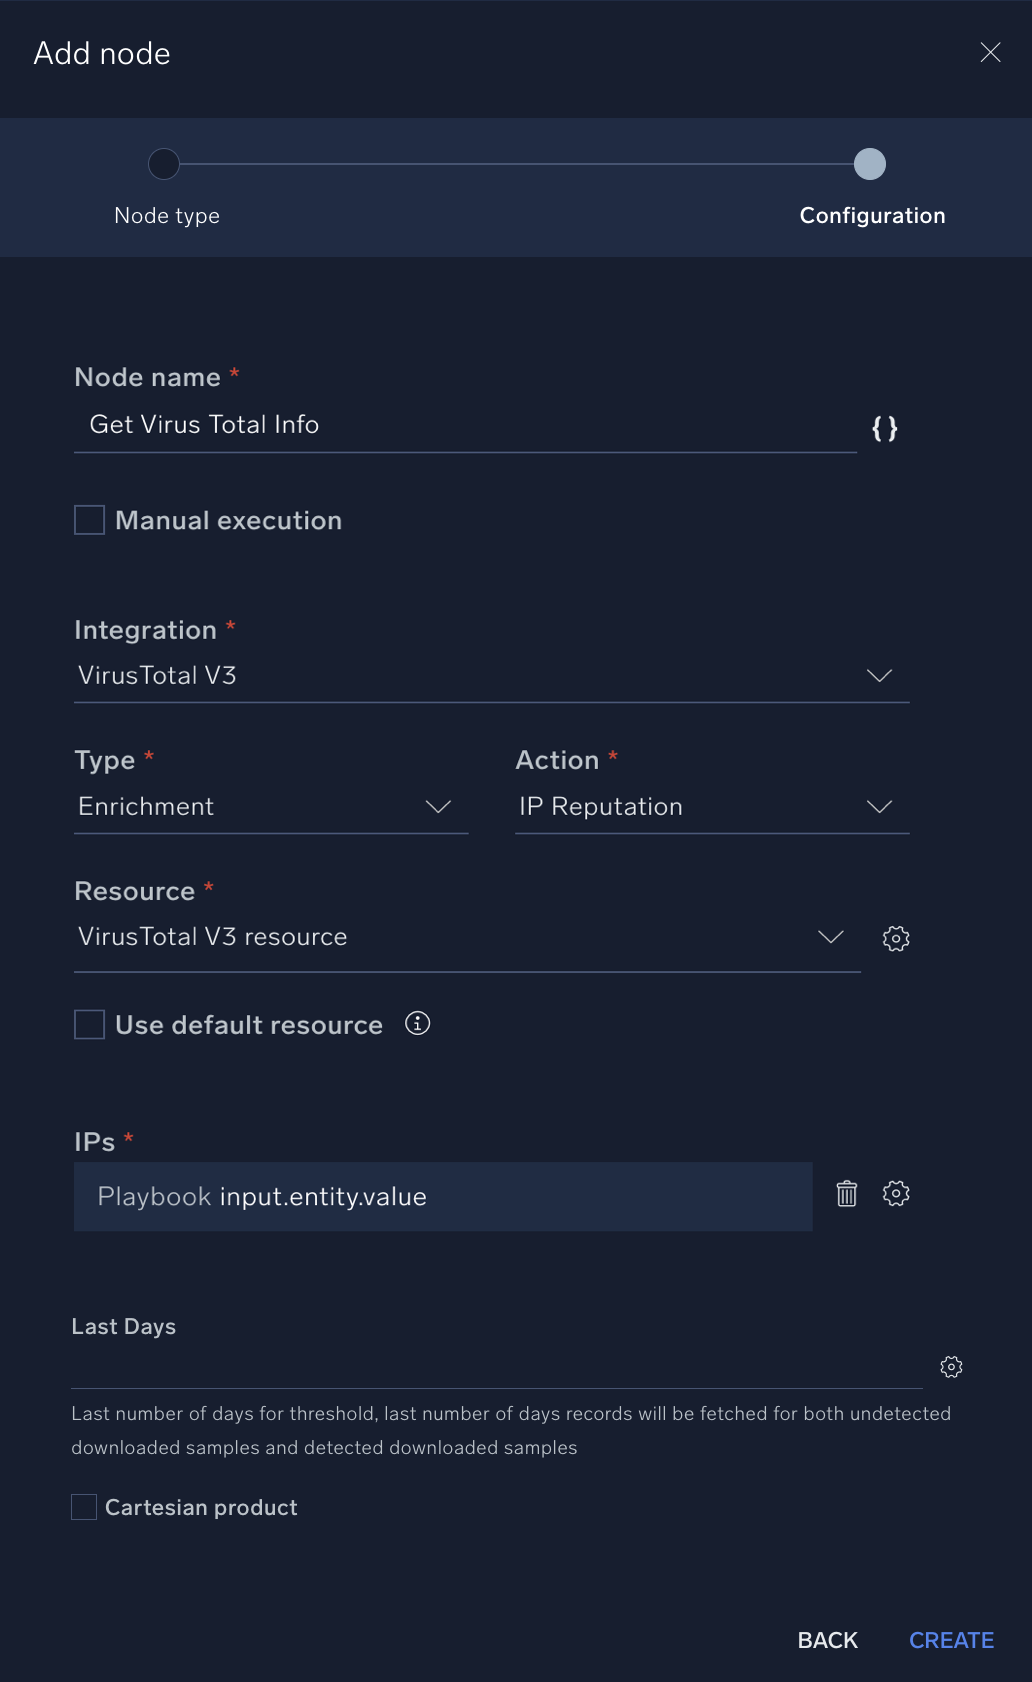
- Click Create to save the new action.
- Add another action to the playbook by clicking the + icon on the Get Virus Total Info node you just created. Use the parameters outlined below:
- Name. Type "Add Entity Enrichment".
- Integration. Sumo Logic Cloud SIEM.
- Type. Notification.
- Action. Add Entity Enrichment.
- Entity ID. Click the gear icon and select Get Insight Details and output.entity.id.
- Enrichment Title. Type "VirusTotal IP Reputation".
- Enrichment. Click the gear icon and select Get VirusTotal Info and output.raw.
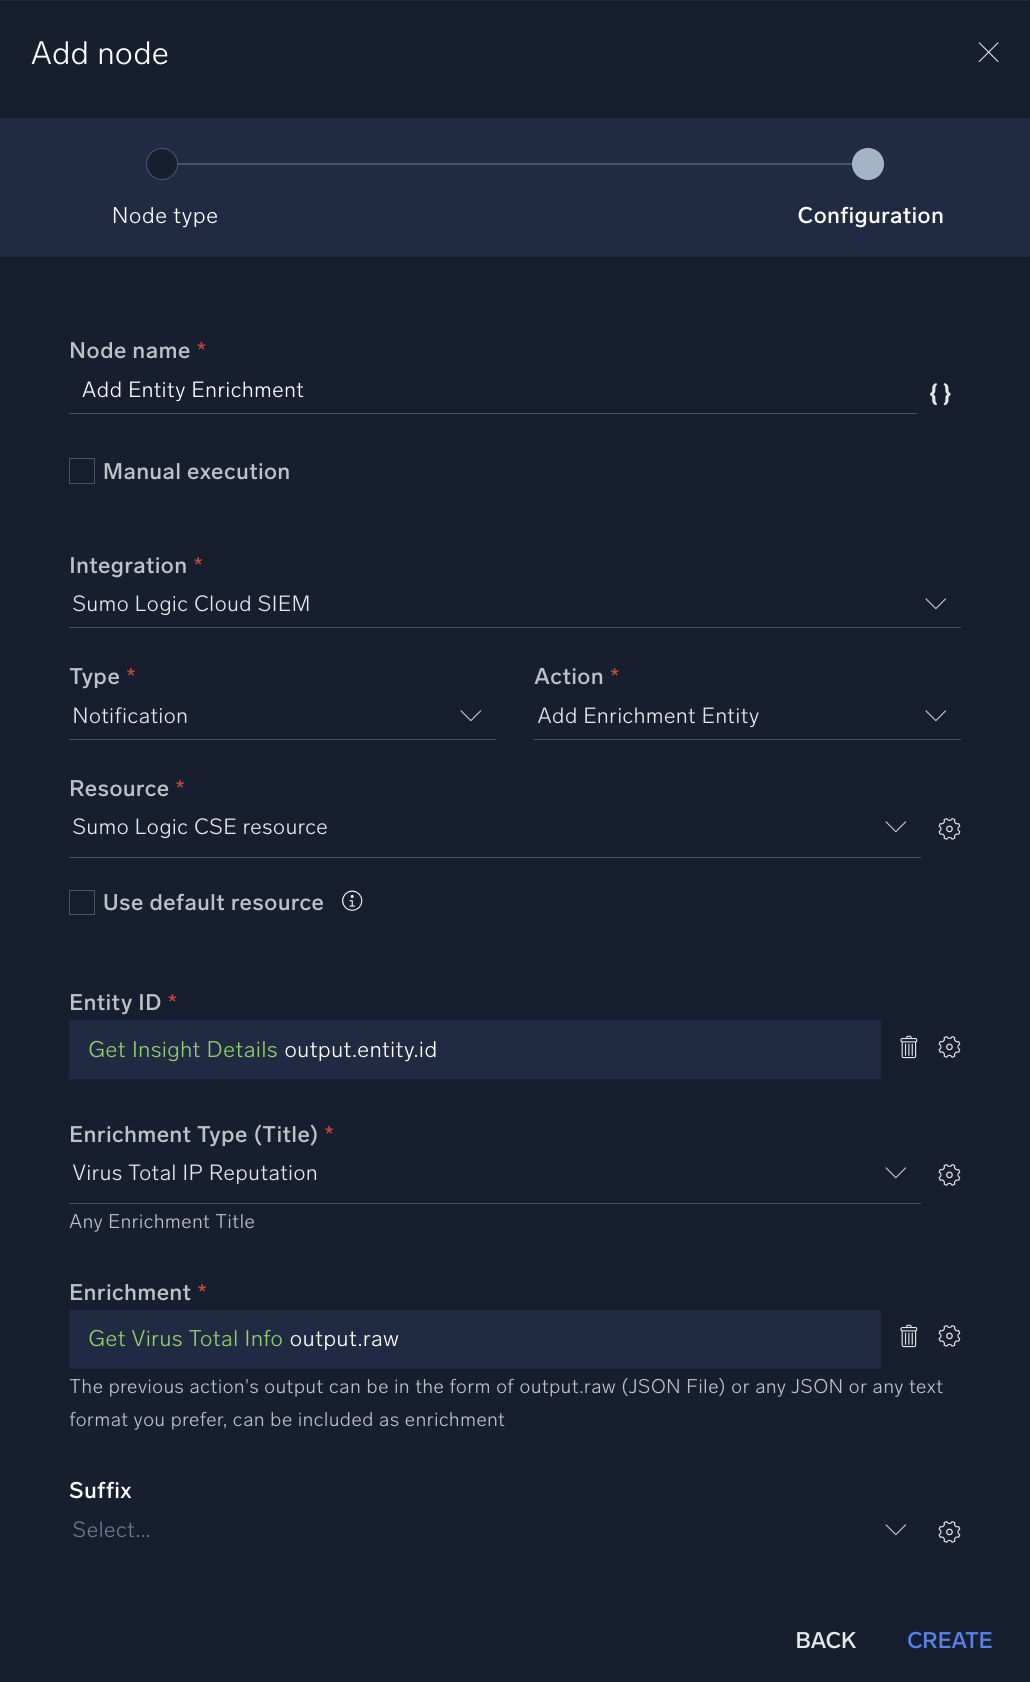
- Click Create to save the action.
- Playbooks also allow "condition" nodes that can switch execution branches depending on the true/false results of a given expression. Let’s add a condition node to our playbook that will differentiate the execution branch depending on the severity of the insight.
- Hover your mouse over your last action (the blue Add Entity Enrichment action) and click the + icon.
- Choose a Condition node.
- Click Create.
- Hover your mouse over the new condition node and click the pencil icon to edit it.
- For the top Select a value, select Get Insight Details and the output.severity option. Make sure == is selected in the middle row.
- For the bottom Select a value field, add a manual value: HIGH.
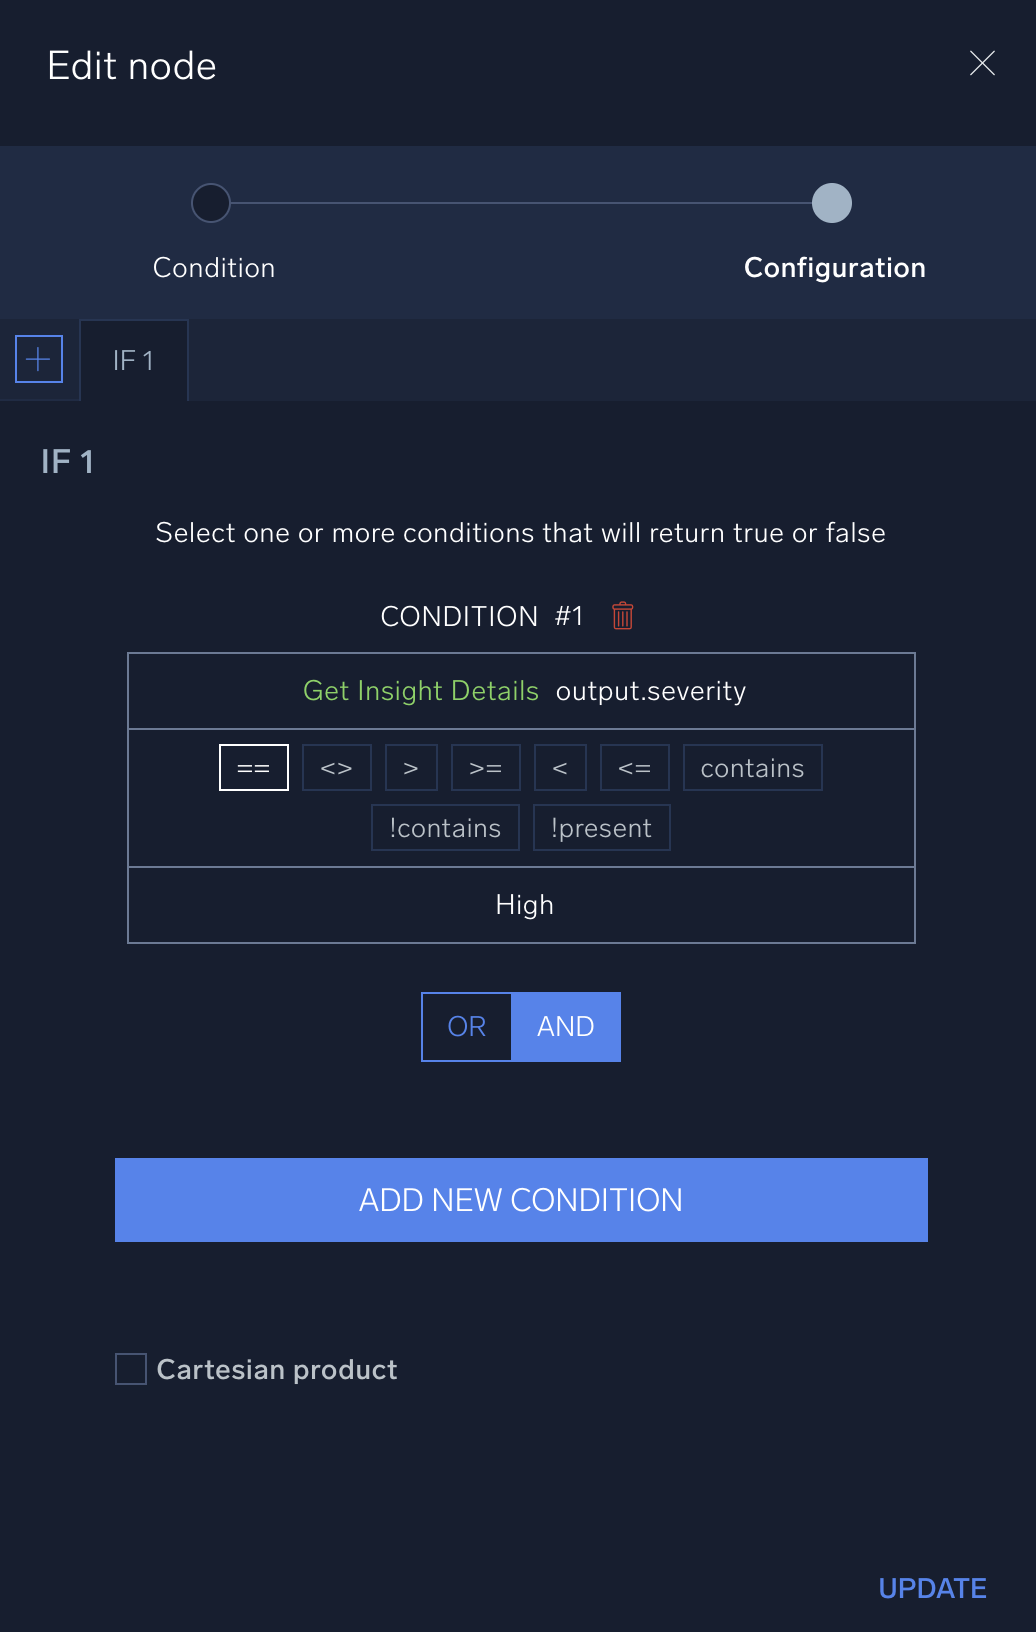
- . Click Update to save the condition node.
- Click the + icon under the condition node to create a new node.
- Select Action for this new node.
- For Node name type "Send Notification Email".
- . For the Integration, select Basic Tools. Set Type to Notification and Action to Send Email.
- For Recipients, enter an email address (real or fake). Make sure you press Enter after typing the email address to signal the Recipients field to parse and accept the email address.
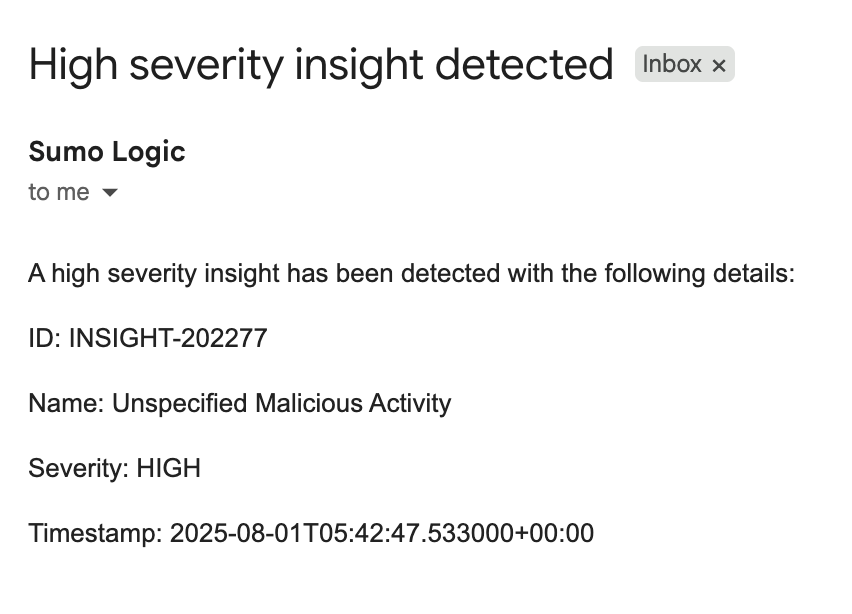
- Type in in the Subject field "High severity insight detected".
- When composing content for an email notification, you have the option of using input parameters from earlier nodes in the playbook in addition to any desired custom text. Click on the icon to add a parameter field to your HTML Content (Body) text.
- Click on the red parameter box that appears and select a source for the desired input parameter (for instance, Get Insight Details.output.name). The parameter box will turn green once you have selected a valid source parameter. You can add custom text before or after the source parameter. Add one or more source parameters and accompanying custom text to outline what you want the email to say. For instance, explain that a high severity insight has been detected with the following details: name, timestamp, etc.
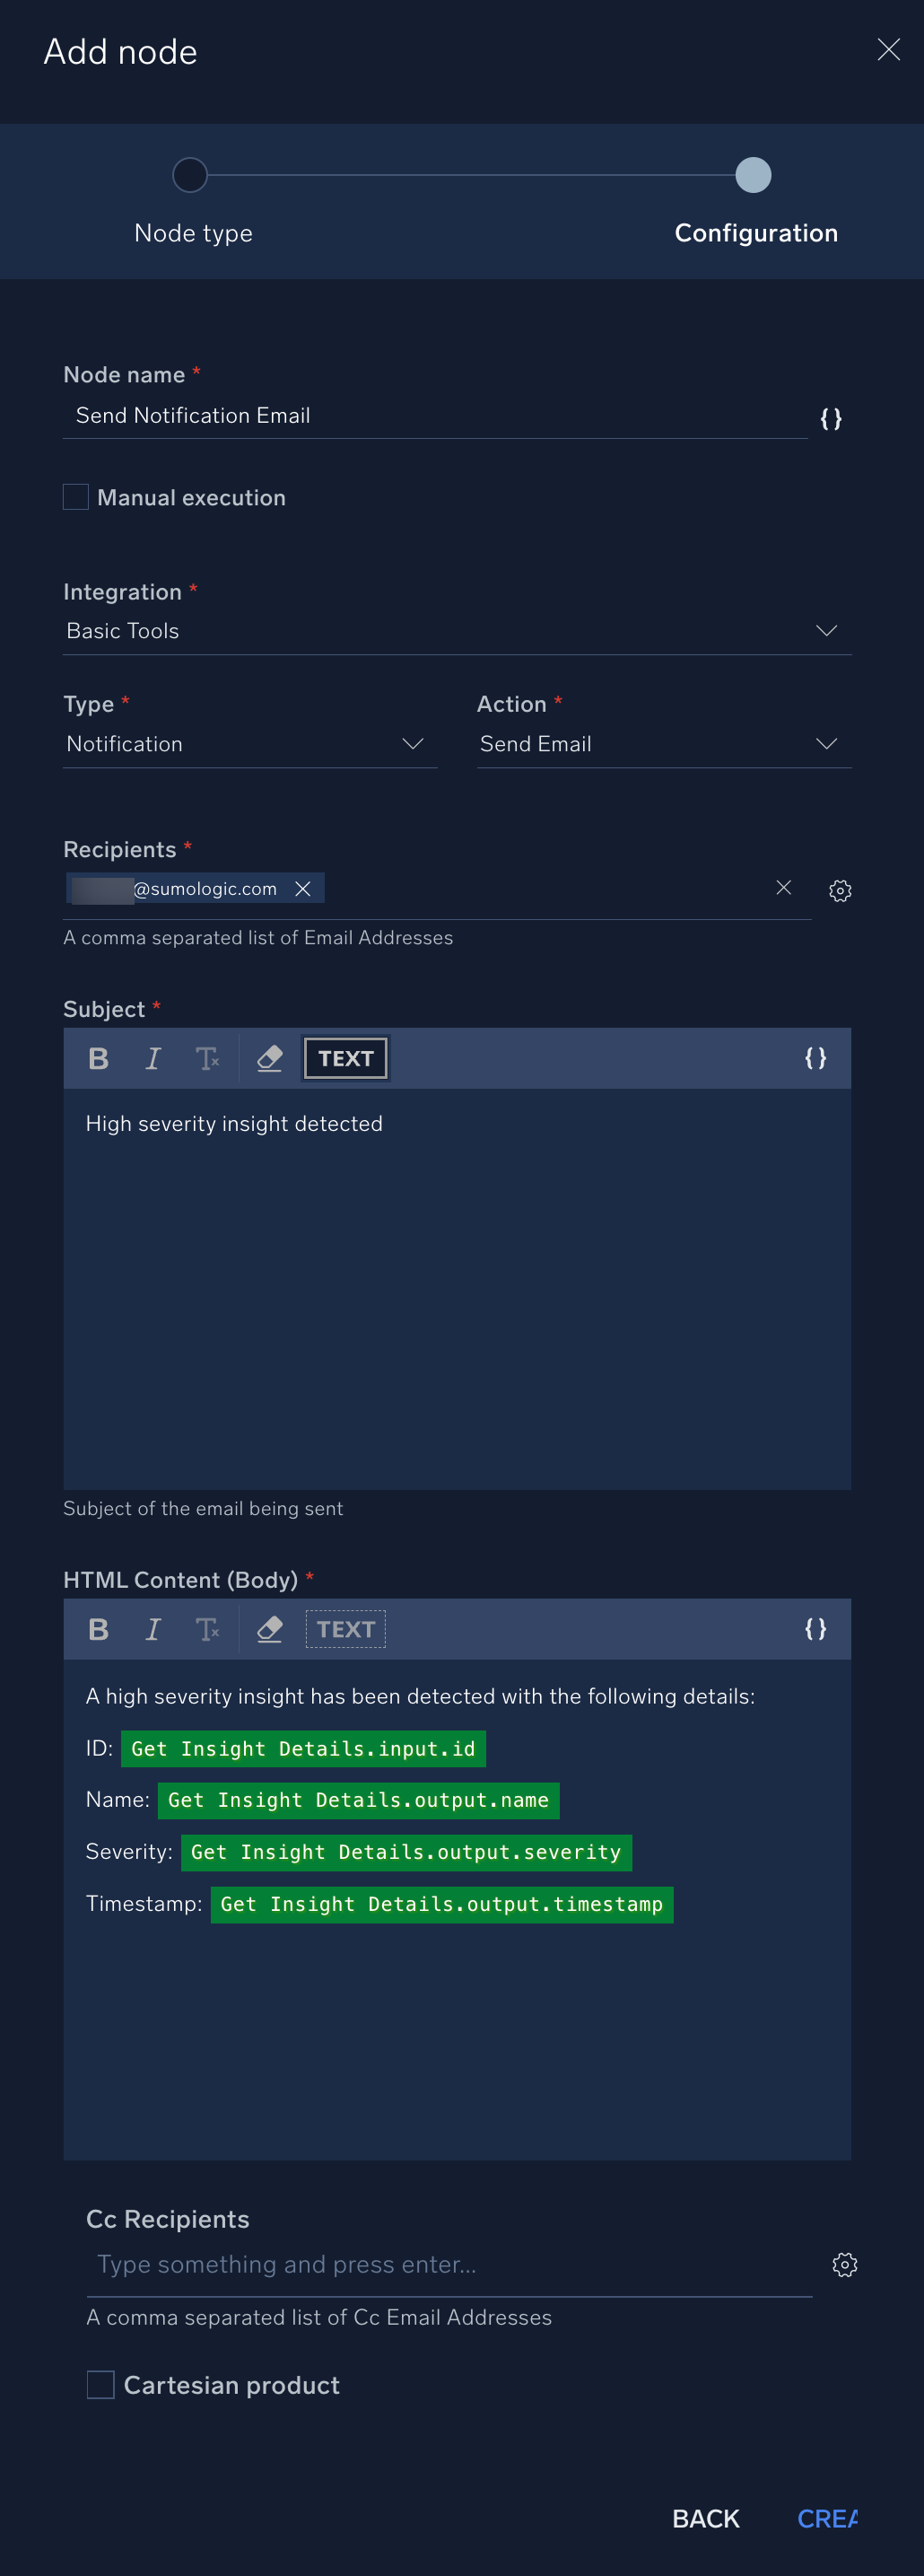
- Click Create when finished with this action.
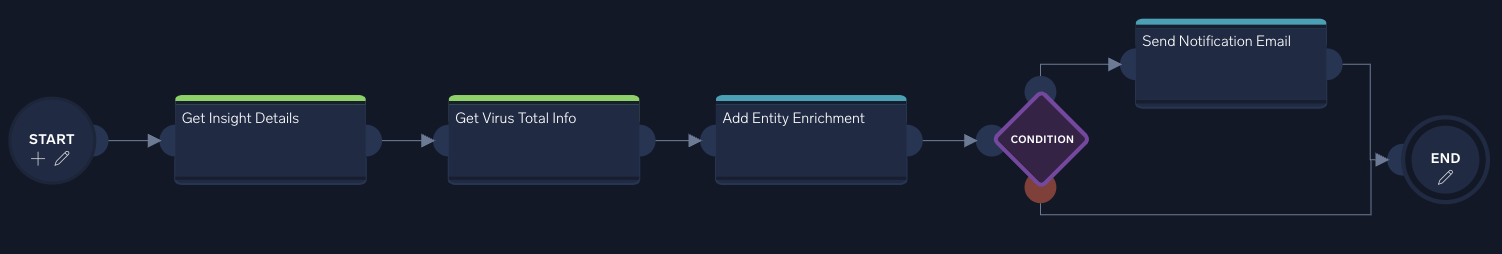
- When you’ve created your final nodes for your playbook, manually drag the mouse cursor from the gray connection circle on the right side of the Send Notification Email node to the left connection area of the End node. Drag and connect the "failure" end of the condition node to the End node as well.
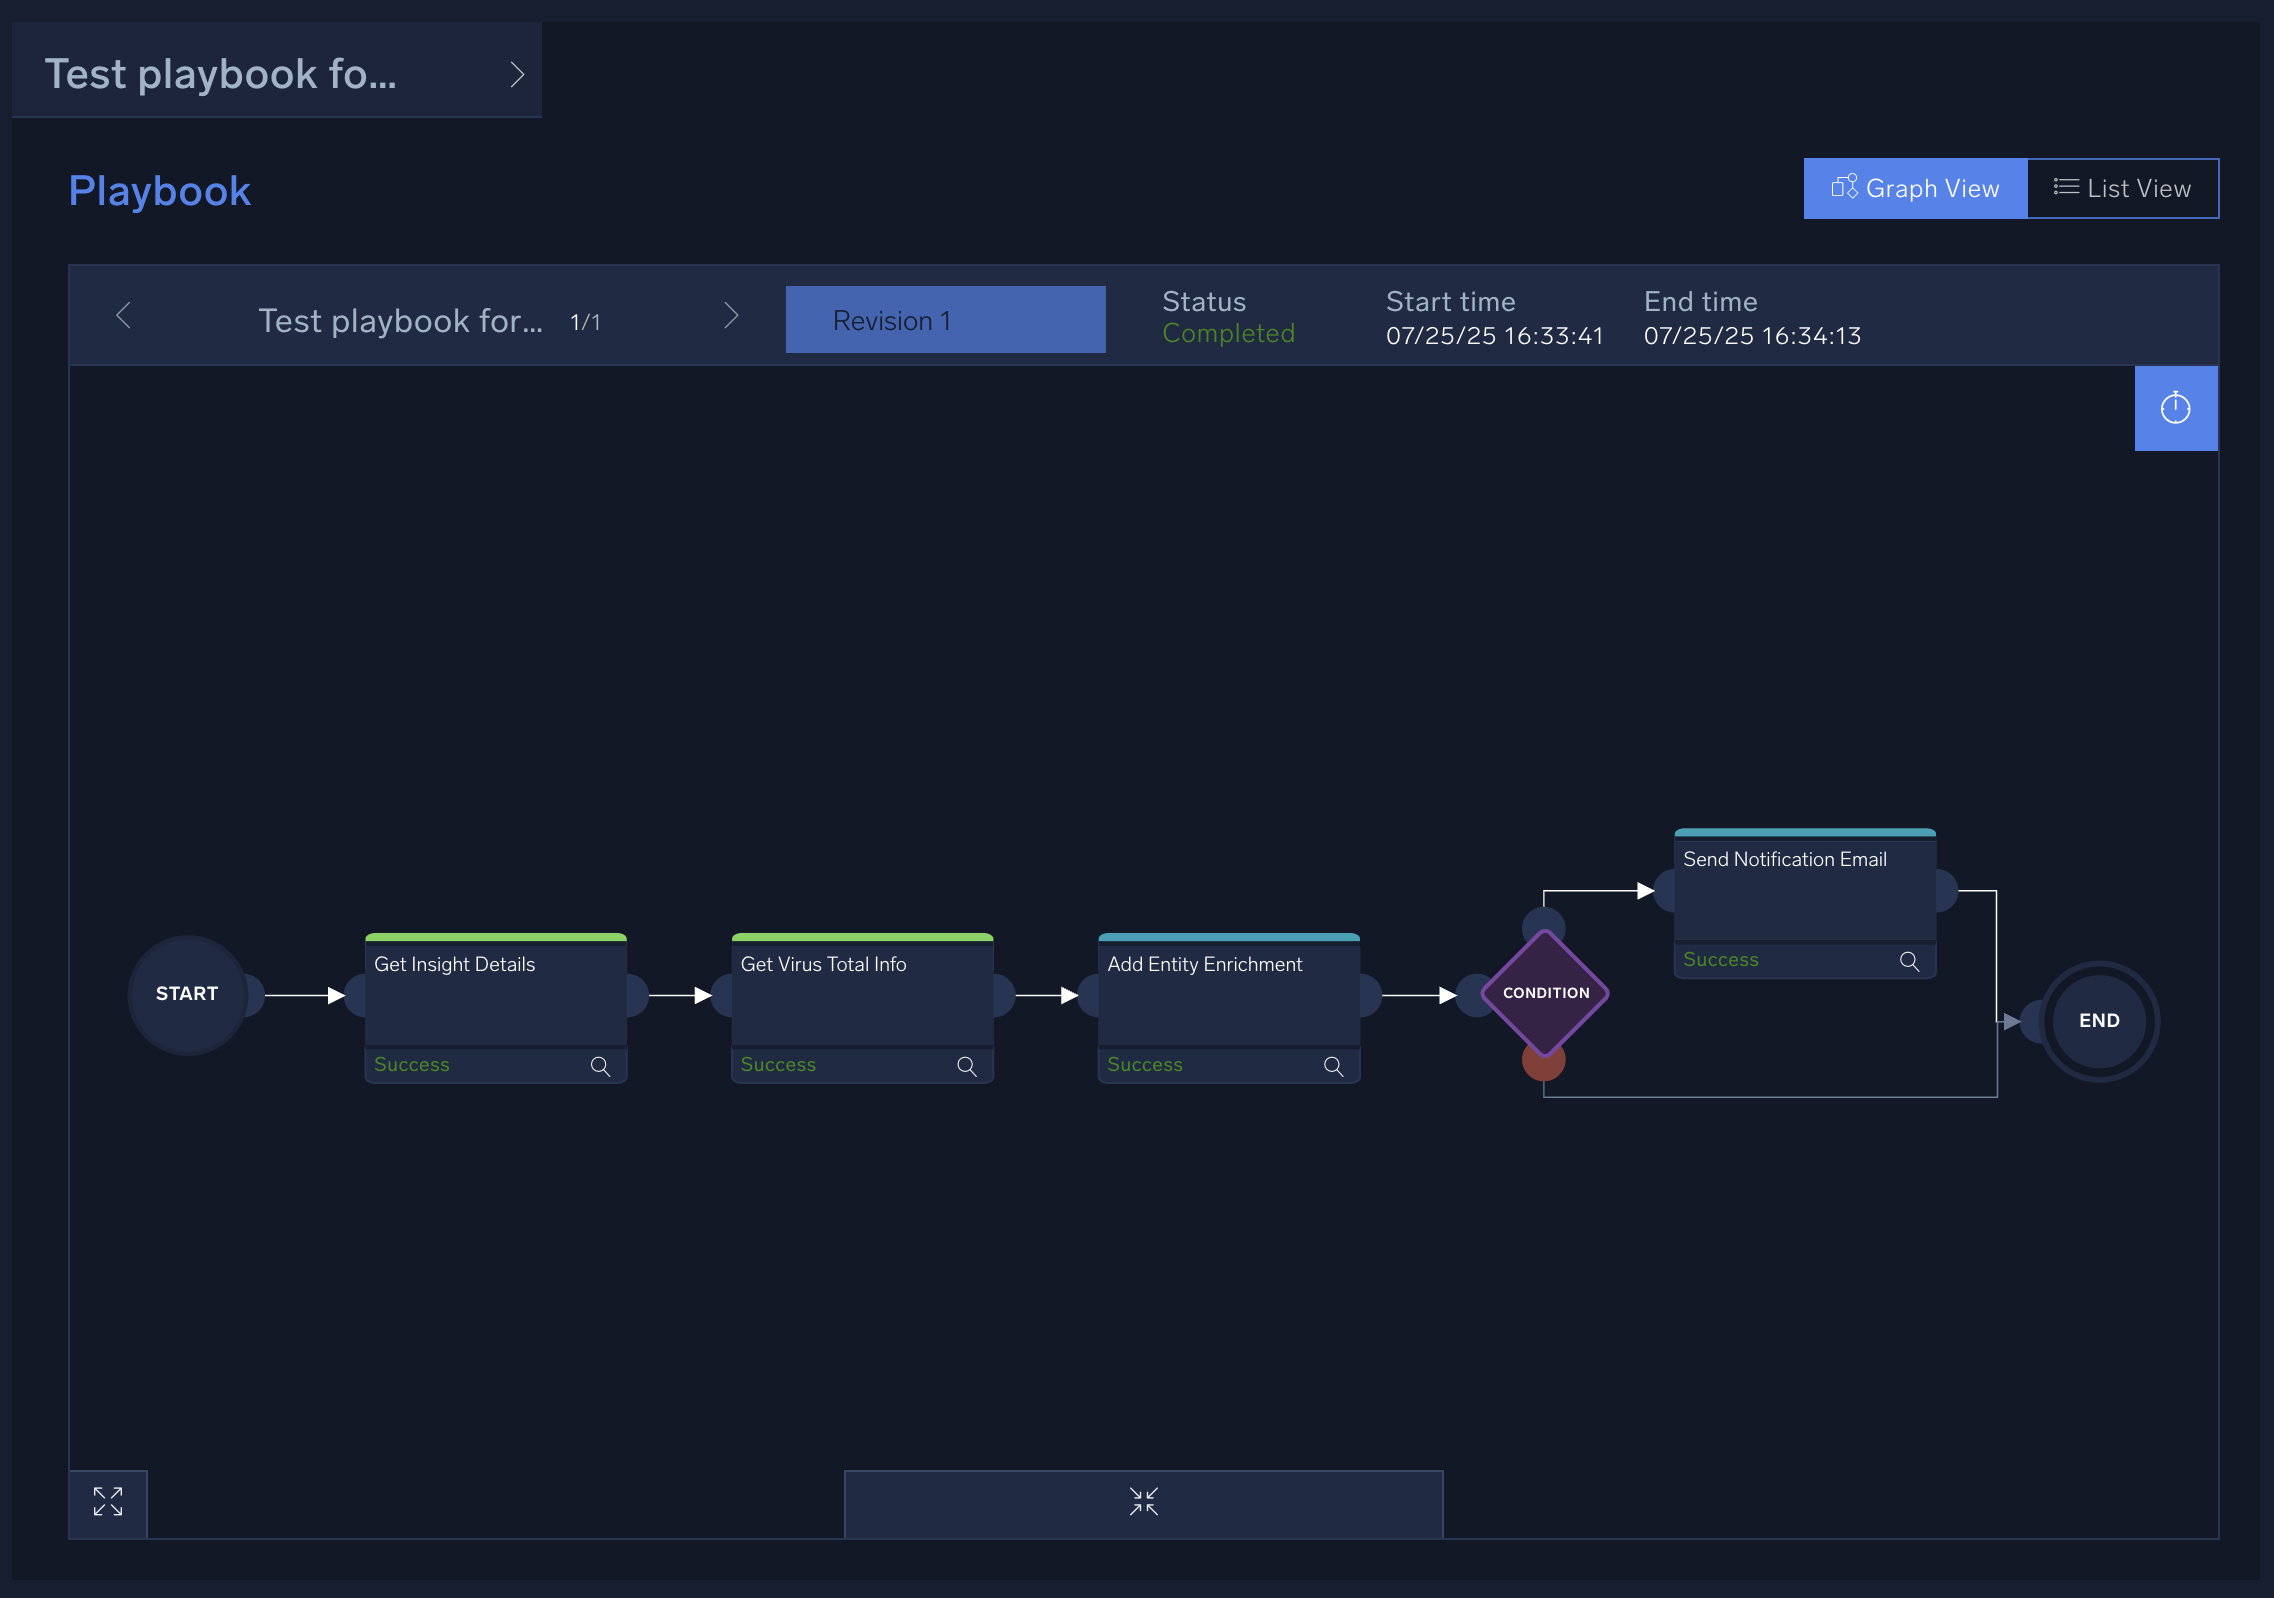
- Verify that the Start > End node sequence for all branches have been completed. It will look more or less like the screenshot below. (Note that you can always drag playbook elements anywhere in the playbook canvas for clarity or organization).
- At the bottom of the screen, click the Publish (clipboard) icon next to the Edit (pencil) icon to publish your playbook. (You can add a description here if you want.)
- Toggle the playbook from Enabled to Disabled. (You don't want this playbook to automatically run. It's only for manual testing purposes.)
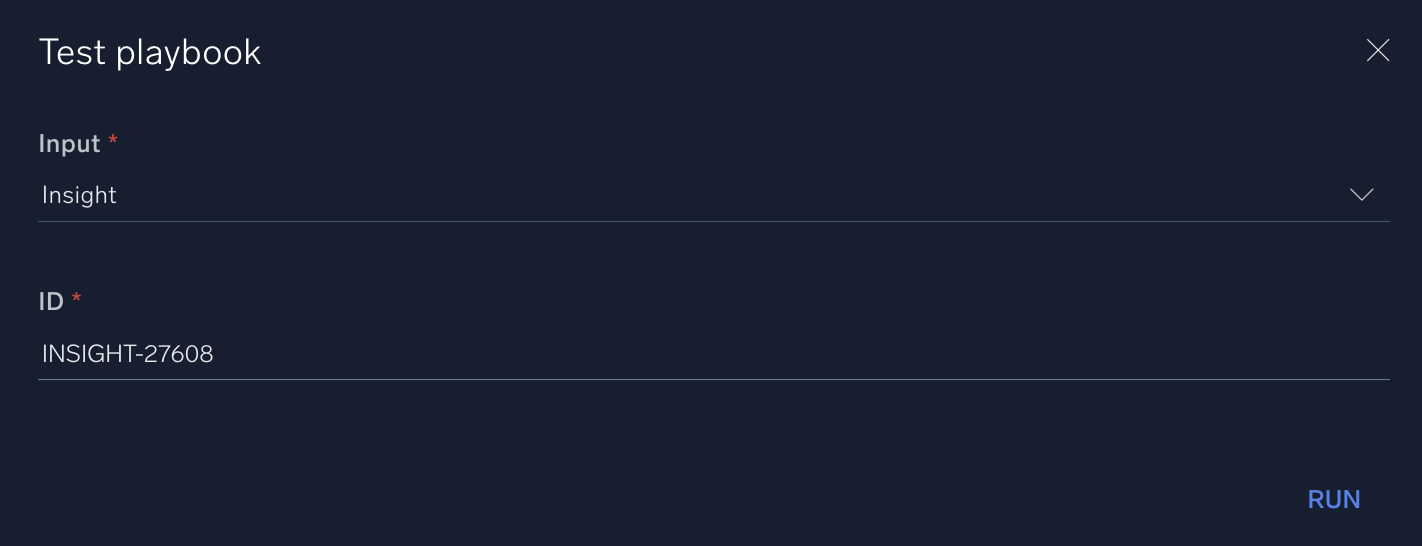
- Test your playbook:
- Search in Cloud SIEM for an insight with "HIGH" severity and copy the insight ID.
- In your playbook, go to the kebab icon in the upper right corner and select Run Test.
- For Input select Insight and in ID enter the insight ID.
- Click Run.
- The playbook runs. If errors occur, click the nodes with errors and troubleshoot the playbook.
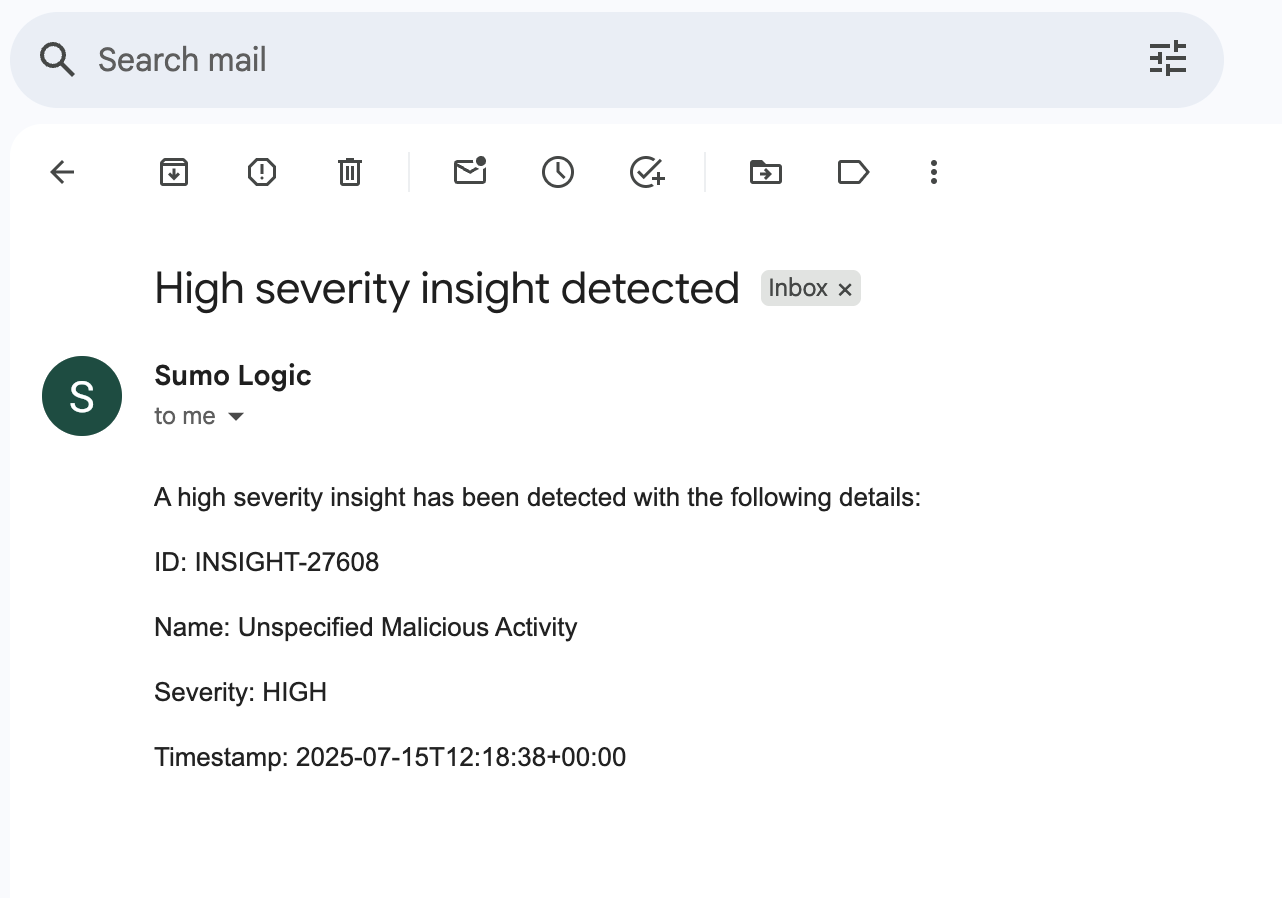
- After the playbook runs, the email recipient should get an email that looks like this:
Create a custom automation to run your Cloud SIEM insights playbook
Now that you've created a playbook as described in the previous section, let’s use Cloud SIEM to create an automation to run it. A Cloud SIEM automation allows you to automatically run a playbook based on a trigger, such as an insight being created or closed.
Automations define the conditions in which a playbook will be executed. For instance, you might want to execute a specific playbook whenever Cloud SIEM creates a new insight. Or another playbook whenever an insight is closed to create and distribute appropriate notifications or reports. Automations can also be set to "manual execution", allowing operators to run the playbook manually when judged necessary.
This way, potentially the entire incident response cycle can now be automated: a threat is identified, an insight or alert is triggered, then a playbook is automatically deployed to perform necessary actions and email a final report for an analyst to review.
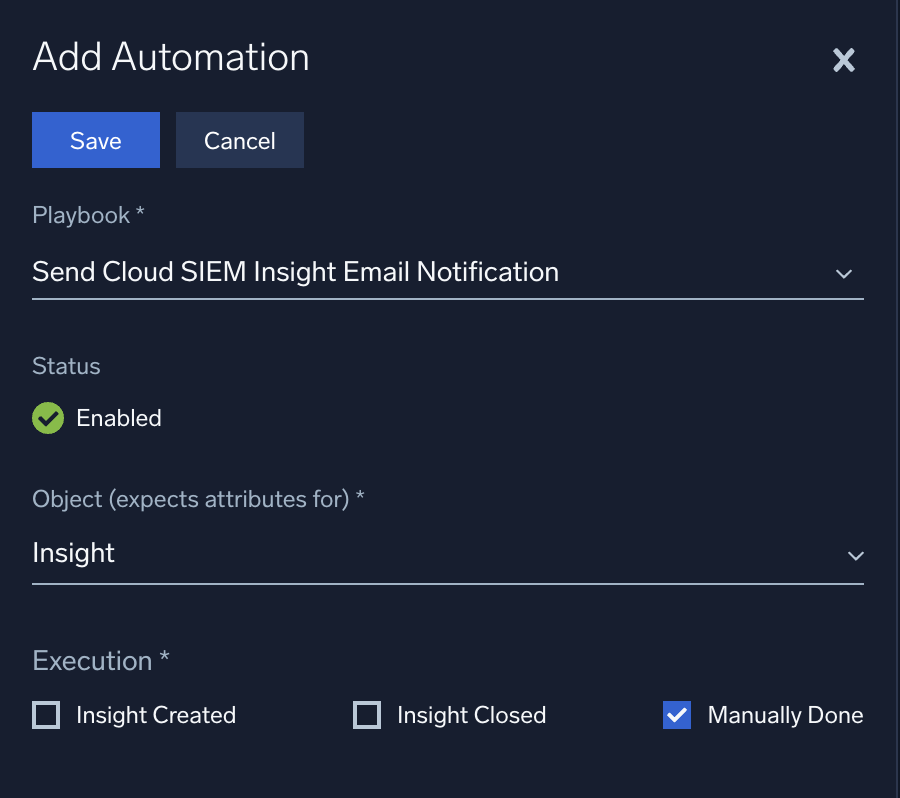
- New UI. In the main Sumo Logic menu select Cloud SIEM, and then under Cloud SIEM Integrations select Automation. You can also click the Go To... menu at the top of the screen and select Automation.
Classic UI. In the top menu select Configuration, and then under Integrations select Automation. - Click + Add Automation in the upper right.
- In the Playbook field, select the playbook you created in the previous section Create a playbook for Cloud SIEM insights. (If you do not see your playbook in the list, return to the previous steps and ensure your playbook was published as well as saved. You may also need to refresh your page to ensure that Cloud SIEM has updated with the recent playbook changes.)
- For the Object (expects attributes for) field, select Insight.
- Note that the checkboxes under the Execution field show that you can trigger your automation when an insight is created or closed. For this exercise, however, select Manually Done.
- Click Save when finished.
Test your Cloud SIEM automation
To test the automation you created in the previous section, run it on a Cloud SIEM insight:
- New UI. In the main Sumo Logic menu, select Cloud SIEM > Insights. You can also click Go To... at the top of the screen and select Insights.
Classic UI. In the main menu select Cloud SIEM and then click Insights at the top of the screen. - Since our test playbook only sends a notification for insights with high severity, you need to find an insight with high severity. In the Filters area at the top of the screen, search for insights with high severity.
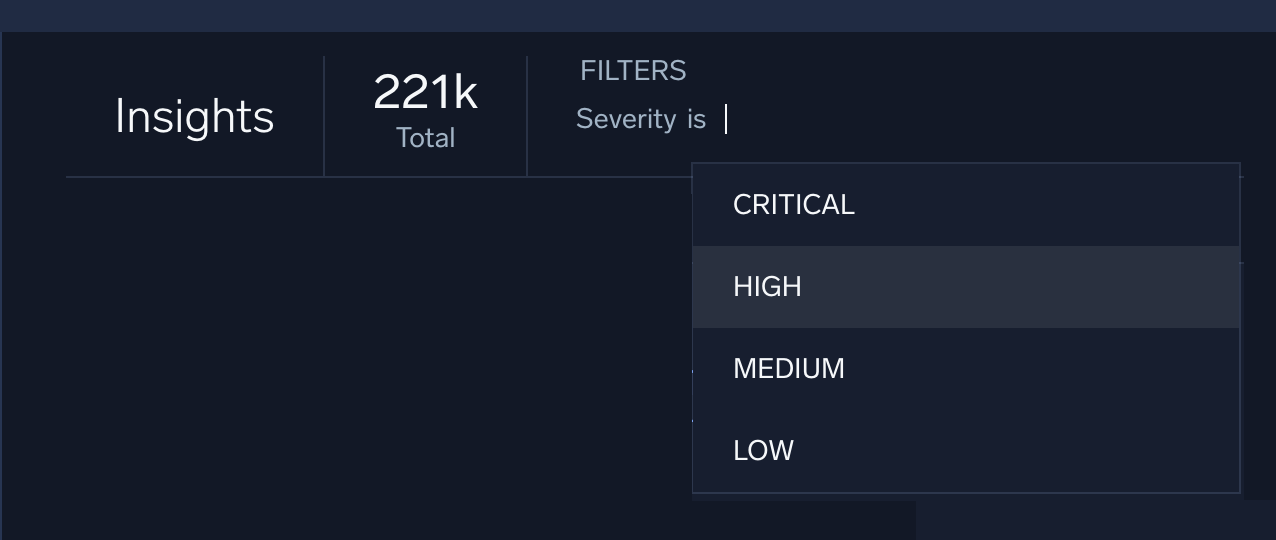
- Select an insight from the list of filter results.
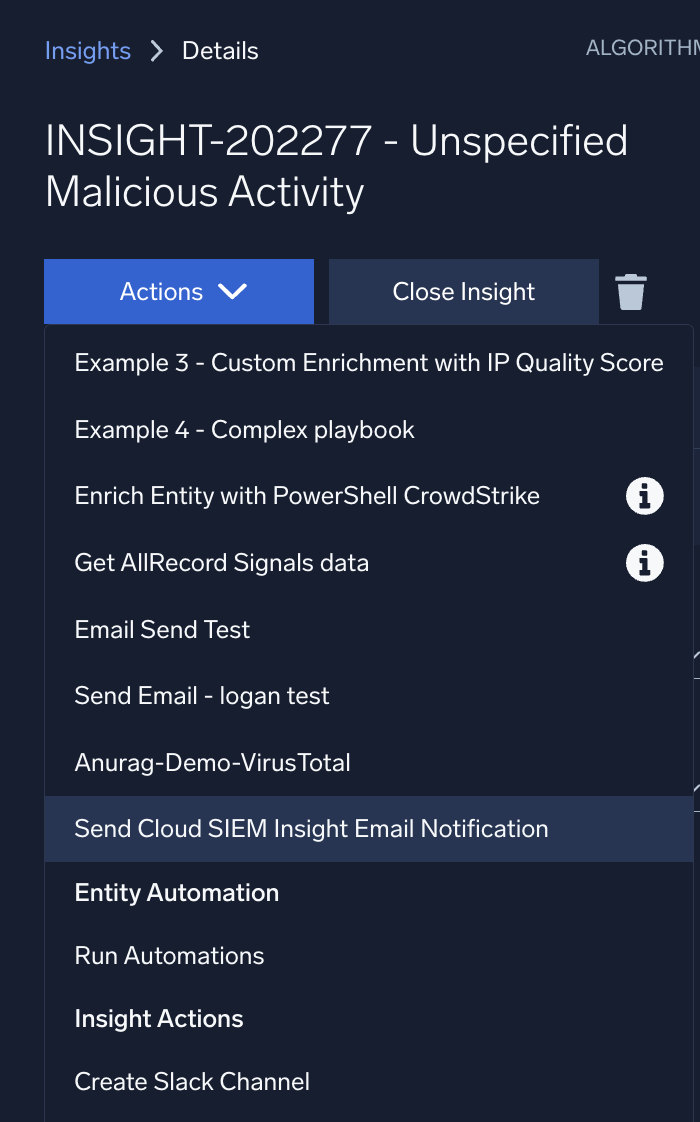
- Click Actions in the left sidebar of the insight and select your automation from the list. (If you do not see your automation, you may need to leave and return to Cloud SIEM to refresh the list.)
- You should see a green popup at the bottom indicating that your automation was successfully submitted for execution.

- Click the Automations tab on the top of the screen to see the results of executing your automation. Status will display the results of the playbook's run, such as Success or Completed with errors.
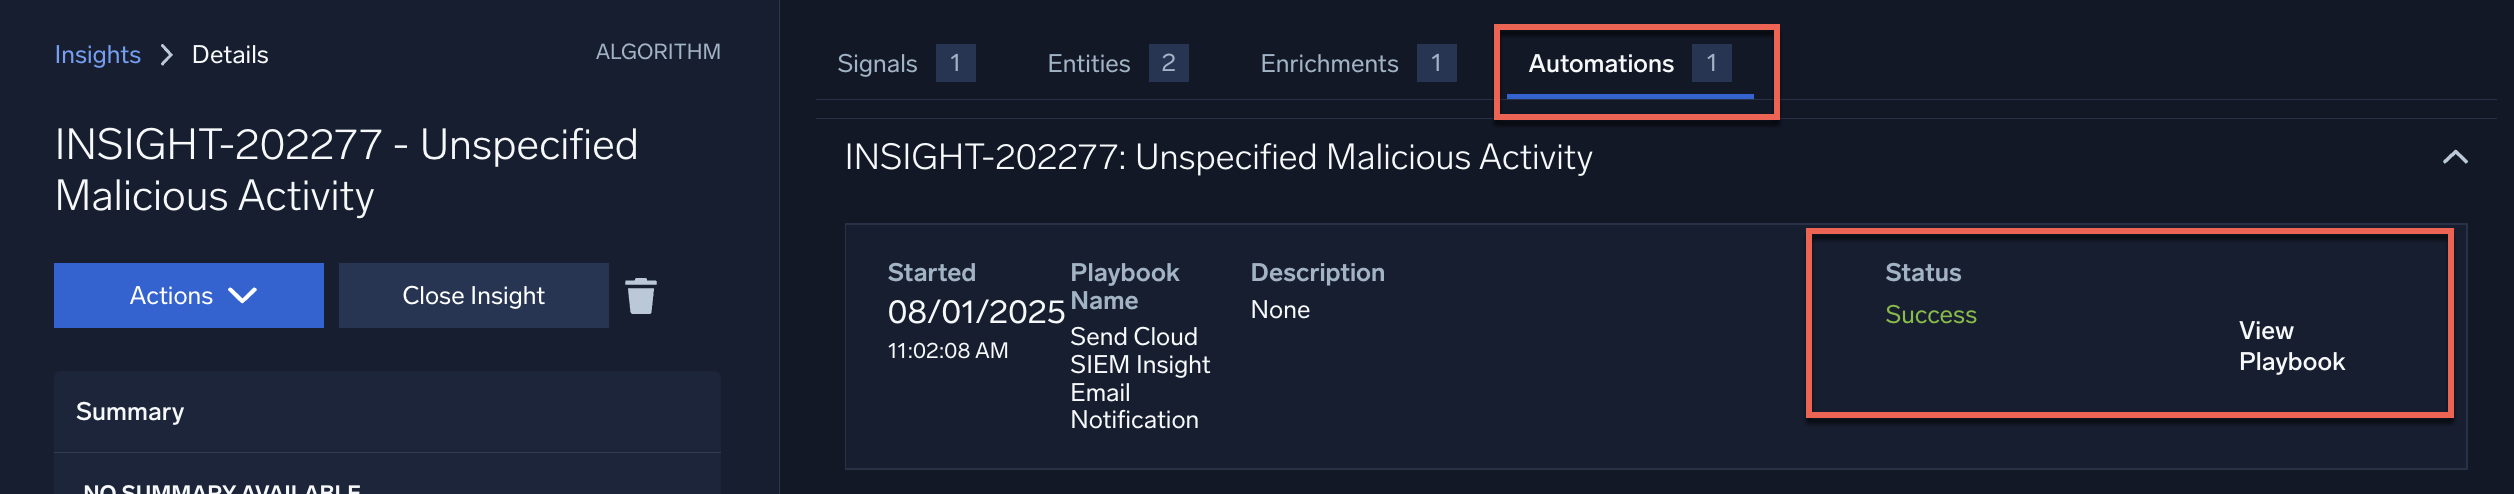
- Click the View Playbook to see more details about the playbook's execution, such as an explanation about any errors that occurred. (See Troubleshoot Playbooks for help if your playbook run has problems.)
- If the automation execution was successful, and you included your email in the playbook email notification when you created, your inbox should have an email from the Cloud SIEM system with the insight details as designed in the playbook.
You now have a custom automation that can be manually run or attached to insight creation or closing.
Create a playbook for alerting
Cloud SIEM isn’t the only application that can use playbooks from the Automation Service. You can also use automated playbooks in monitors. In this section, we'll create a playbook that will be triggered when an alert is generated by a monitor within Sumo Logic's Log Analytics Platform.
To create the playbook as described below, you must first configure the following integrations that the playbook will use:
For this playbook let’s presume we have some AWS EC2 instances that are being monitored through Sumo Logic. We’ll create a sample playbook that upon a monitor alert will get information about our instances and reboot them as needed.
- Go to the Playbooks page.
Classic UI. In the main Sumo Logic menu, select Automation > Playbooks.
New UI. In the main Sumo Logic menu, select Automation > Playbooks. You can also click the Go To... menu at the top of the screen and select Playbooks. - Create the playbook:
- Click the + button on the top of the playbook list.
- Give your playbook a name such as "AWS EC2 alert".
- For Type select Alert.
- Click Create.
- Edit the playbook:
- Click the Edit (pencil) icon to start editing your playbook.
- Click the pencil icon underneath the Start node.
- In the Edit node dialog, in the Add one or more params as a playbook input field select Alert as the playbook input. The dialog box will auto-populate with a number of parameters related to the source alert. (For more information about these parameters, see Alert payload variables.)
- In this case, we also want to add a custom parameter to facilitate later actions. Scroll down to the bottom of the Edit node dialog and click Add New Param.
- Type the following as the parameter name:
customPlaceholderMap[]."cloud.instance.id"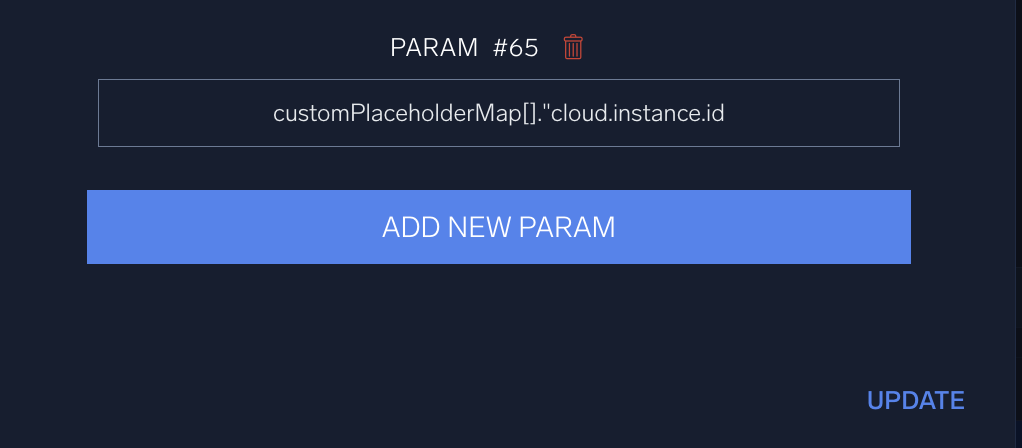
- Click Update when finished.
- Add a node to your playbook go get EC2 instance IDs:
- Click the + symbol on the Start node.
- Choose the Action node tpe.
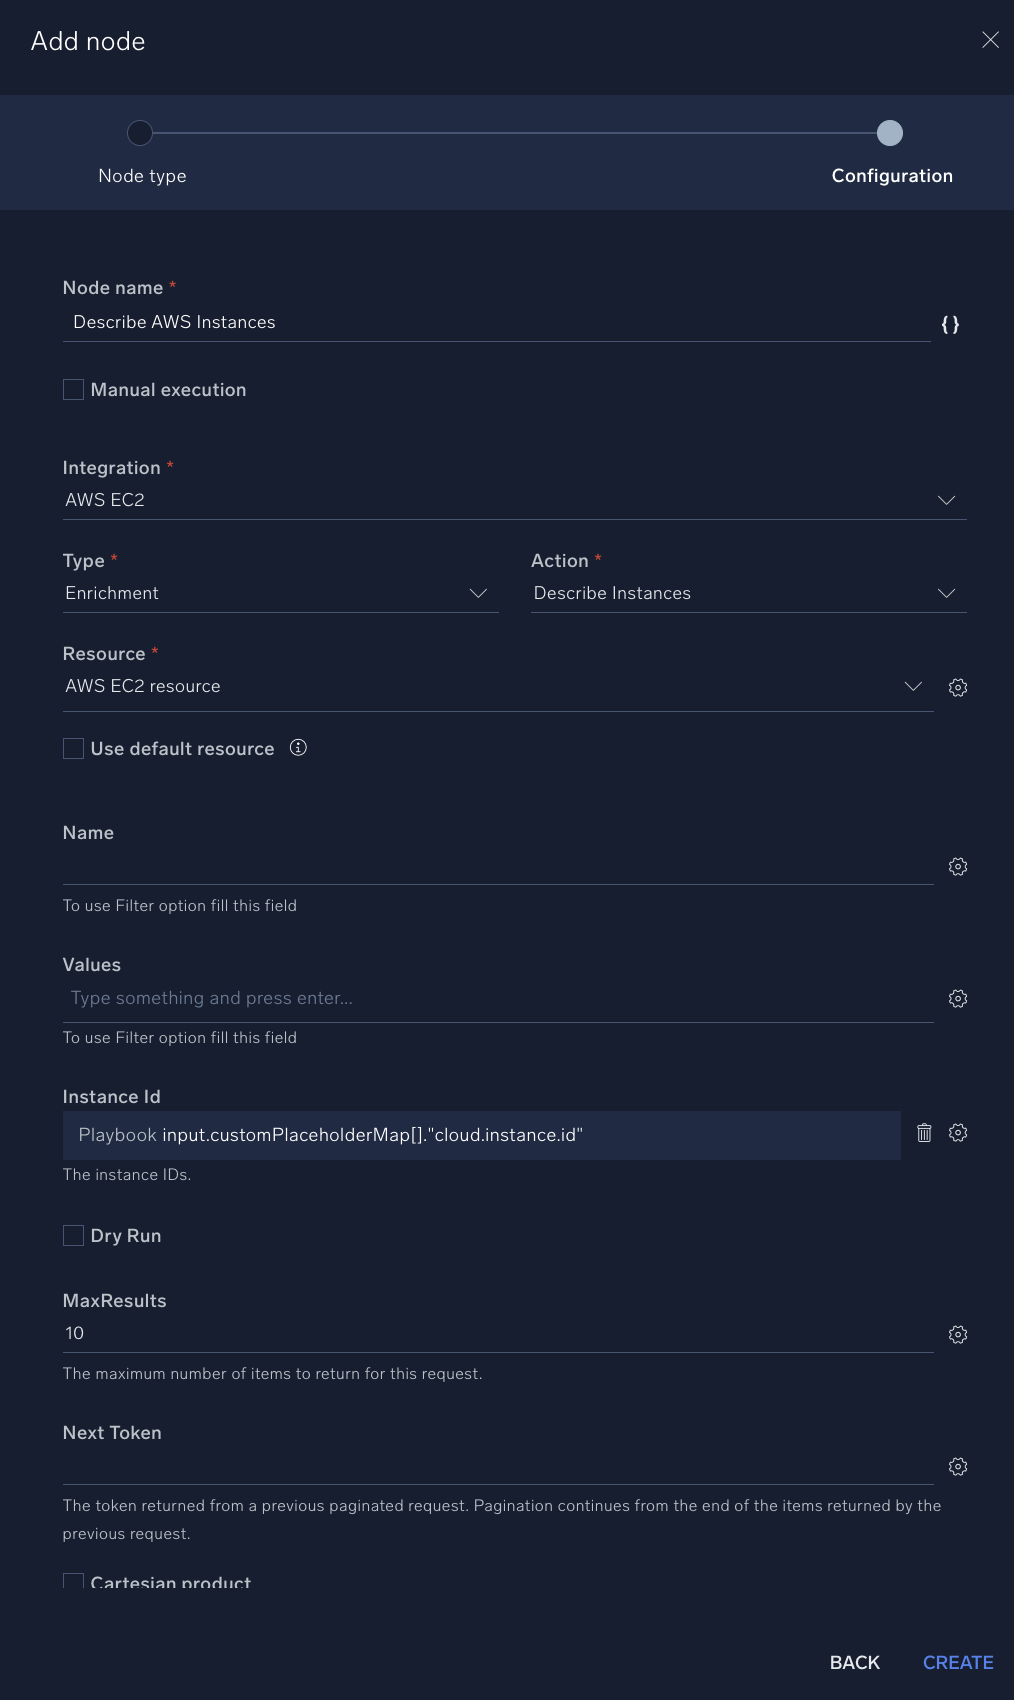
- Configure the node:
- Node name. "Describe AWS Instances"
- Integration. AWS EC2.
- Type. Enrichment.
- Action. Describe Instances.
- Instance ID. Click the gear icon and select Playbook inputs and then customPlaceholderMap[]."cloud.instance.id". If you do not see this item in the list, check that you added the new parameter and saved it successfully in the previous step.
- Click Create.
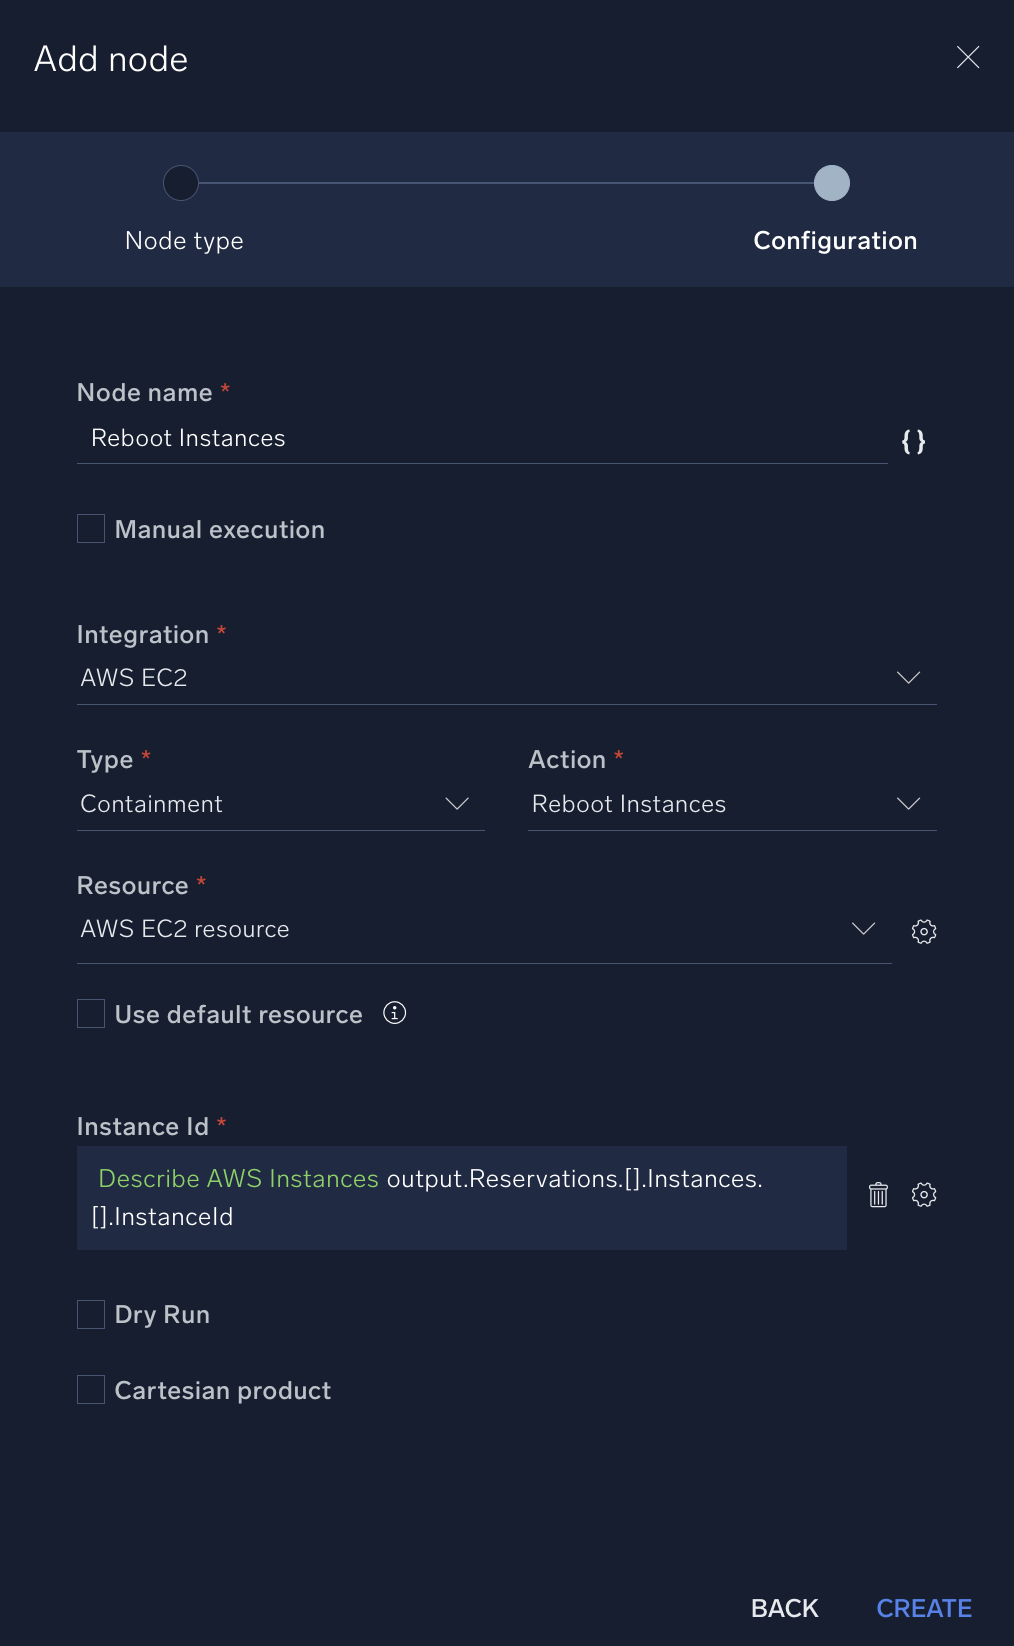
- Add a node to reboot EC2 instances:
- Click + on the Describe AWS Instances node you just created.
- Choose the Action node tpe.
- Configure the node:
- Node name. "Reboot Instances"
- Integration. AWS EC2.
- Type. Containment.
- Action Reboot Instances.
- Instance Id. Click the gear icon and select Describe AWS Instances and then output.Reservations.[].Instances.[].InstanceId.
- Click Create.
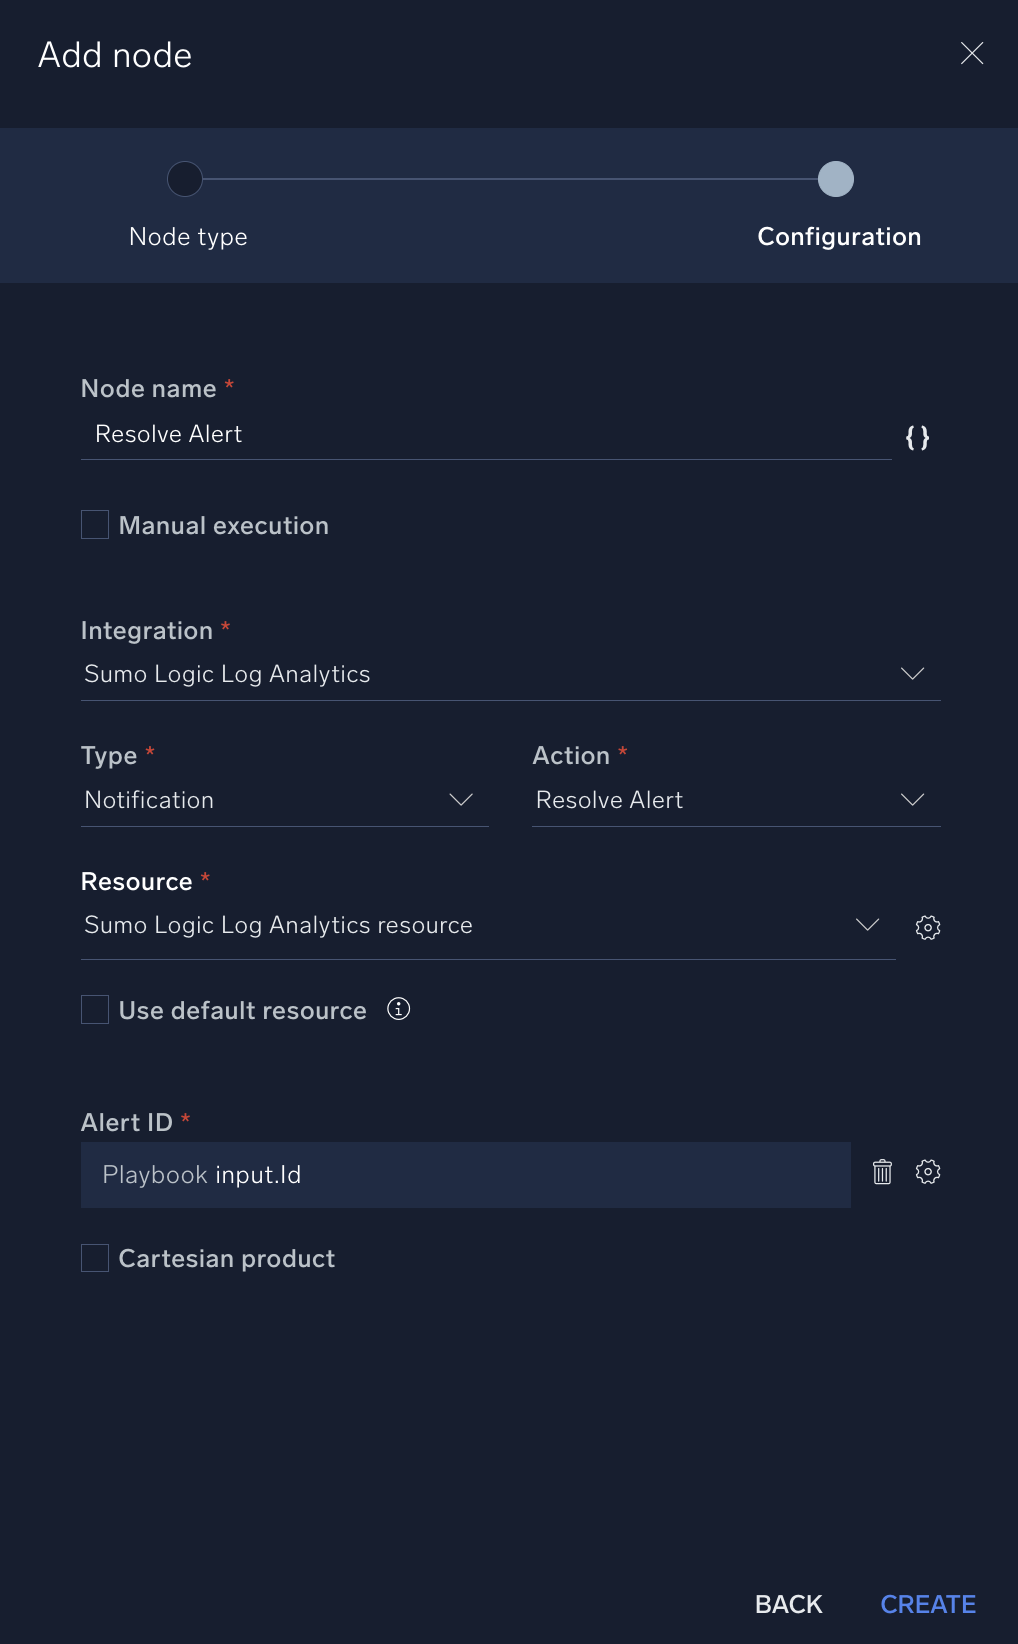
- Add a node to resolve the alerts:
- Click + on the Reboot Instances node you just created.
- Choose the Action node tpe.
- Configure the node:
- Name: "Resolve Alert"
- Integration. Sumo Logic Log Analytics.
- Type. Notification.
- Action Resolve Alert.
- Alert ID: Click the gear icon and select Playbook inputs and then input.Id.
- Click Create.
- Connect the Resolve Alert node to the End node. Your completed playbook will look more or less like the following:
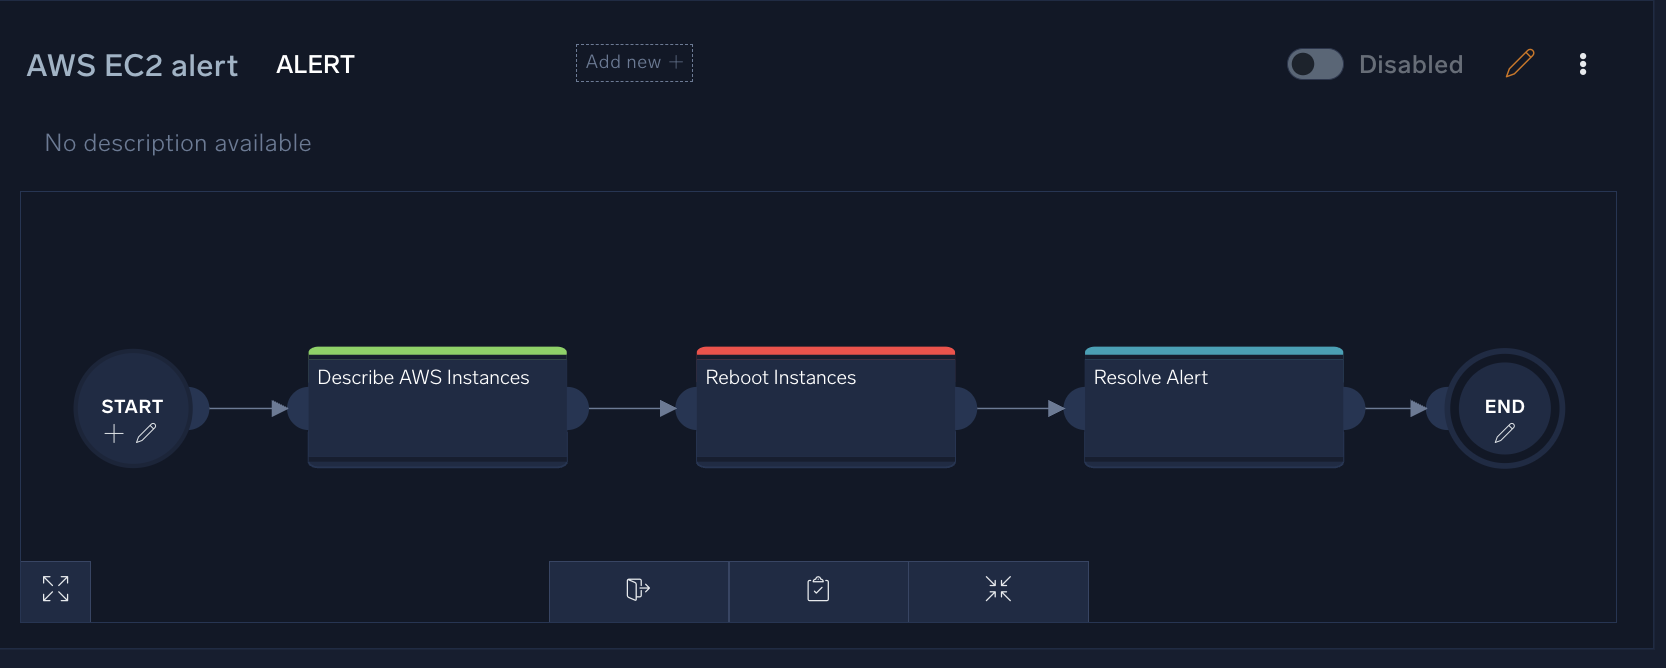
- At the bottom of the screen, click the Publish (clipboard) icon next to the Edit (pencil) icon to publish your playbook.
Attach your playbook to a monitor
Now that you have created a playbook for alerting, follow the directions in Add an automated playbook to a monitor to add the playbook to a monitor for your AWS EC2 instances. When the alert triggers, it will run the playbook.
- New UI. In the main Sumo Logic menu, select Monitoring > Monitors. You can also click the Go To... menu at the top of the screen and select Monitors.
Classic UI. In the main Sumo Logic menu, select Manage Data > Monitoring > Monitors. - In the Monitors screen, select the EC2 monitor you want to attach your "AWS EC2 alert" playbook to. For example, if you have installed the AWS Observability Solution, you could open the AWS Observability Monitors folder and select the AWS EC2 - High Total CPU Utilization monitor.
- Click Edit in the monitor details pane.
- Scroll down to the Playbooks section, and in the Automated Playbooks field select the "AWS EC2 alert" you created above in Create a playbook for alerting.
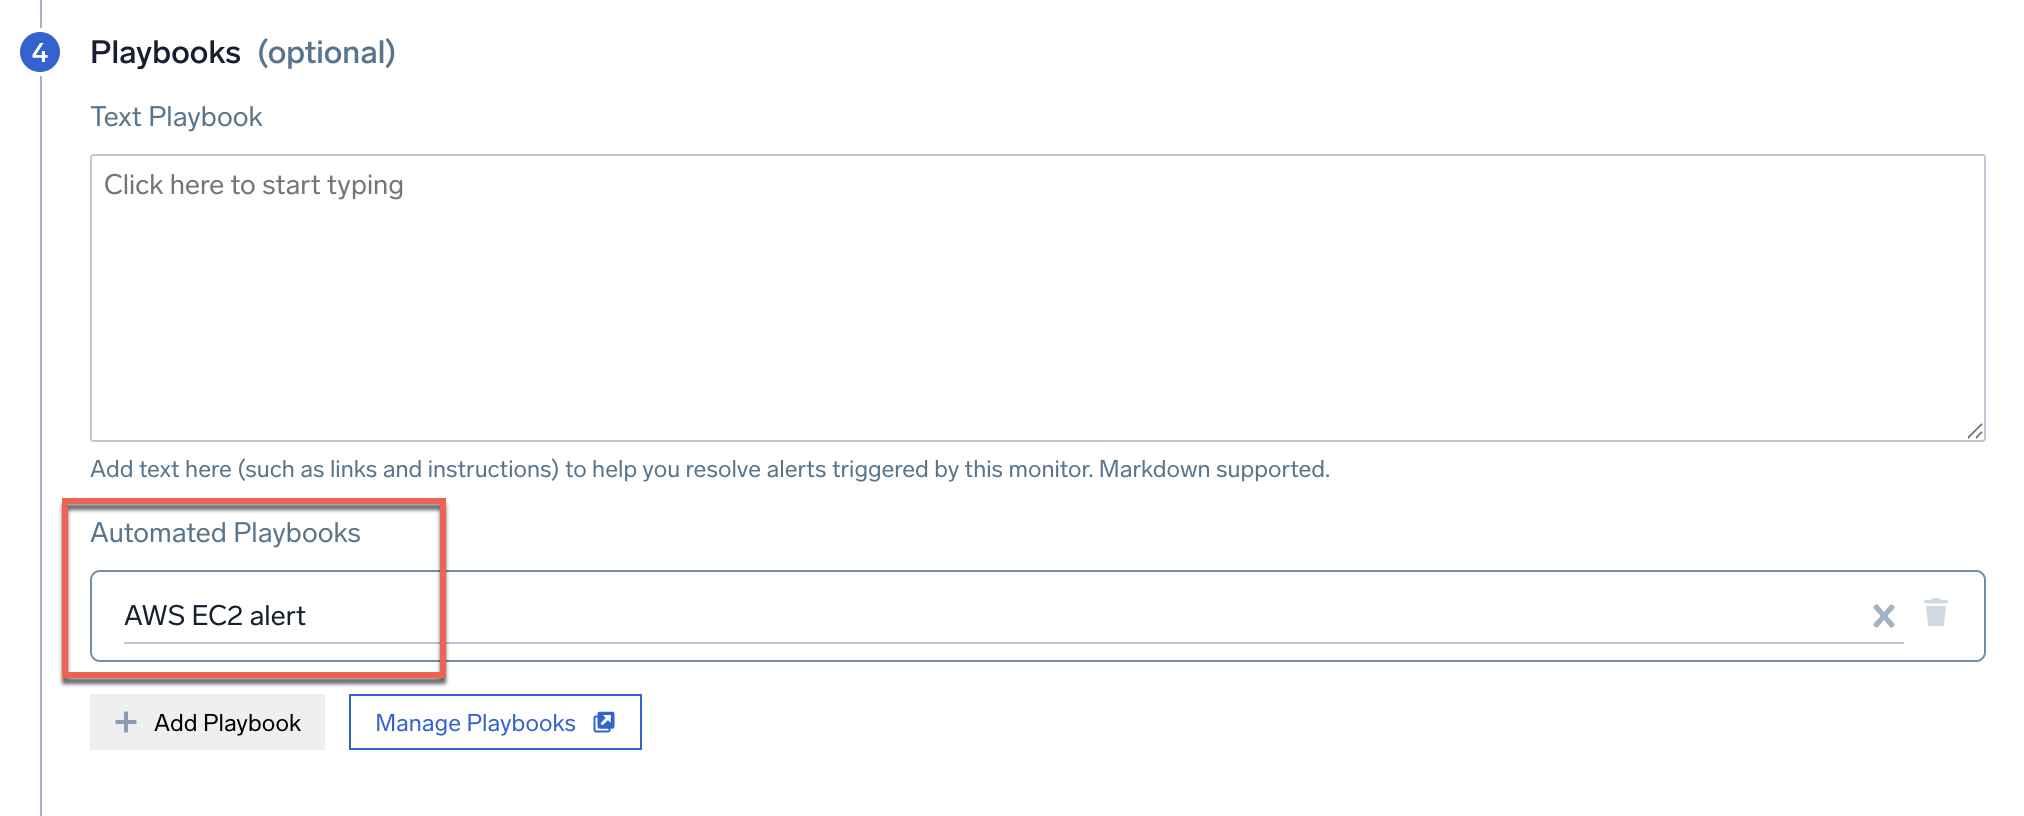
- Click Save.
Saving the monitor with this configuration will run the playbook automatically whenever the alert is triggered.
View the playbook in an alert
When the monitor you configured in the previous section triggers an alert, the playbook attached to the monitor runs. To see the results of the playbook execution, open the alert that was triggered.
- To get to your alert list, from the New UI, select Alerts > Alert List. From the Classic UI, click the bell icon in the top menu.
- Select the alert triggered by the monitor that has the playbook attached.
- On the alert details page, click Playbooks in the upper right corner. This opens a sidebar listing the playbook attached to the monitor.
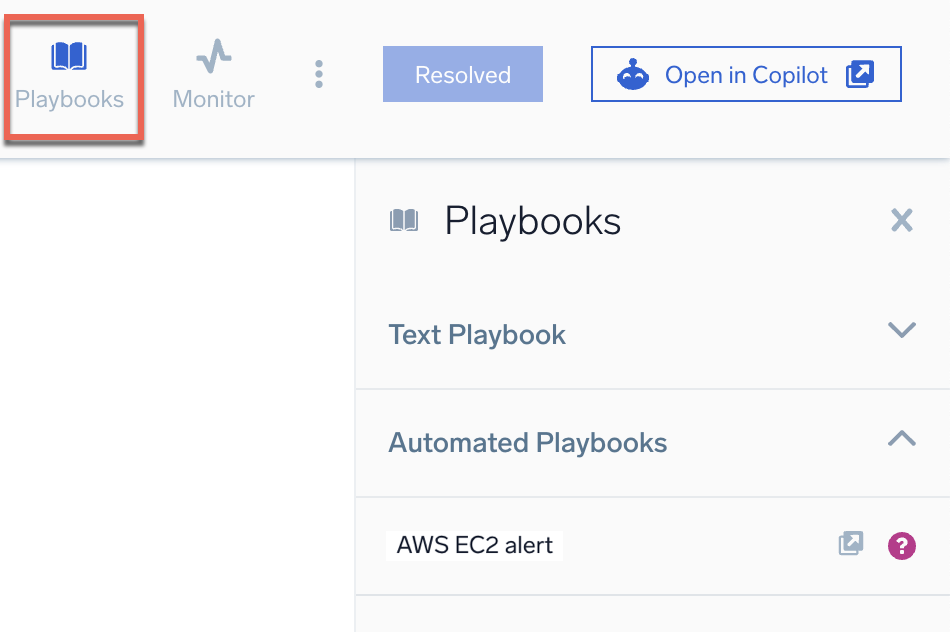
- Click the playbook link in the sidebar. This opens the playbook results page in another browser tab, showing you the results of each playbook action. If the playbook ran with errors, see Troubleshoot Playbooks for help.