Chart Search Results
In the Aggregates tab, in addition to the standard table view, you can view search results as a chart, such as a bar or column chart.
Only search results that have been aggregated using a group or aggregate operator can be charted. See Group or Aggregate Operators for a list.
When charting aggregate results from a query, the grouping function defines the plotted values on the one axis, and the grouping operator determines the values on the other axis. For example, group by _sourceHost produces a bar or point for each host. If you're using
multiple group-by functions, a separate bar or point represents each set of grouped results.
Chart aggregate results
Follow the below instructions to chart aggregate the results:
- From a search, run an aggregate query.
- From the Aggregates tab, click a graph button on the Aggregates tab.
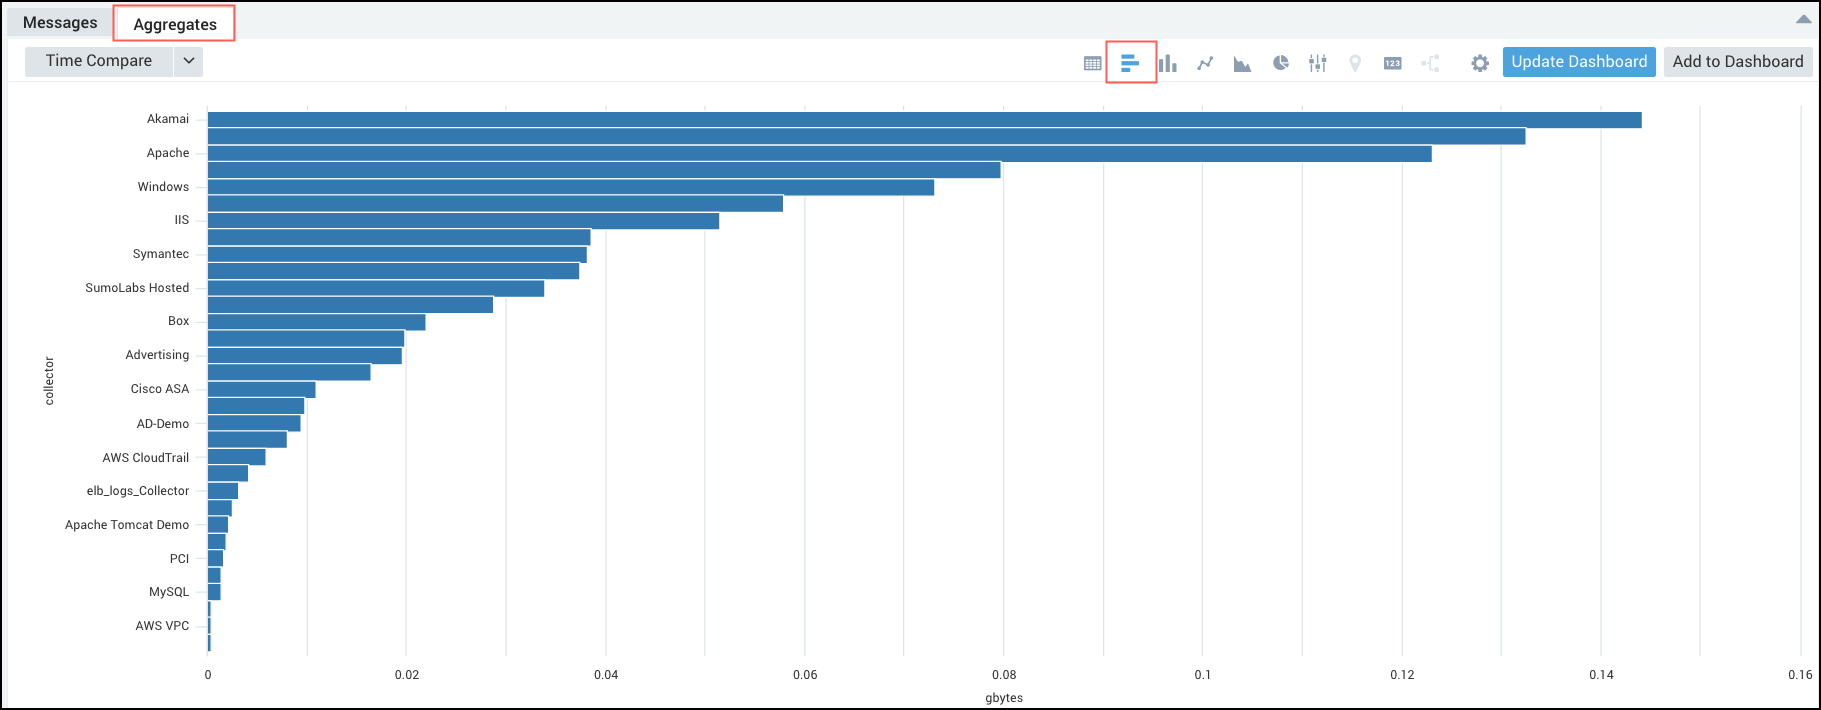
For this example, you can see a bar chart, but you can pick from any of the available charting options, see Chart Panel Types for details.
New Visualization
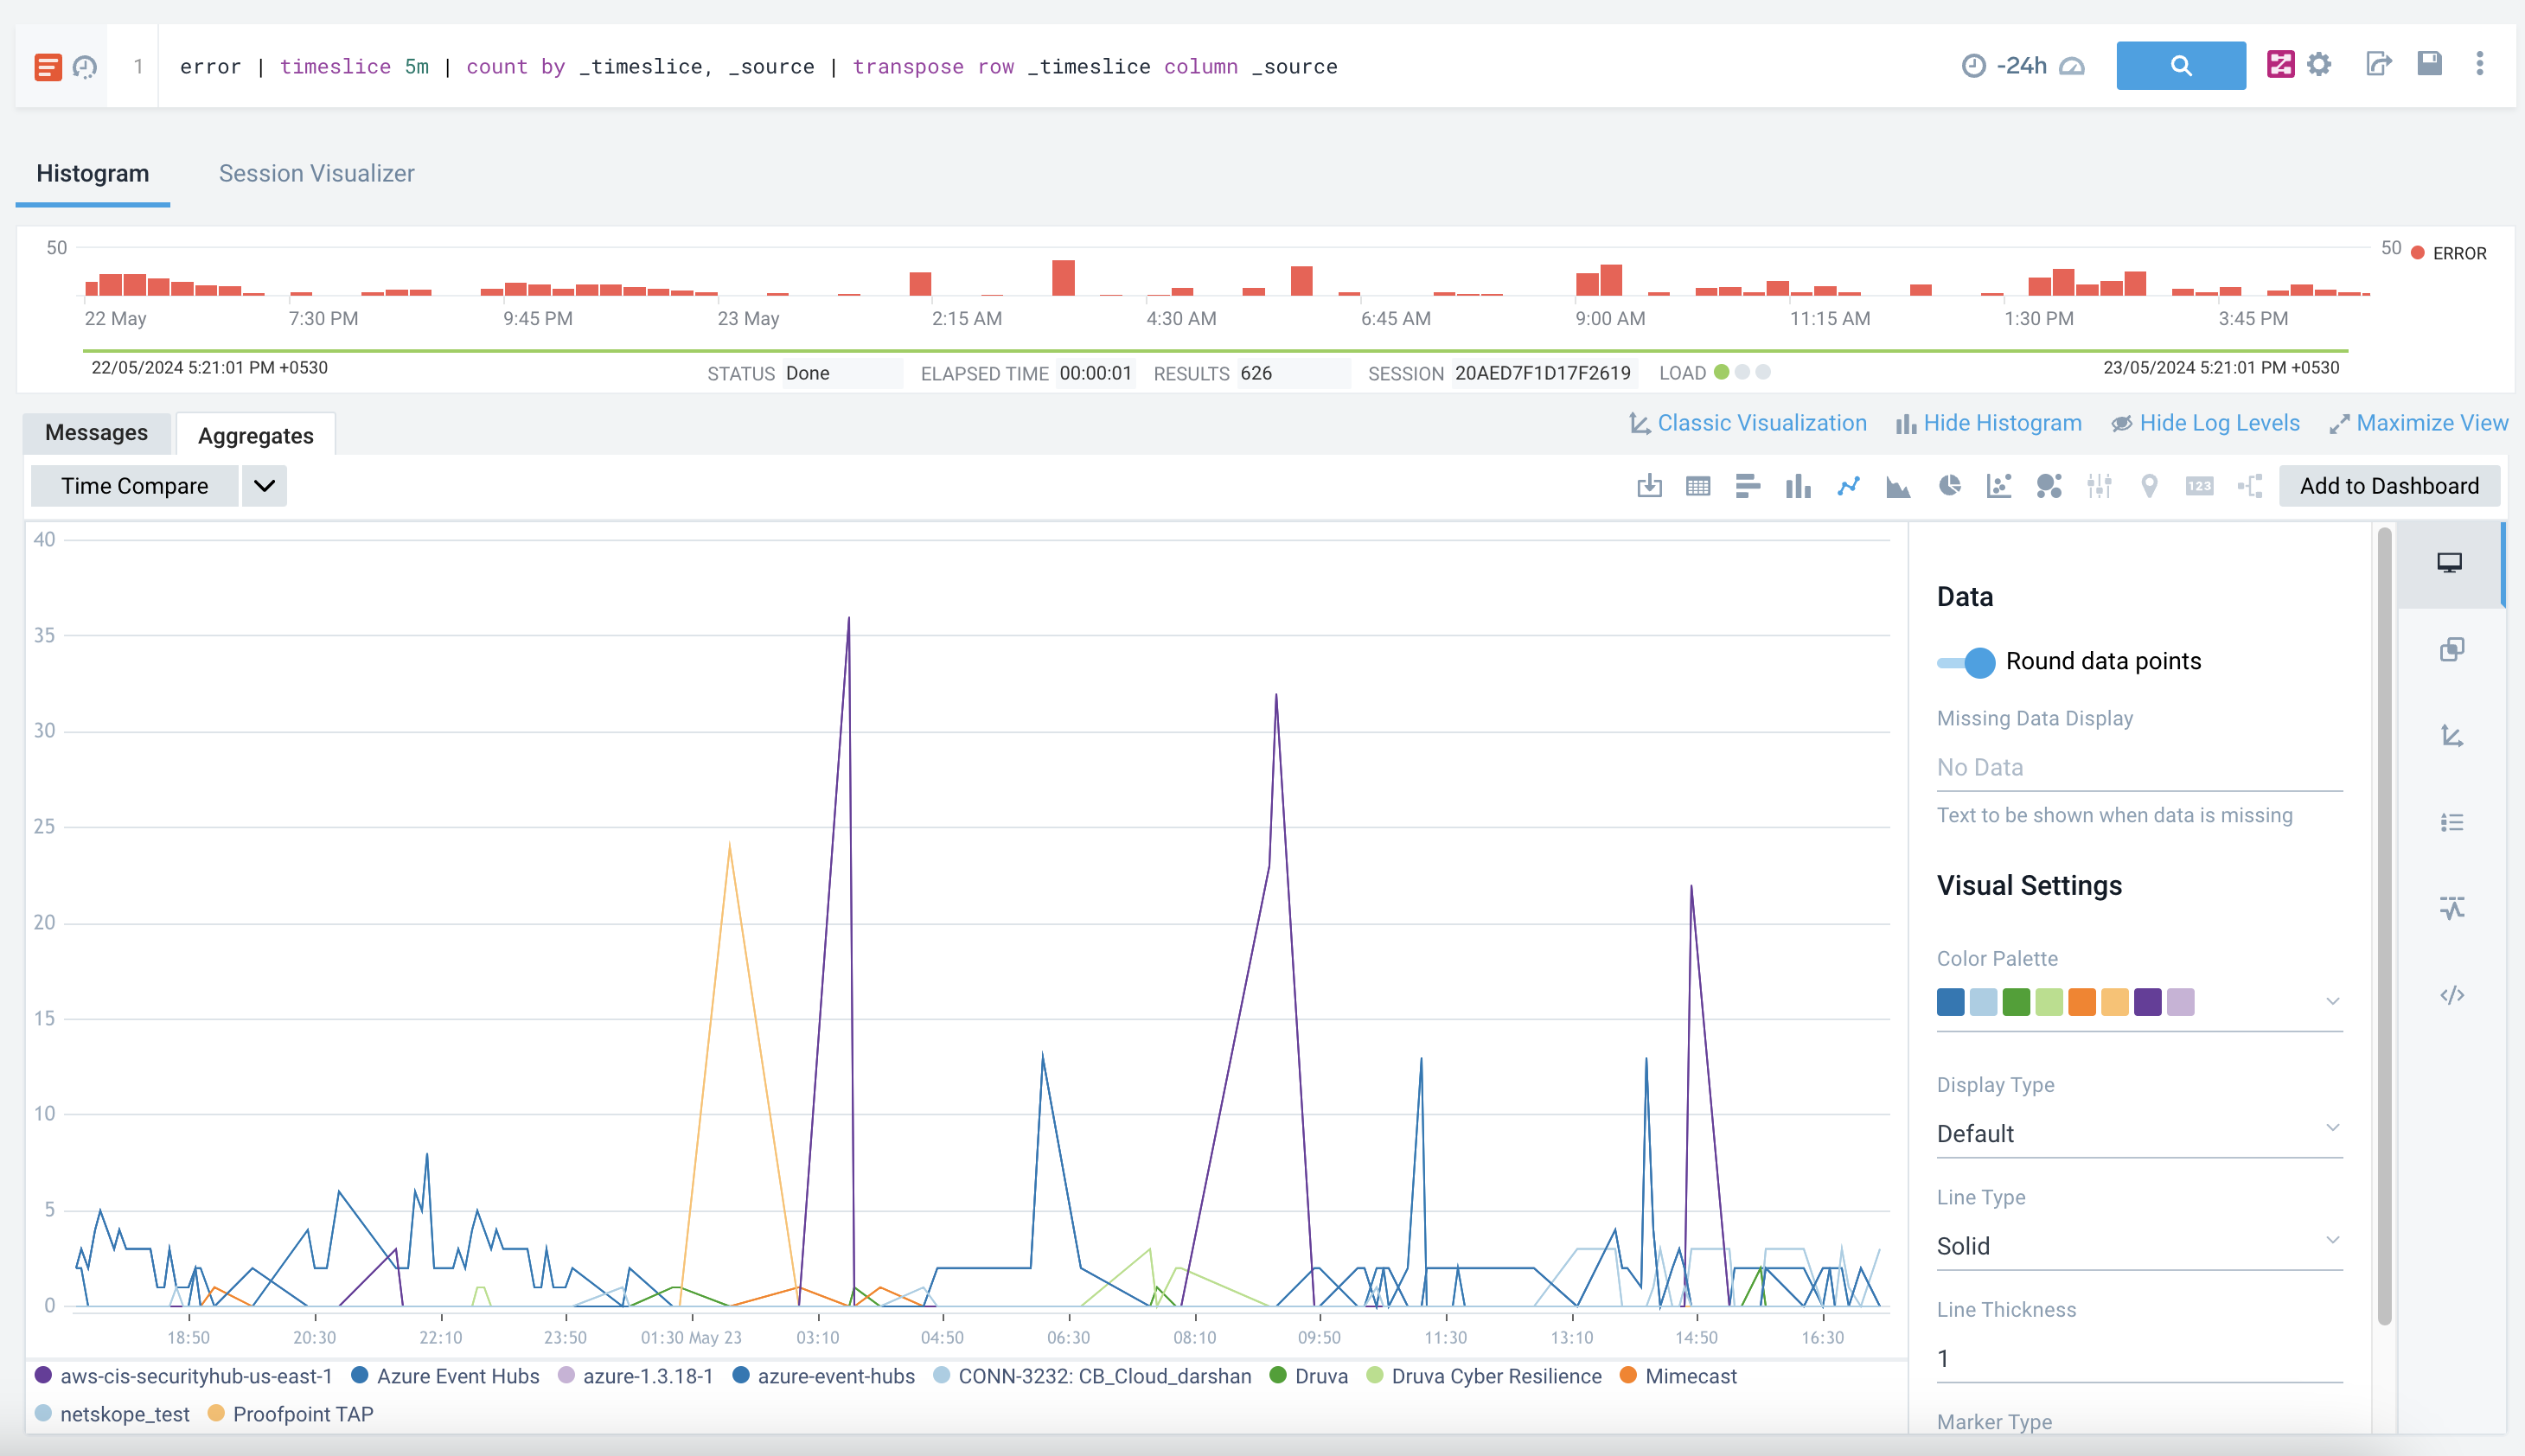
The New Visualization feature enables the new chart visualizations for your log search, allowing you customize each chart by modifying the available settings and providing a unified experience across the Sumo Logic platforms.
- Data. This section represents the data that has been used to plot the chart. Toggle the Round data point ON/OFF the round off to the value in tooltip.
- Visual Settings. Allows you to further customize your chart. The other customizing properties include: Color Palette, Fill Opacity, Marker Type, and Dimensions (x, y, and z).
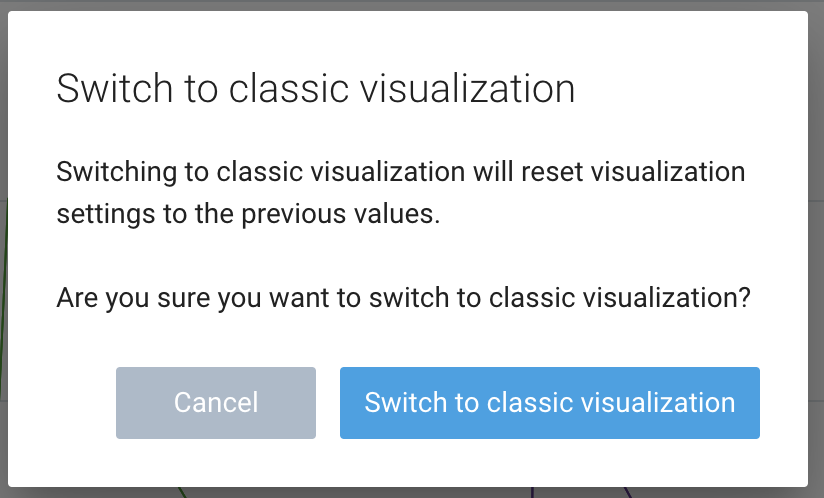
Charts will appear in New Visualization style by default. If you prefer to use the Classic Visualization UI, click the Classic Visualizations button, then in the popup window, click Switch to Classic Visualizations to proceed.
FAQ
Why are the chart options not available?
Your data may be a string data type instead of a number. Most aggregate operators will cast your data to a number, operators like first and last do not. You can cast your data to a number if needed using the num operator.
Example:
_sourceCategory=concierge completed execution
| parse "Execution duration: * s" as duration
| timeslice 5m
| first(duration) as duration by _timeslice
| num(duration)
| sort by duration
For details on casting your data to a string or numeric data type see Casting Data to a Number or String for details.