outlier Search Operator
Given a series of time-stamped numerical values, using the outlier operator in a query can identify values in a sequence that seem unexpected, and would identify an alert or violation, for example, for a scheduled search.
To do this, the Outlier operator tracks the moving average and standard deviation of a numerical field. An outlier is identified based on a specified threshold of standard deviations around the expected value. If a data point is outside the threshold, it is considered to be an outlier.
Syntax
...
| timeslice <time_period>
| <aggregate operator> as <field> by _timeslice
| outlier <field> [window=<#>, threshold=<#>, consecutive=<#>, direction=<+->]
...
| timeslice <time_period>
| <aggregate operator> by _timeslice, <field>
| outlier <_aggregate> by <field> [window=<#>, threshold=<#>, consecutive=<#>, direction=<+->]
A timeslice is required.
The second syntax example uses an additional “group by” clause to find outliers for multiple values of a field. See the example below for details.
The following table lists the fields returned in outlier results:
| Field | Description |
|---|---|
<field>_error | This is the <field> - mean. |
<field>_lower | This is the mean - threshold*standard deviation. |
<field>_upper | This is the mean + threshold*standard deviation. |
<field>_indicator | This is either 0 or 1. It is set to 1 for a data point outside of the lower and upper boundaries. Data observed further than the specified number of standard deviations from the rolling average is an outlier, known as an indicator. |
<field>_violation | This is either 0 or 1. It is set to 1 for hitting the specified number of consecutive indicators, known as an outlier. |
You can configure options by setting parameters through keyword arguments, such as window, threshold, consecutive, and direction.
| Keyword Argument | Description |
|---|---|
| window | Sets the trailing number of data points to calculate mean and sigma. The default is 10. |
| threshold | Sets the number of standard deviations for calculating violations. The default is 3.0. |
| consecutive | Sets the required number of consecutive indicator data points (outliers) to trigger a violation. The default is 1. |
| direction | Use +-, +, or -, to specify which direction should trigger violations:
|
For example, this query would set the following parameters:
... | outlier <field> window=5,threshold=3,consecutive=2,direction=+-
- window=5 : Use the trailing 5 data points to calculate mean and sigma.
- threshold=3 : Calculate violation based on +/- 3 standard deviations.
- consecutive=2 : Trigger a violation by returning
<field>_violation=1in the search results only if 2 or more consecutive indicator data points occur. - direction=+- : Uses positive or negative deviations.
Rules
- The outlier operator must appear after a group by aggregator, such as
count,min,max, orsum. - The original target field must be numeric.
- A
timesliceis required.
Limitations
- Because the most recent time bucket in a query may have incomplete data, it is ignored by outlier. Consequently, if an alert is set to trigger on
<field>_violationchanging to 1, this alert will trigger one timeslice later.
Examples
IIS logs
Run the following query to find outlier values in IIS logs over the last 6 hours.
_sourceCategory=IIS/Access
| parse regex "\d+-\d+-\d+ \d+:\d+:\d+ (?<server_ip>\S+) (?<method>\S+) (?<cs_uri_stem>/\S+?) \S+ \d+ (?<user>\S+) (?<client_ip>[\.\d]+) "
| parse regex "\d+ \d+ \d+ (?<response_time>\d+)$"
| timeslice 15m
| max(response_time) as response_time by _timeslice
| outlier response_time window=5,threshold=3,consecutive=2,direction=+-
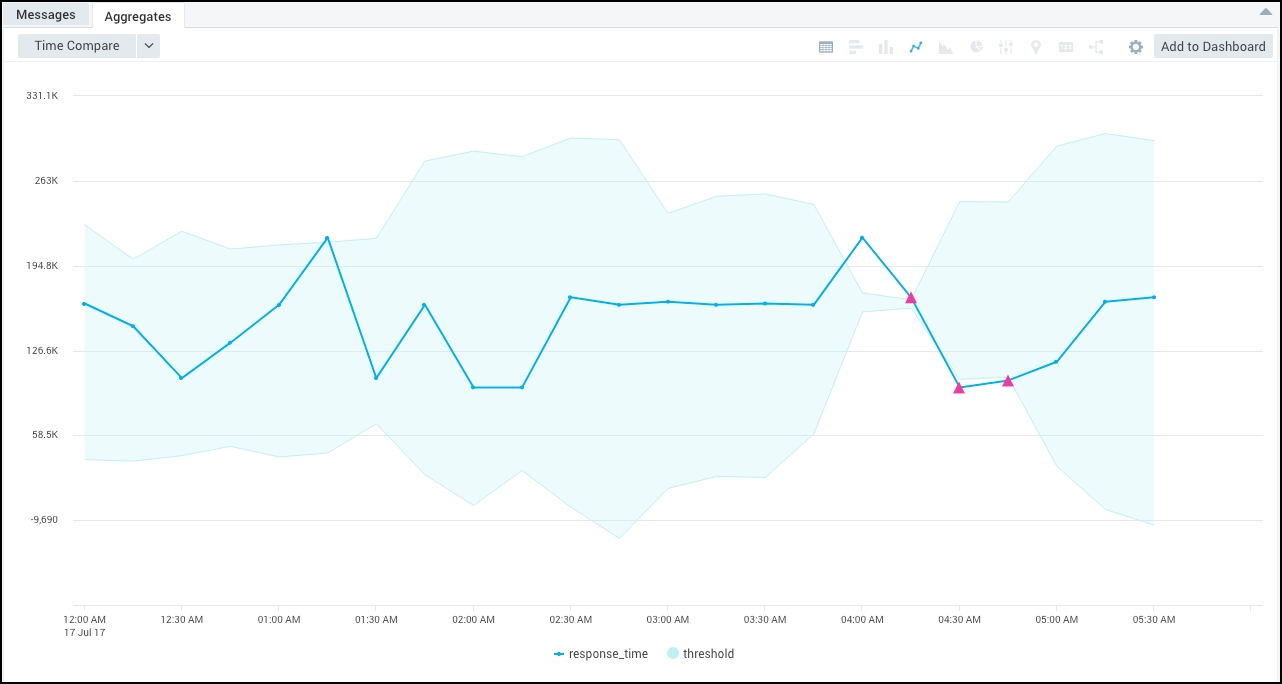
The outlier values are represented by the pink triangles in the resulting chart.
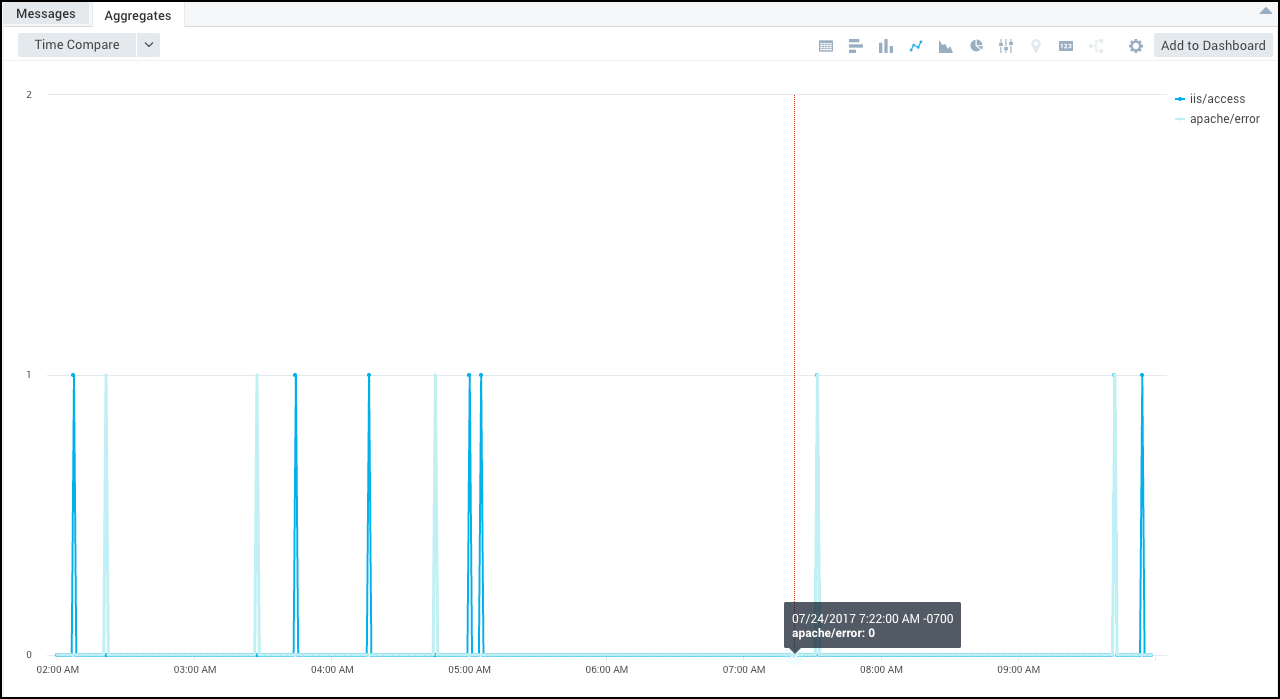
Apache logs - Server Errors Over Time
Run the following query to find outlier values in Apache logs over the last 3 hours.
_sourceCategory=Apache/Access
| parse "HTTP/1.1\" * " as status_code
| where status_code matches "5*"
| timeslice 5m
| count(status_code) as status_code by _timeslice
| outlier status_code window=5,threshold=3,consecutive=1,direction=+-
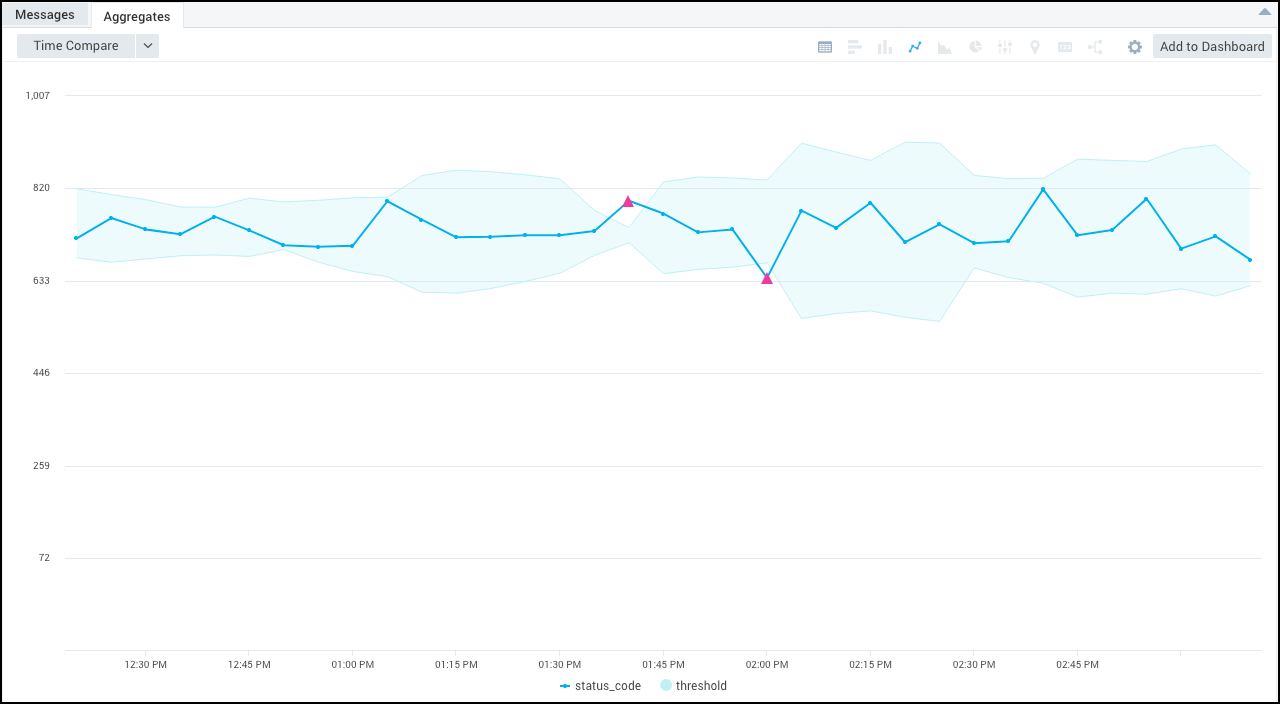
The outlier values are represented by the pink triangles in the resulting chart.
Use an additional “group by” clause to find outliers for multiple values of _sourceHost
You can also run a query like this:
_sourceCategory=Apache/Access
| timeslice 1m
| count by _timeslice, _sourceHost
| outlier _count by _sourceHost
This way, you can run outlier analysis separately for each value of _sourceHost, as shown.
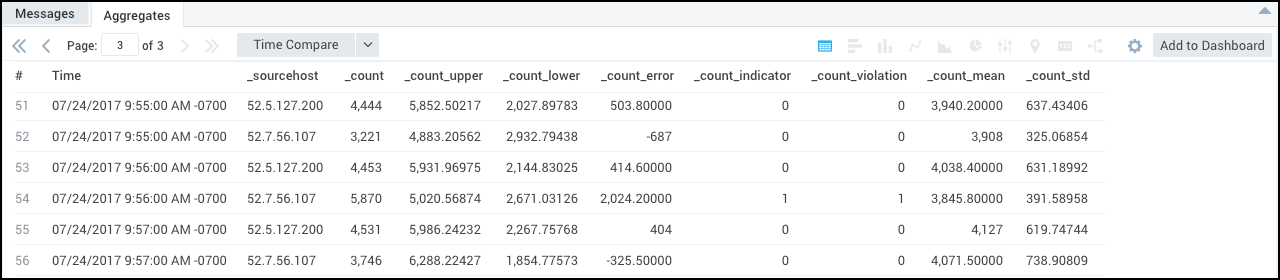
This example will only produce an aggregation table, not a chart, but the indicator and violation fields will correctly reflect each _sourceHost processing.
Alert on an outlier
To alert on an outlier, check the Alert when result is greater than or equal to <threshold> standard deviations from baseline for <consecutive> consecutive out of <window> data points checkbox in the Trigger Type section while creating the monitor. For more information, refer to the Trigger Type - Outlier detection method.
Multidimensional Outlier Detection
The Outlier operator supports multidimensional or multi-time series detection. Multidimensional outlier detection is useful when you want to monitor the behavior of each user, server, application feature, or other single “entity”, rather than some aggregation across all entities.
For example, you'd detect failed logins by user. To do so, you'd want to understand whether any user account, individually, has experienced a strange amount of failed logins, not whether we have seen some spike in the average or total amount of failed logins across all users. The latter may be useful, but with hundreds or thousands of users (entities), a spike in failed logins may get lost in the noise of a “normal” amount of total failed logins, and you'd miss a spike in failed logins for one specific user.
Other examples include:
- Detecting anomalies while tracking page faults, disk operation, or CPU utilization for all the nodes in a cluster simultaneously.
- Monitoring the performance of every workstation simultaneously, without the need to build an outlier report for each one.
- Monitoring failed image uploads for every user of an application (not total failed uploads across all users).
If you have used the outlier operator, it is easy to create a multidimensional outlier operation. Just add by <dimension> to the end of the query.
For example, the following example query will determine many time series, one per each _sourceHost:
_sourceCategory=Apache/Access
| timeslice 1m
| count by _timeslice,_sourceHost
| outlier _count by _sourceHost
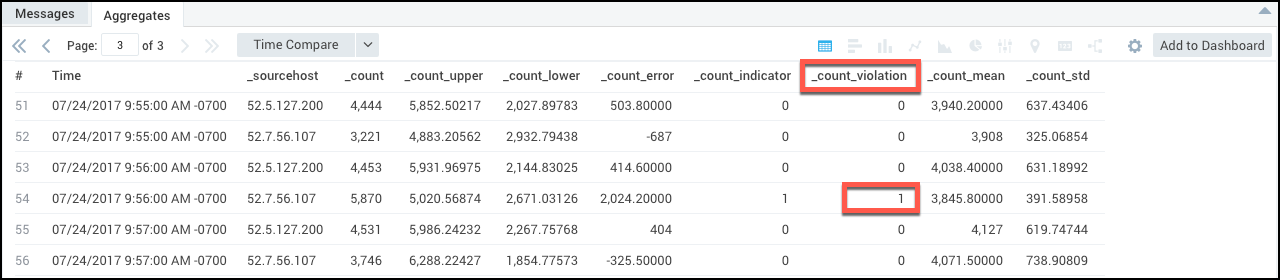
You can display the raw results of a multidimensional time series in a table chart, but currently other chart options are not available.
In the following table chart, a value of 1 in the _count_violation column indicates that the data point corresponding to that timeslice is
an outlier.
Alerts Based on Multidimensional Outlier Results
To create an alert based on the multi-series outlier table above, extract _count_violation.
This way, you will not need to build an alert for each series of data (each _sourceHost in the previous example), and you can automatically monitor a dynamic series for deviating behavior.
The following example query allows you to monitor when application users experience failures. It monitors all user accounts by unique user ID, and applies outlier to the amount of “fail” messages that occur across every user account:
_sourceCategory=O365*
| parse "\"UserId\":\"*\"" as user_id
| parse "\"ResultStatus\":\"*\"" as result
| where result = "fail"
| timeslice 30m
| count by user_id, _timeslice
| outlier _count by user_id
| fields _timeslice,user_id, _count_violation
| transpose row _timeslice column user_id
Once you have run the query, you can click Save As to create a Scheduled Search and configure it to send an alert when any user account experiences an unusual amount of failures, or other event you want to monitor each series of data for.
To visualize your results, on the Search page, you can create a column chart, then change the stacking property to normal to display alerts by unique user_id (the multidimensional aspect).
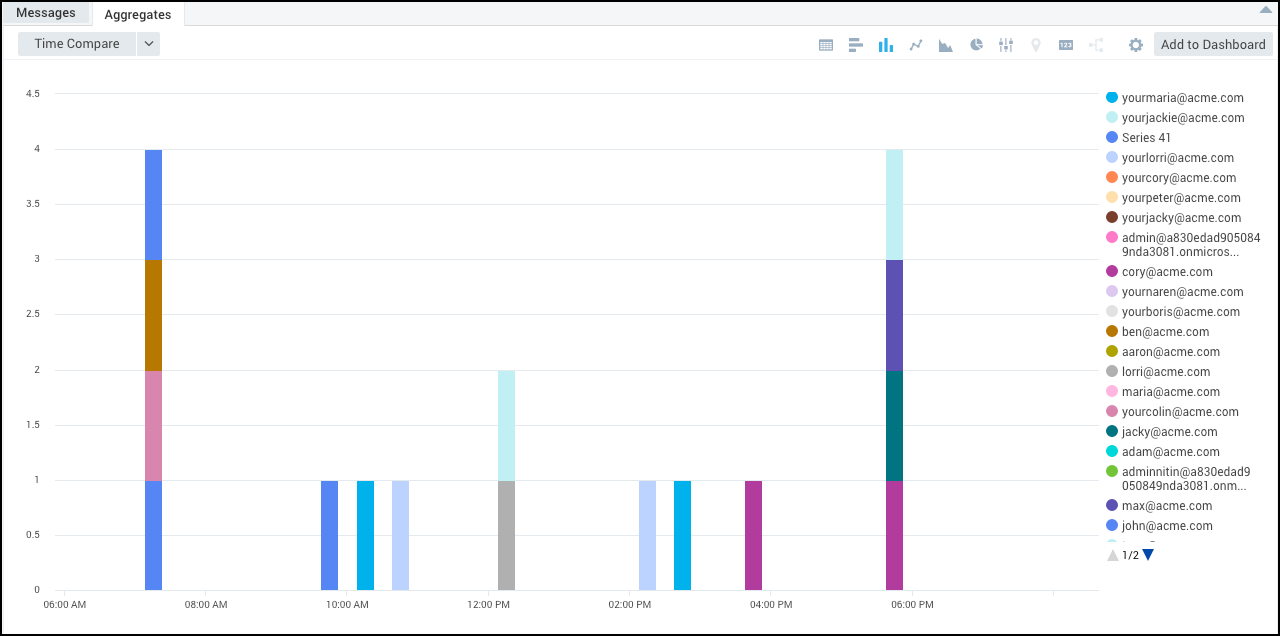
Chart Multidimensional Outlier Results
This section provides two examples of how to display multidimensional outlier results in charts.
Example 1: Outlier Distribution Across Time
In this example, we’ll extract _count_violation from the multi-series outlier table and display that. This allows you to display the distribution of outliers among various time-series.
error (_sourceCategory=Apache* or _sourceCategory=IIS*)
| timeslice 1m
| count by _timeslice, _sourceCategory
| outlier _count by _sourceCategory
| fields _timeslice,_sourceCategory, _count_violation
| transpose row _timeslice column _sourceCategory
When you select a line chart, this example will display something like the following:
Example 2: Outlier Ranking
This example query uses the _count_error (distance from the expected value for that timeslice) and the value of the standard deviation for the baseline, then determines how many standard deviation a data point is from its expected value.
This way, you can display outliers visually in terms of deviation from the expected value.
_sourceCategory=Apache*
| timeslice 30m
| count  by _timeslice, status_code
| outlier _count by status_code
| where _count_std >0
| if(_count_violation=1,abs(_count_error)/_count_std, 0) as deviation
| fields _timeslice, status_code, deviation
| transpose row _timeslice column status_code
When you select a line chart, this example will display something like the following:
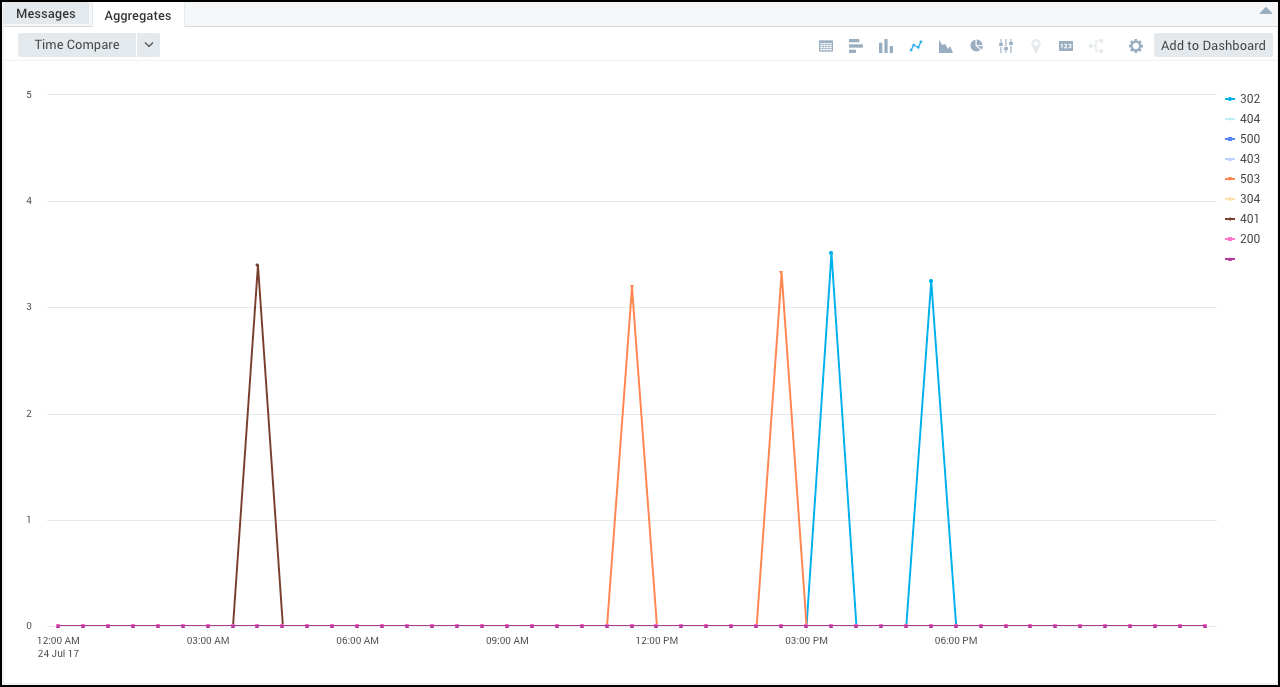
In the line chart, you can see which series is producing the most “deviating” outliers.
This approach effectively displays the severity of the outlier, because the spikes represent the magnitude (how many standard deviations the value is from the mean) in one time-series compared to another time-series.