transpose Search Operator
Similar to a Pivot Table in Excel, the transpose operator allows you to take a list and turn it into a table in the Aggregates tab, as shown by the examples below. You can define what data makes the rows and columns.
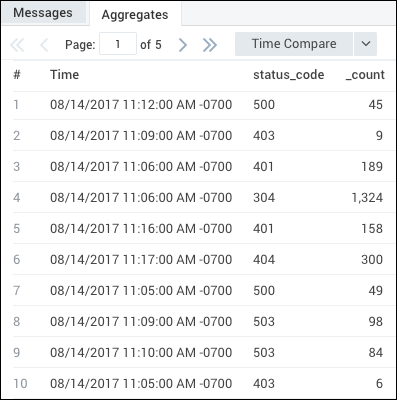
Without transpose, the following query renders a factual, but not useful table below:
_sourceCategory=Labs/Apache/Access
| timeslice 5m
| count by _timeslice, status_code
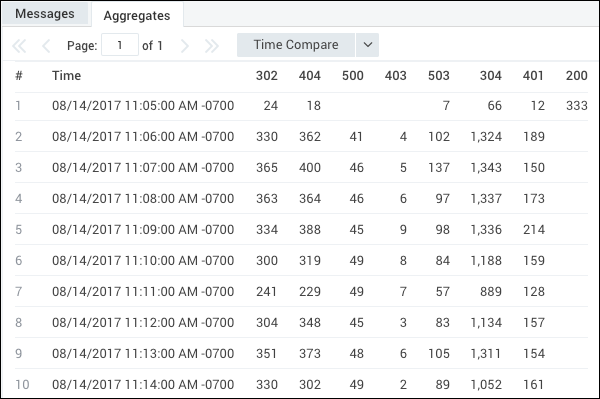
With transpose, you can use your query to define your rows as the timeslice and the columns as the status code:
_sourceCategory=Labs/Apache/Access
| timeslice 5m
| count by _timeslice, status_code
| transpose row _timeslice column status_code
To make this information present as a table, transpose dynamically creates columns for aggregate search results. This allows you to change the output of a query by turning search results into fields, so you can design queries without first knowing the output schema. In this way, transpose formats the data correctly for charts in Dashboard Panels.
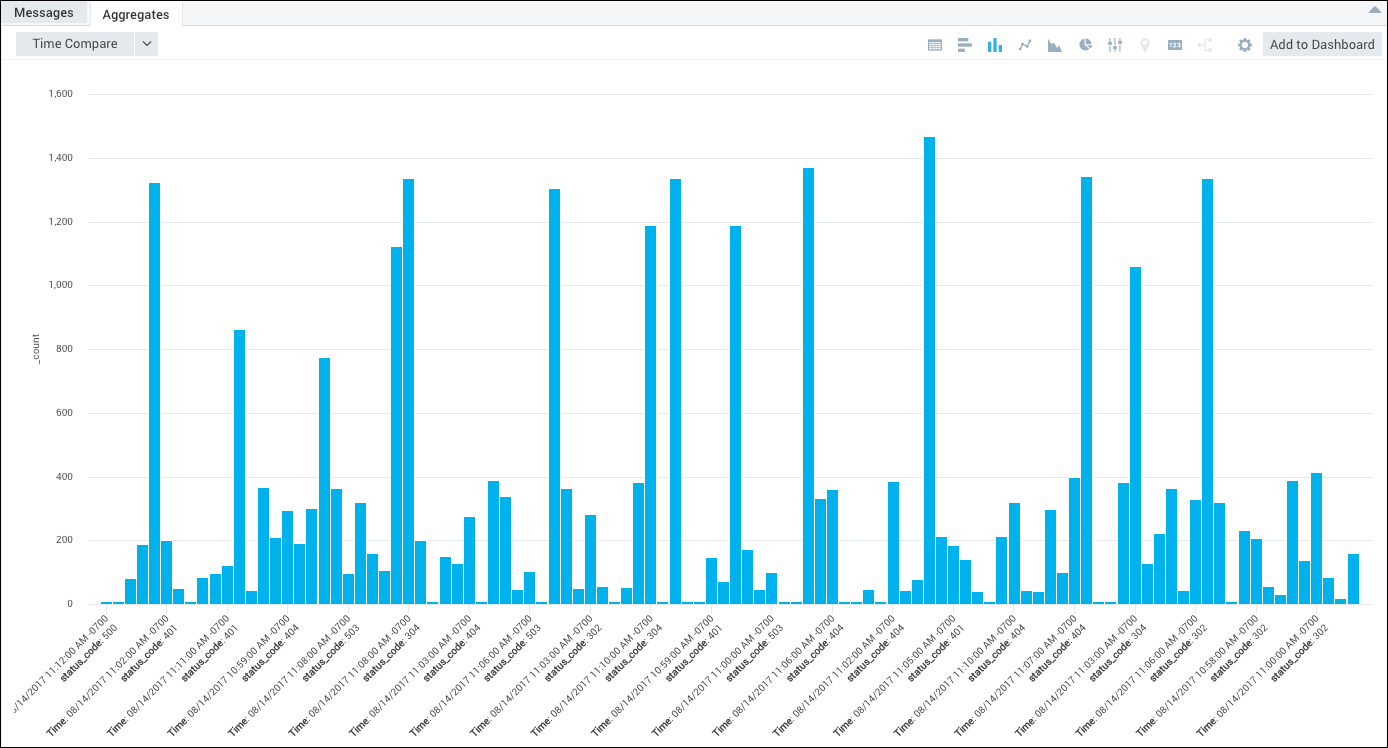
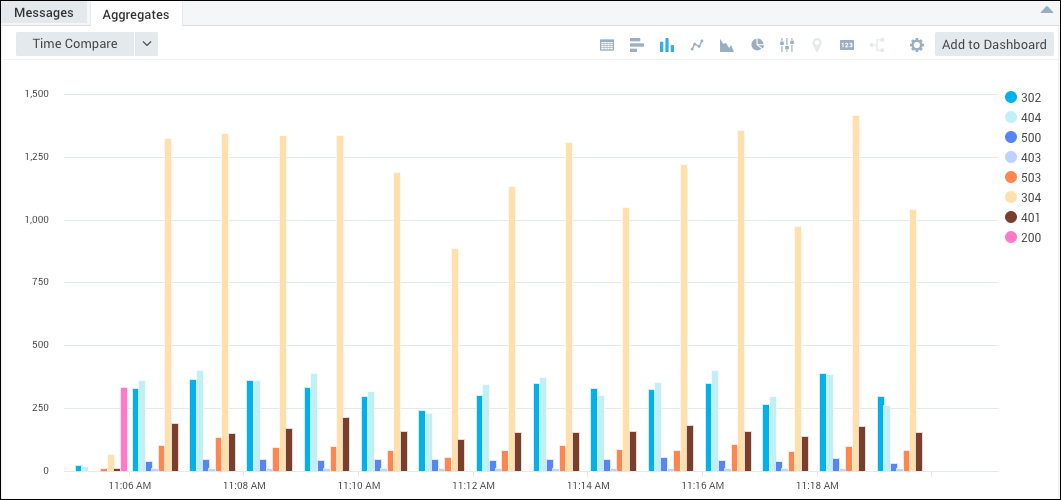
For example, the screenshots below represent the same data from the same time range, but the second screenshot is generated from a query using the transpose operator.
Without transpose, the data is represented according to timeslice, but not aggregated by status code:
With transpose, the results display in an easy-to-read manner status codes by timeslice:
Syntax
transpose row [<row fields>] column [<column fields>] as [<output fields>]
transpose row [<row fields>] column [<column fields>]
Results can be influenced in three ways:
- By using a comma-separated list of variable names (such as "a, b"), only the specified output fields appear in the output table.
- By using a comma-separated list of variable names, followed by a comma and a star (such as "a, b,*"), the specified output fields appear in the output table, followed by dynamic fields.
- By including a single star (
*) all dynamic fields appear in the output. Use this option when you want to add all your fields to the resulting table. - To reference the fields after 'transpose' you need to specify the field names as output fields.
As a reminder, if a field name contains a special character (such as -) the character must be quoted in %"", as in %"test-zz-1". Because column names computed from data tend to include special characters, this is especially important to keep in mind when using a transpose operator.
Rules
- Transpose is not supported with the Join operator.
- Transpose supports a maximum of 300 dynamic fields (columns to be created).
- Fields are returned alphabetically.
Example
Viewing errors by module
Let's say that errors are logged by module; we'd like to view errors by each module's name. Running a query similar to:
error | parse "module=*]" asmodule| timeslice 1m
| count as value by _timeslice, module
| transpose row _timeslice column module as [moduleName1, moduleName2, ...]
will produce results with each module represented with a distinct color, similar to:
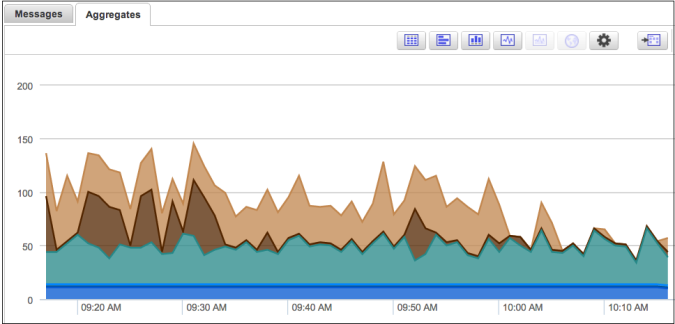
Try changing the Stacking setting (under Change Properties) to Normal to see how graphs are affected by this option. For more information, see Chart Search Results.
View successful logins by user
Because you can use the transpose operator without prior knowledge of the fields it will generate, you can view logins by users and organization. Running a query similar to:
_sourceCategory=service
| parse "Successful login for user '*', organization: '*'" as user, org_id
| timeslice 1d
| count _timeslice, user
| transpose row _timeslice column user
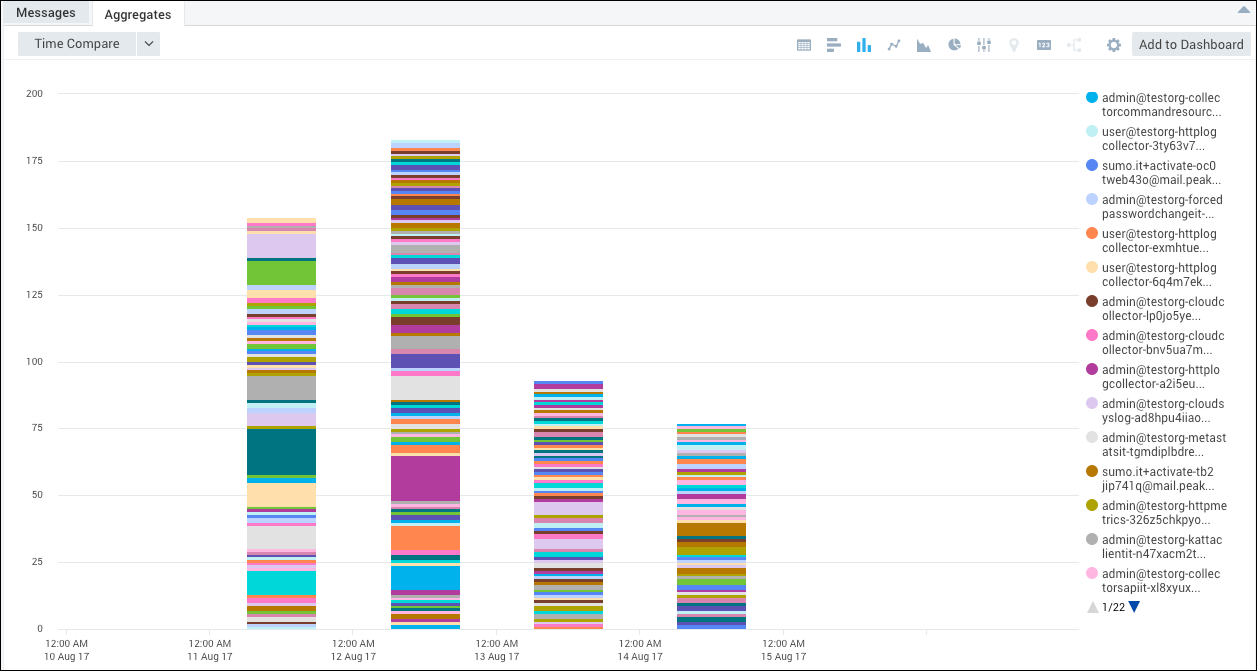
will produce a stacked graph similar to:
View web server status codes
Let's return to the query with the Apache web server status codes, but status_code is a pre-parsed field.
_sourceCategory=Apache/Access
| timeslice 1m
| count by _timeslice, status_code
| transpose row _timeslice column status_code
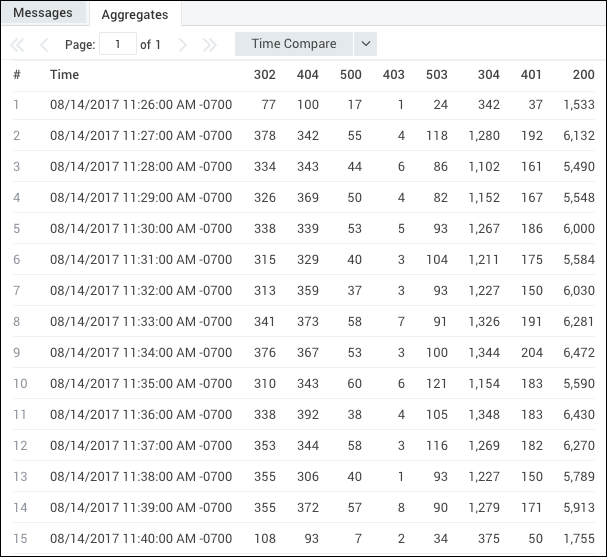
Results are initially returned in the Aggregates tab in the form that we want.
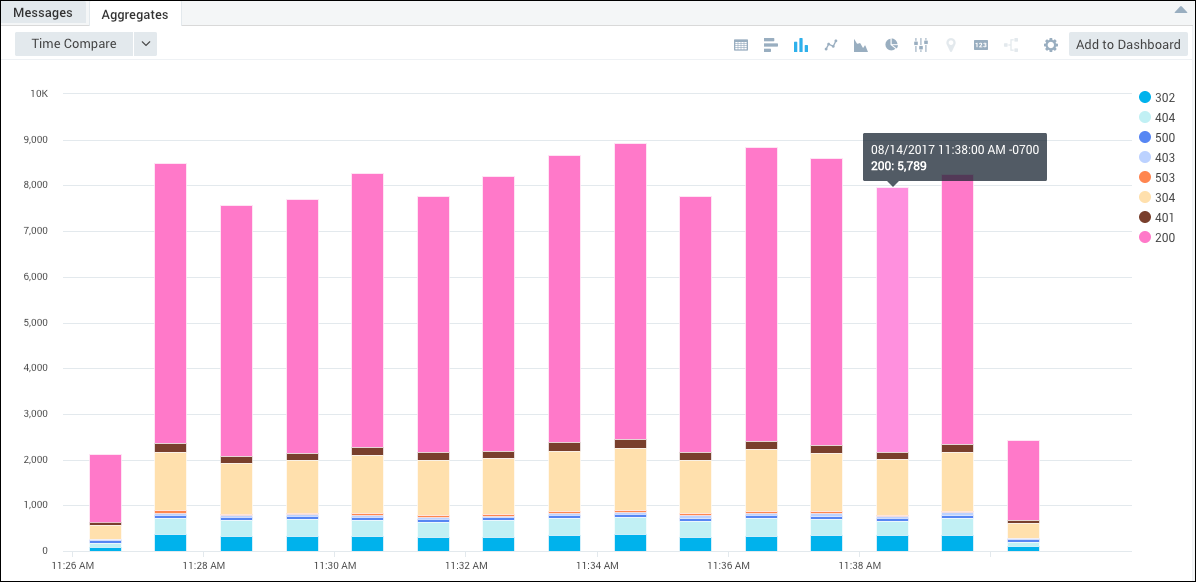
Then you can select the Column chart button, and under Change Properties, set the Stacking setting to Normal to create a stacked column chart.
For information on handling null fields, see isNull operator.
Order transposed results
Continuing from the previous example, you can influence the results by specifying the variable names, see Syntax for details. You need to know the variable names returned from the transpose operation if you want to order them. In this example, if you know you will get 200, 400, and 500 status codes returned in your results you'd order them by specifying the variable names in the order you want, like this:
_sourceCategory=Apache/Access
| timeslice 1m
| count by _timeslice, status_code
| transpose row _timeslice column status_code as %"200", %"400", %"500"