Collect Logs from Oracle Cloud Infrastructure
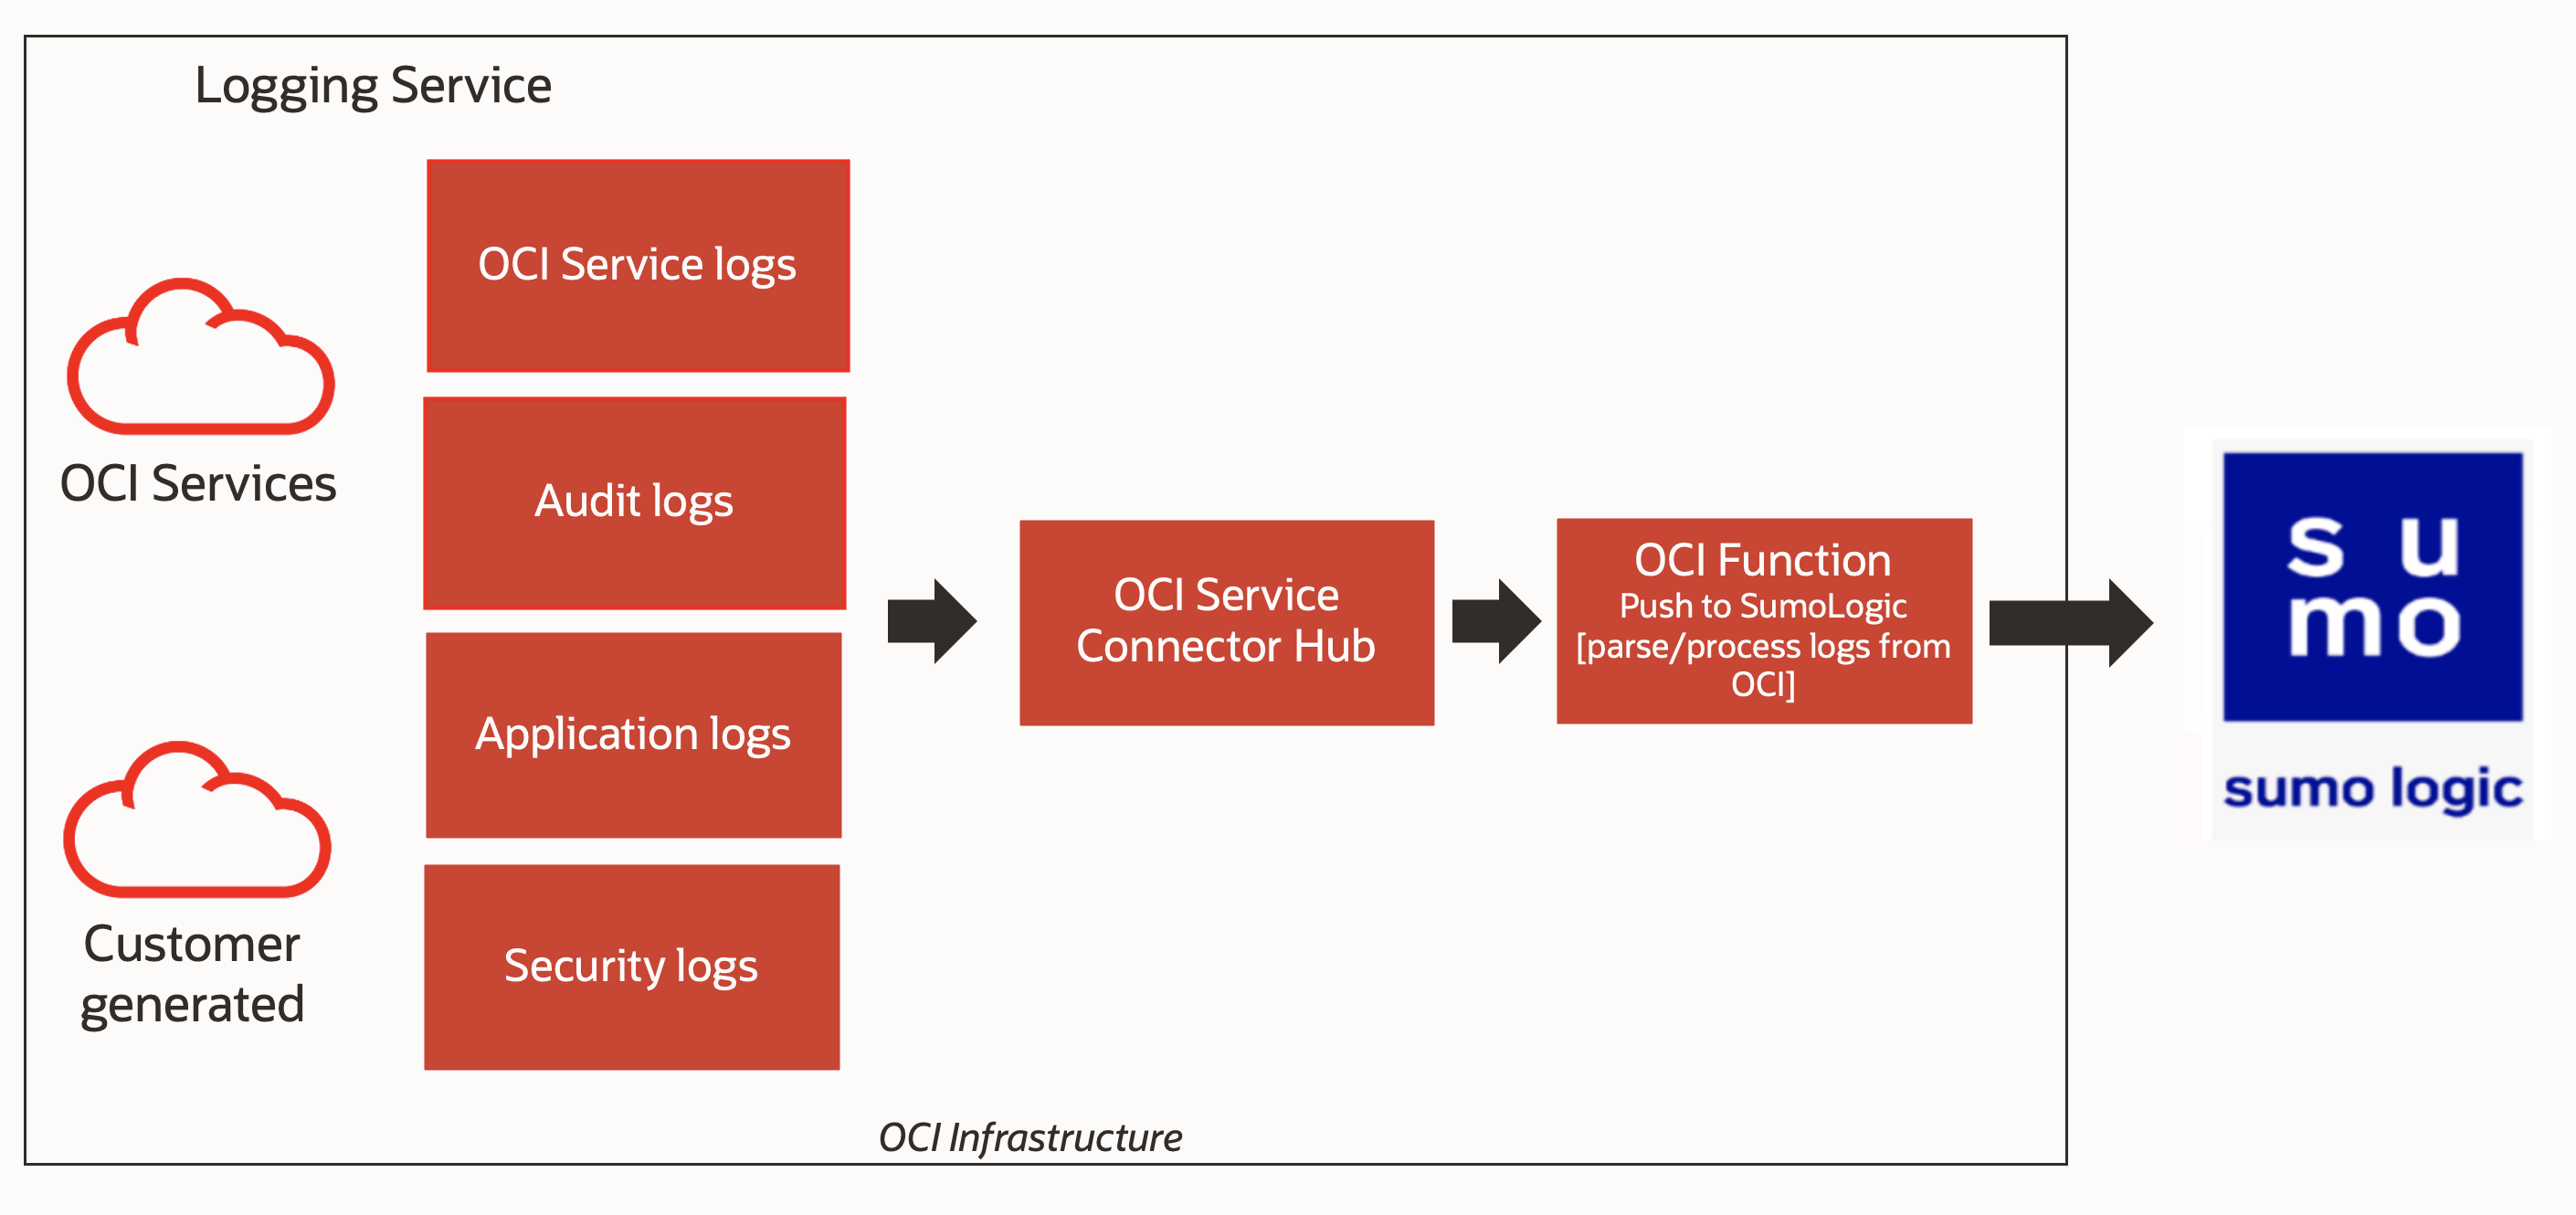
Oracle Cloud supports the export of Oracle Cloud Infrastructure (OCI) Service logs, Audit logs, Application logs and Security logs to Sumo Logic. The solution architecture at a high level is as shown below:
Configure a Hosted Collector and HTTP Source
This section shows you how to set up a Hosted Collector and specify a Sumo Logic Source.
- Configure a Hosted Collector or skip to the next step if you are using an existing hosted collector. For instructions, see Configure a Hosted Collector.
- Configure an HTTP Logs and Metrics Source under the hosted collector. For instructions, see HTTP Logs and Metrics Source. Make a note of the HTTP Source URL.
Configure the logs you want to capture in OCI
You can set up any logs as input for the Service Connector Hub and ingest them into Sumo Logic. For this tutorial, we will capture OCI-generated logs for write-events to an arbitrary bucket of your choice.
- In the Oracle Cloud Console, click the navigation menu, select Logging, and then select Log Groups.
- To create a log group, click Create Log Group.
- Select your compartment, add LogGroupForBucketActivity for the name and add a description. Click Create.
- Select Logs from the Logging menu. You will see a screen similar to below.
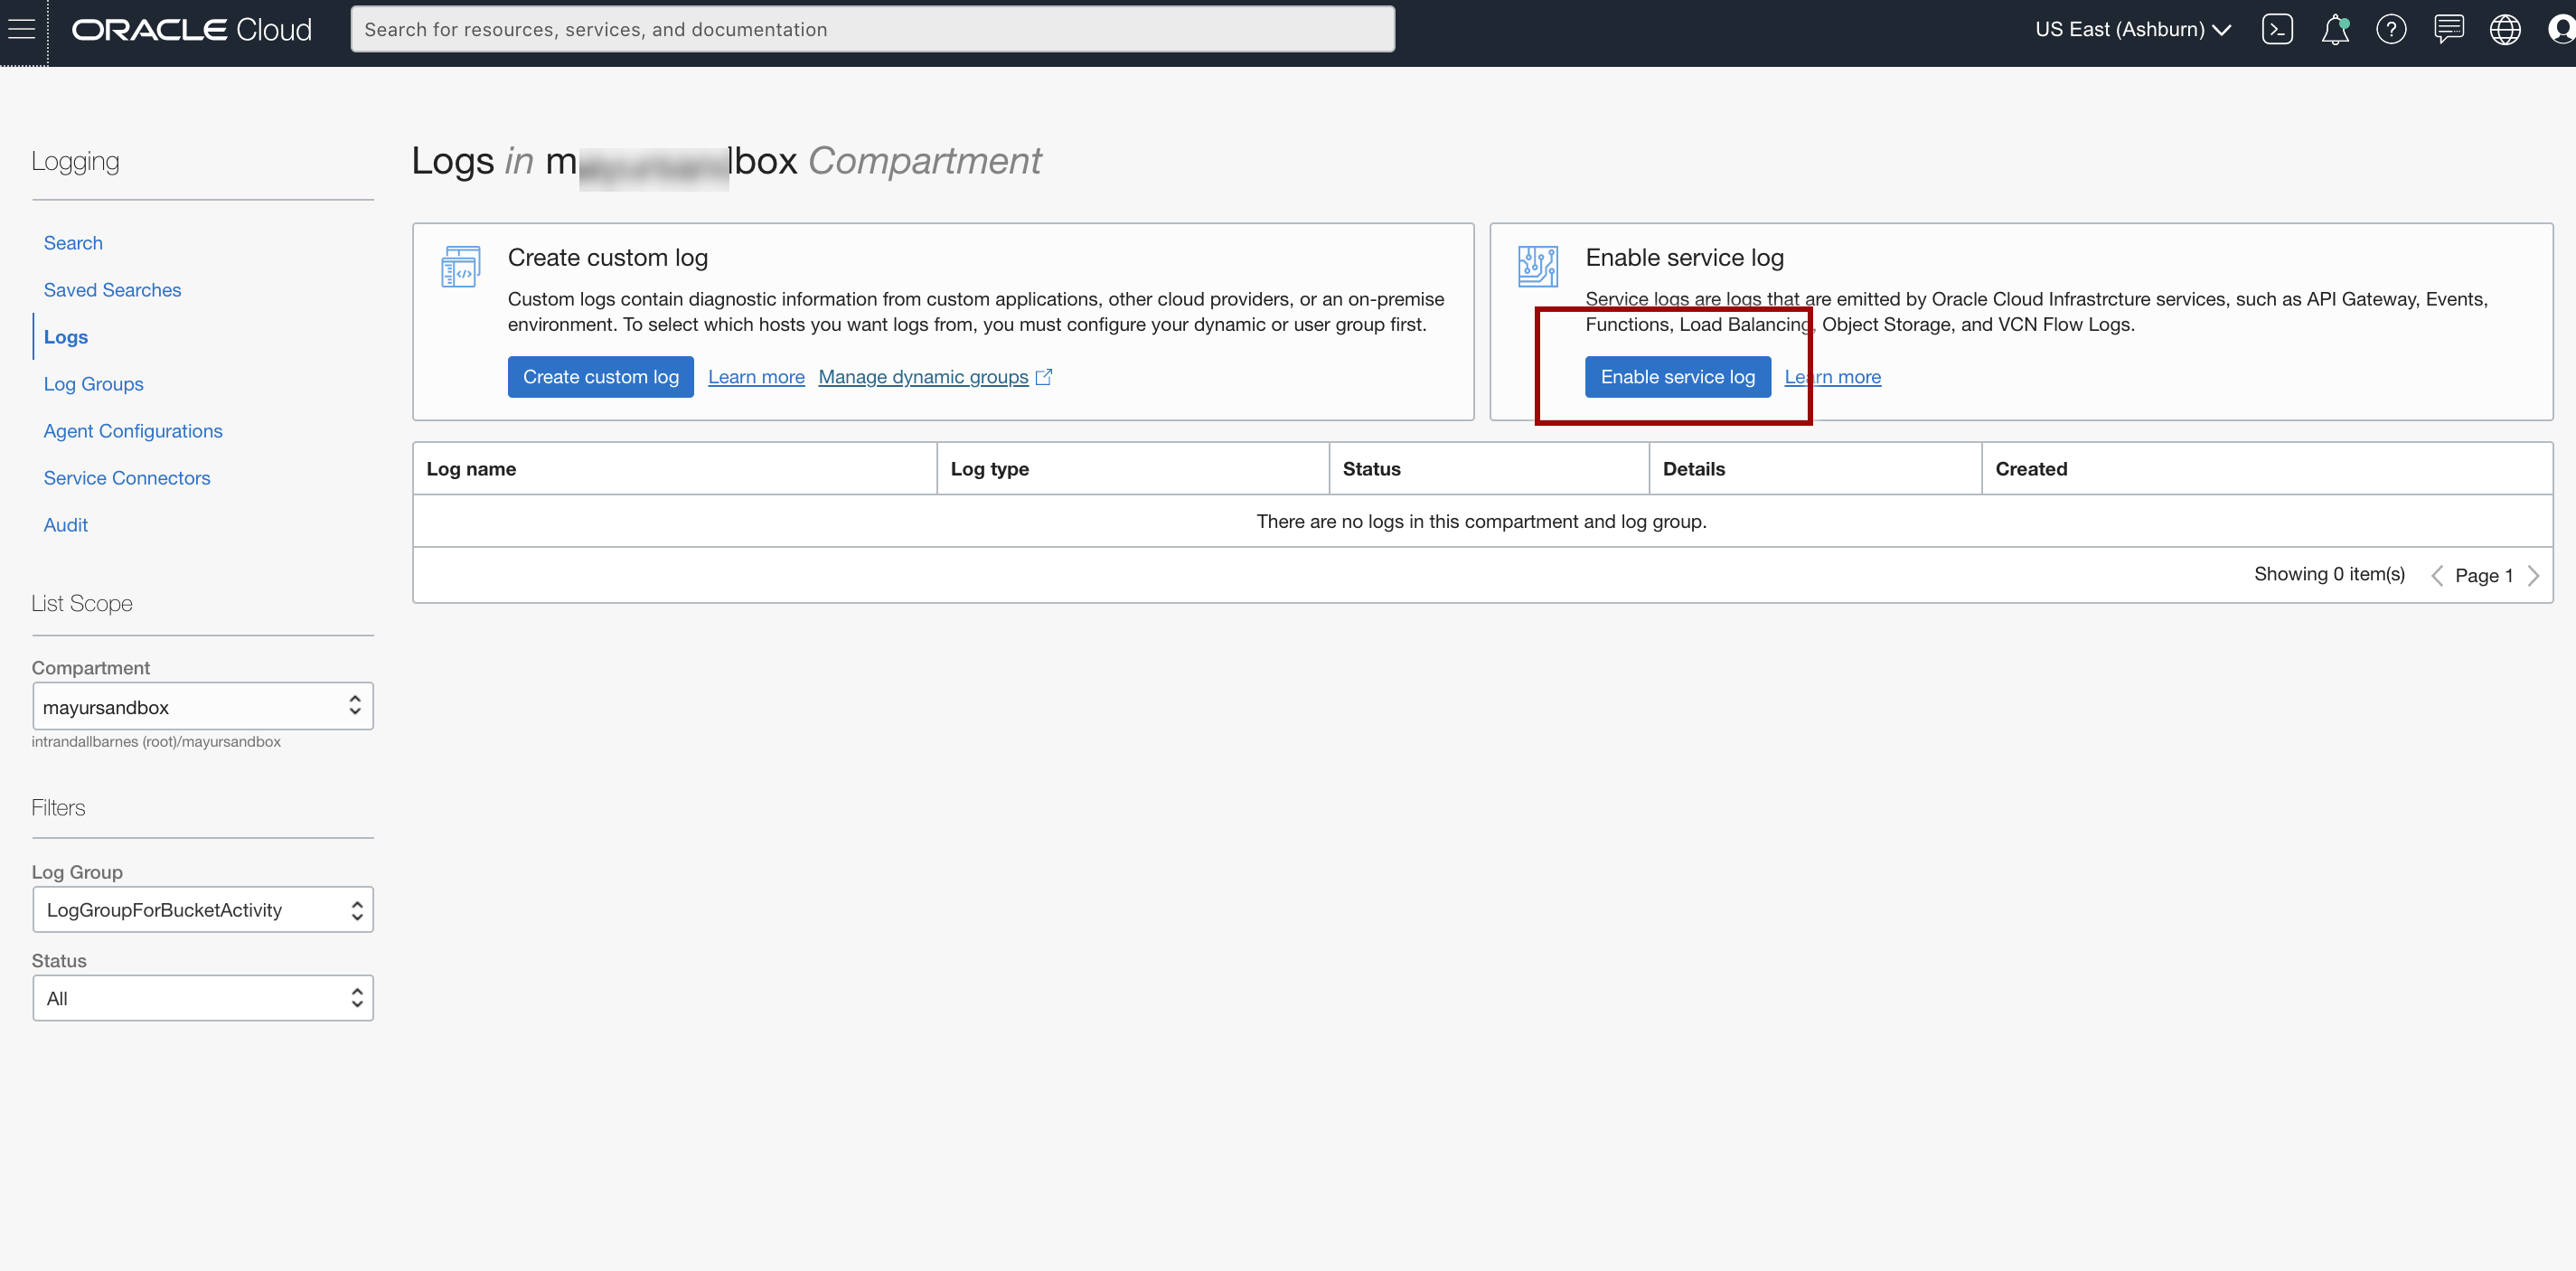
- Click Enable service log and enter the following information:
- Service. Select Object Storage.
- Resource. Choose an arbitrary bucket (for example, BucketForSumoLogic) that you would like observed with the logs.
- Log Category. Select Write Access Events.
- Log Name. Enter a name for your log, for example, logForBucketActivity.
- Log Group. Select the LogGroupForBucketActivity log group for the log that you just created in the previous step.
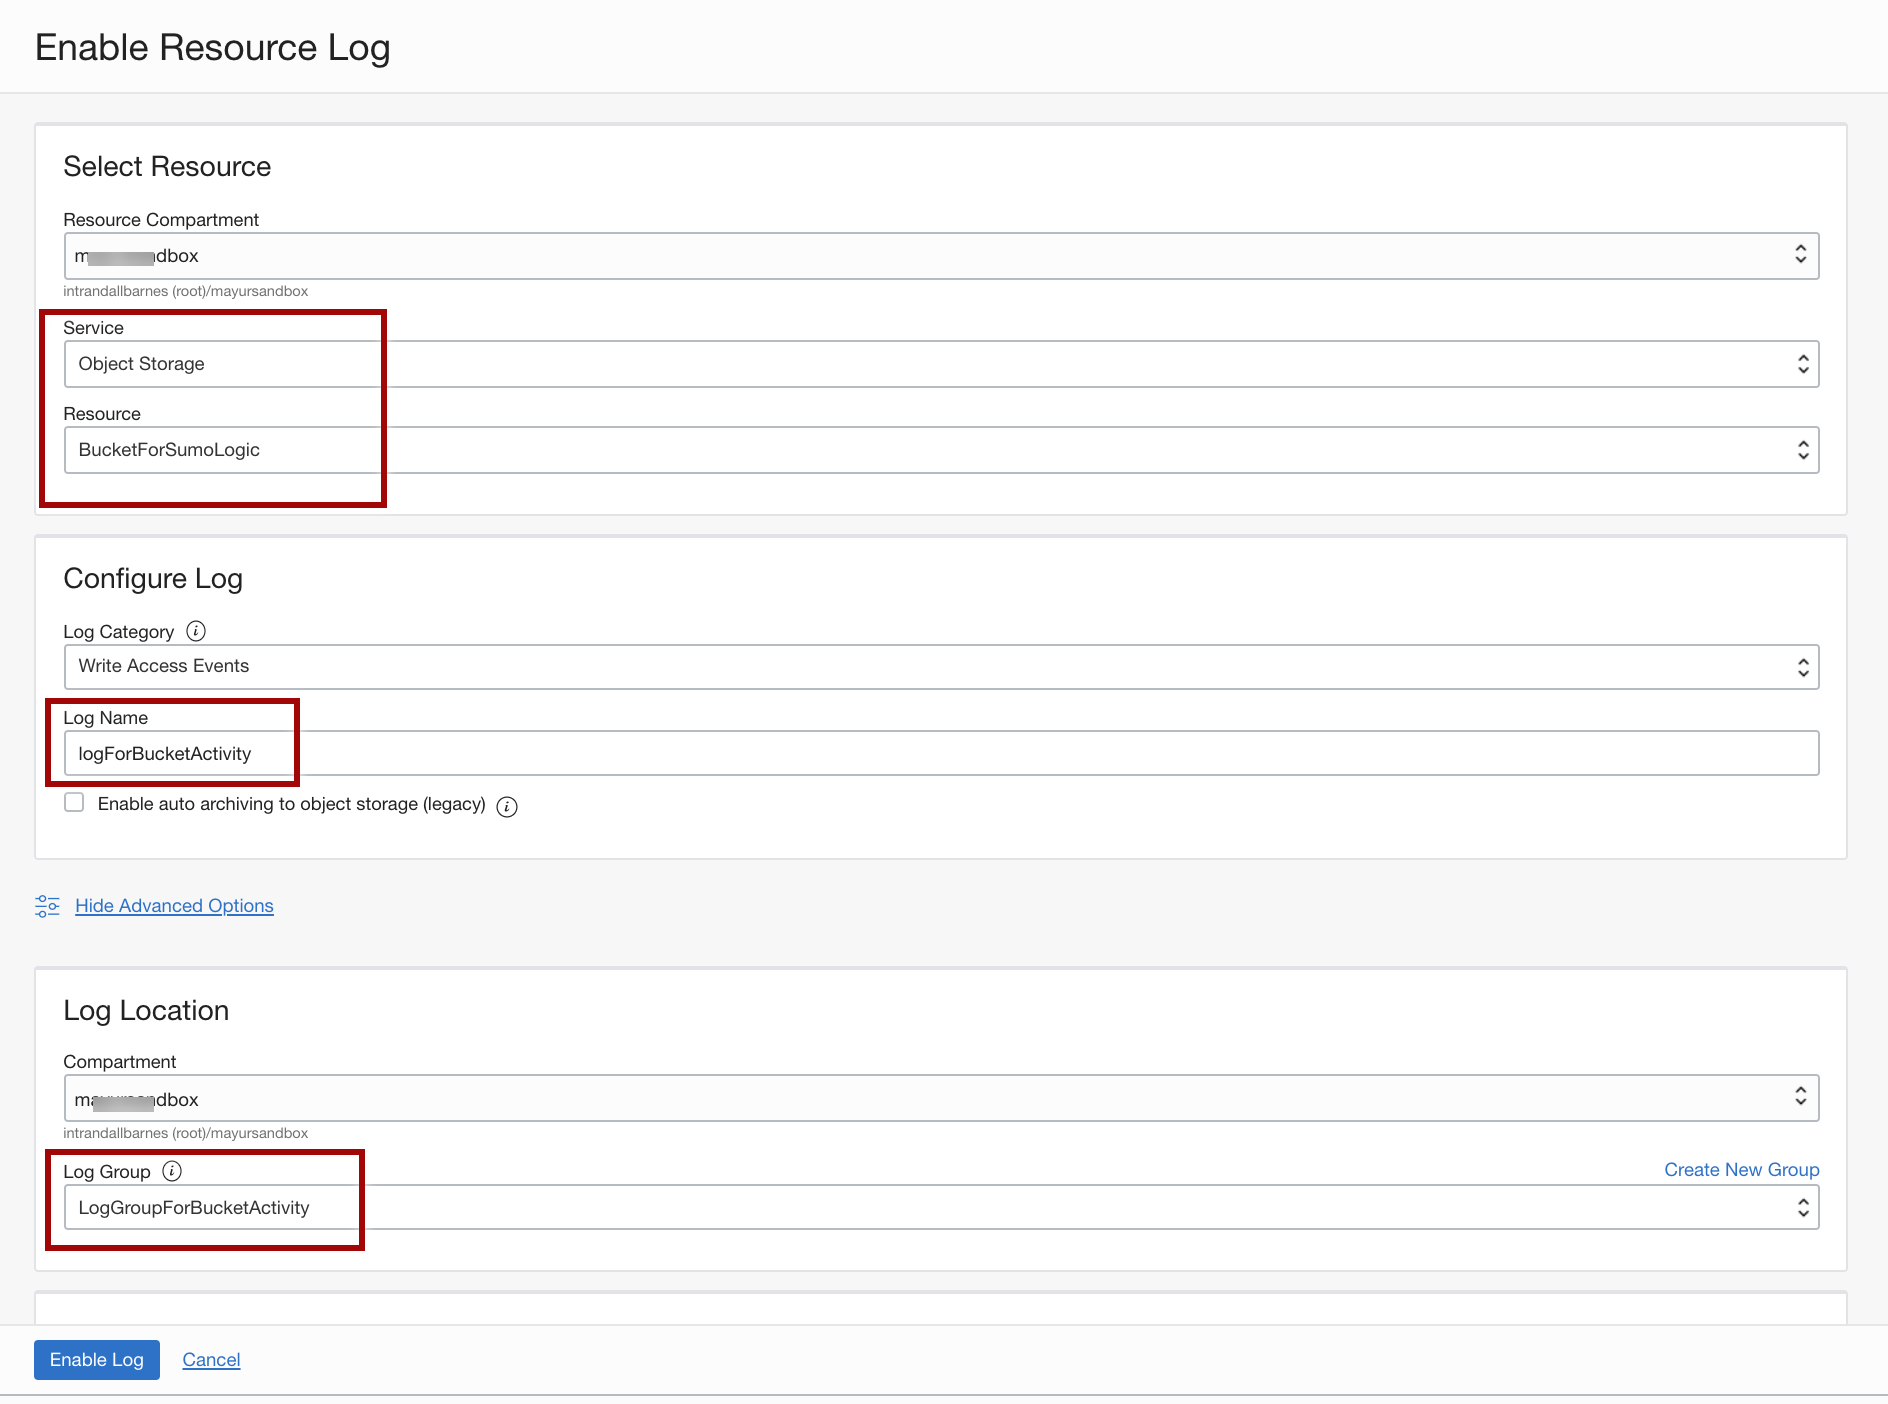
- When you're done, click Enable Log.
Now, every time a object is uploaded to the BucketForSumoLogic bucket, a log entry will be added to the logForBucketActivity log.
Configure an Oracle Function for sending logs to Sumo Logic
- In the Oracle Cloud Console, click the navigation menu and select Solution and Platform. Go to the Developer Services menu and select Functions.
- Click Create Application and enter a name, for example, sumologicFnApp.
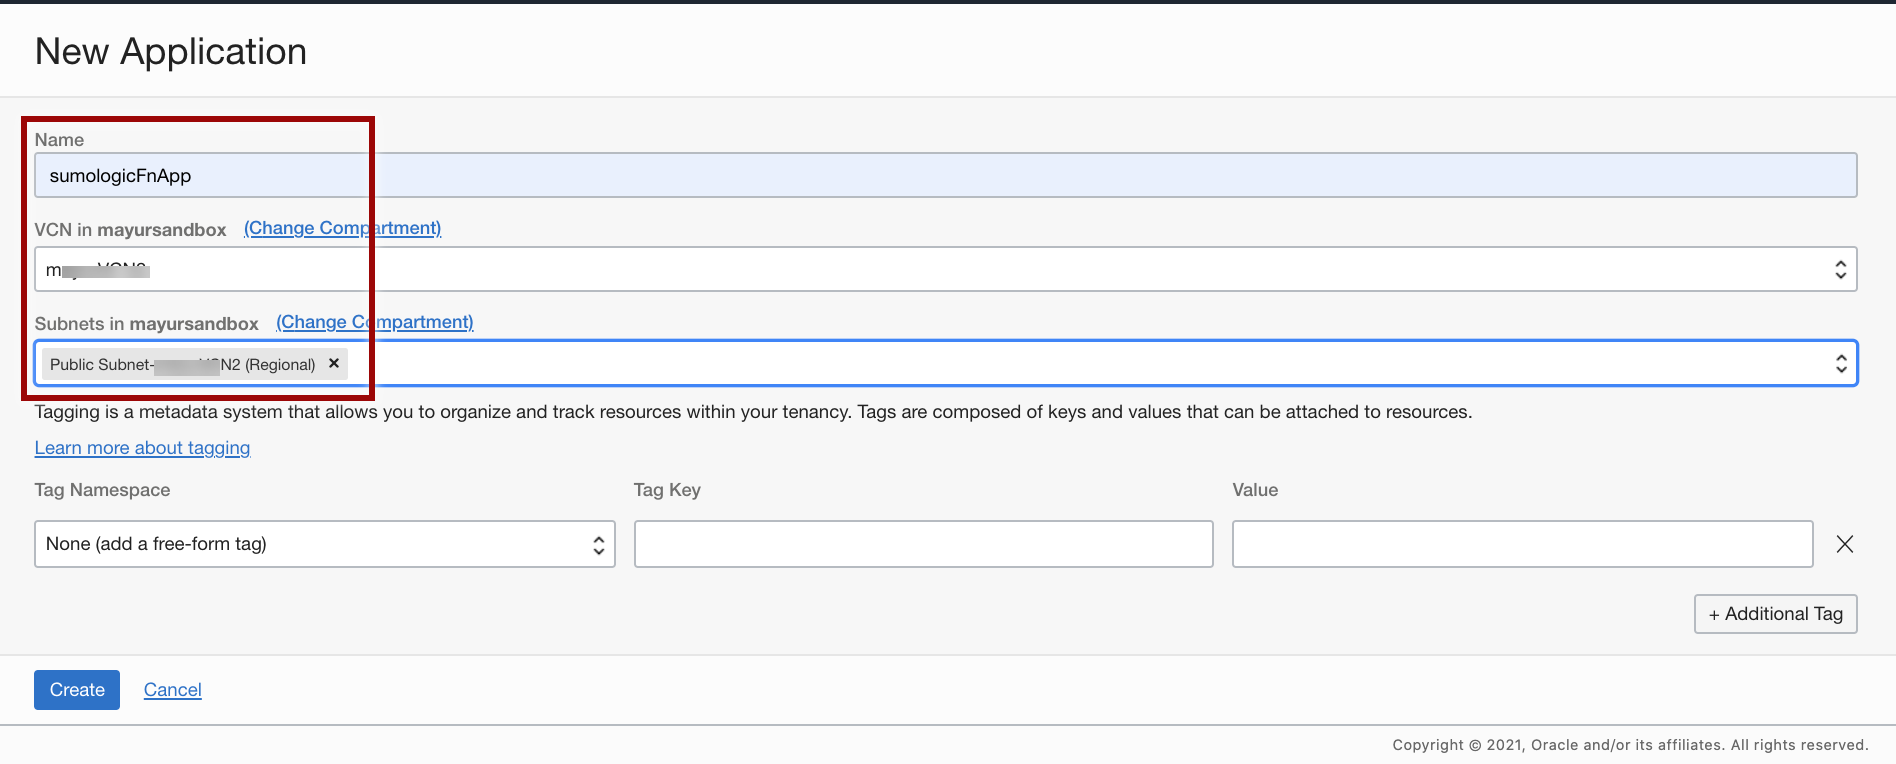
- Once you create the application, click your application name, go to the Resources menu, and select Getting Started.
- Launch Cloud Shell.
- Use the context for your region.
fn list context
fn use context us-ashburn-1 - Update the context with the function’s compartment ID.
fn update context oracle.compartment-id <compartment-id> - Update the context with the location of the registry you want to use. Replace
iadwith the three-digit region code for your region.fn update context registry iad.ocir.io/<tenancy_name>/[YOUR-OCIR-REPO] - Assuming you have created the Auth Token already, log in to the registry using the Auth Token as your password. Replace
iadwith the three-digit region code for your region.docker login iad.ocir.io- You are prompted for the following information:
- Username. <tenancyname>/<username>
- If you are using Oracle Identity Cloud Service, your username is <tenancyname>/oracleidentitycloudservice/<username>.
- Password. Create a password.
- Username. <tenancyname>/<username>
- Verify your setup by listing applications in the compartment.
fn list apps
- You are prompted for the following information:
- Generate a ‘hello-world’ boilerplate function.
fn init --runtime python sumologicfnnoteThe
fn initcommand will generate a folder called sumologicfn with three files inside: func.py, func.yaml, and requirements.txt. - Open func.py and replace the content of the file with the following code.
func.py code
#
# oci-sumologic 1.0
#
# Copyright (c) 2022, Oracle and/or its affiliates. All rights reserved.
# Licensed under the Universal Permissive License v 1.0 as shown at https://oss.oracle.com/licenses/upl.

import io
import json
import logging
import os
import base64
import requests
from fdk import response


# Sumologic environment variables (set in OCI Application Configuration)
sumologic_endpoint = os.getenv('SUMOLOGIC_ENDPOINT', 'not-configured')
max_records_per_post = int(os.getenv('MAX_RECORDS_PER_POST', '1000'))

# Enable if the function will be processing events or logs passing through OCI Streaming
is_oci_streaming_conversion_enabled = eval(os.getenv('OCI_STREAMING_CONVERSION_ENABLED', "True"))

# Set all registered loggers to the configured log_level
logging_level = os.getenv('LOGGING_LEVEL', 'INFO')
loggers = [logging.getLogger()] + [logging.getLogger(name) for name in logging.root.manager.loggerDict]
[logger.setLevel(logging.getLevelName(logging_level)) for logger in loggers]

# --------------------------------------------
# Functions
# --------------------------------------------


def handler(ctx, data: io.BytesIO = None):
    """
    OCI Function Entrypoint
    :param ctx: OCI Function context
    :param data: message payload bytes object
    :return: None
    """

    try:

        log_body = data.getvalue()
        banner = "{} / event payload bytes: {} / batch size: {} / logging level: {}"
        logging.info(banner.format(ctx.FnName(), len(log_body), max_records_per_post, logging_level))

        if is_oci_streaming_conversion_enabled:
            log_body = convert_oci_streaming_format(log_body)

        records_posted = post_to_sumologic(log_body)
        logging.info(f'records posted / {records_posted}')

        return response.Response(ctx, response_data=json.dumps({"status": "Success", "records_posted": records_posted}),
                                 headers={"Content-Type": "application/json"})

    except Exception as err:
        logging.error("Error in handler: {}".format(str(err)))
        raise err


def post_to_sumologic(body_bytes: bytes):
    """
    Sends each event to Sumologic
    """

    session = requests.Session()
    records_posted = 0

    try:
        adapter = requests.adapters.HTTPAdapter(pool_connections=10, pool_maxsize=10)
        session.mount('https://', adapter)

        http_headers = {'Content-type': 'application/json'}

        event_list = json.loads(body_bytes)
        if not isinstance(event_list, list):
            event_list = [event_list]

        #  divide the incoming payload into batches

        batch = []
        batches = [batch]

        for event in event_list:
            batch.append(event)
            if len(batch) >= max_records_per_post:
                batch = []
                batches.append(batch)

        for batch in batches:
            if len(batch) == 0:
                continue

            post_response = session.post(sumologic_endpoint, data=serialize(batch), headers=http_headers)
            if post_response.status_code != 200:
                raise Exception('error posting to API endpoint', post_response.text, post_response.reason)

            records_posted += len(batch)

    finally:
        session.close()

    return records_posted


def serialize(batch):
    """
    Serialize the event payload per Sumo Logic HTTP Source contract
    """

    converted = ''
    for record in batch:
        json_string = json.dumps(record)
        converted += json_string + '\n'
    return converted


def convert_oci_streaming_format(body_bytes: bytes):
    """
    This function detects if the body is OCI Streaming format and converts it as needed to remove OCI
    Streaming preamble / wrapper JSON if that is the case.  Otherwise, it returns the original argument value.

    :param body_bytes: fn message body
    :return: converted / original payload
    """

    converted = list()
    event_list = json.loads(body_bytes)

    # The presence of 'stream', 'partition' and 'value' attributes per message indicate
    # that the list of events are in Streaming format.

    for event in event_list:
        stream = event.get('stream')
        partition = event.get('partition')
        value = event.get('value')

        if stream and partition and value:
            bytes_value = base64.b64decode(value)
            utf8_value = bytes_value.decode('utf-8')
            converted.append(json.loads(utf8_value))

        else:
            logging.debug('OCI Streaming format not detected')
            return body_bytes

    converted_bytes = bytes(json.dumps(converted), 'ascii')
    logging.debug('OCI Streaming format detected, conversion complete')

    return converted_bytes


def local_test_mode(filename):
    """
    Test routine
    """

    logging.info("testing {}".format(filename))

    with open(filename, 'r') as f:
        data = json.load(f)
        converted_bytes = bytes(json.dumps(data), 'ascii')
        records_posted = post_to_sumologic(body_bytes=converted_bytes)
        logging.info(f'records posted / {records_posted}')


"""
Local Testing
"""

if __name__ == "__main__":
    # local_test_mode('test_data/test.json')
    local_test_mode('test_data/test-list.json')
For information about the format of the logs generated by the Oracle Cloud Infrastructure Logging service, see Logging Format Overview.
- Open func.yaml and replace the content of the file with the following code.
func.yaml code
schema_version: 20180708
name: oci-sumologic
version: 0.0.1
runtime: python
build_image: fnproject/python:3.9-dev
run_image: fnproject/python:3.9
entrypoint: /python/bin/fdk /function/func.py handler
memory: 256
timeout: 300
- Open requirements.txt and replace the content of the file with the following code.
requirements.txt code
oci==2.102.0
requests==2.31.0
fdk==0.1.50
- Deploy your function.
fn -v deploy --app sumologicFnApp --no-bump - Create the following environment variable configuration(s) in the Oracle console for the function.
- Endpoint
- Key. SUMOLOGIC_ENDPOINT.
- Value. <Sumologic_HTTP_Endpoint>.
- Default. not-configured.
- Purpose. HTTP endpoint to send logs to Sumo.
- Max Records (optional)
- Key. MAX_RECORDS_PER_POST.
- Default. 1000.
- Purpose. Maximum records to send for each POST. i.e, a batch size.
- Logging Level (optional)
- Key. LOGGING_LEVEL.
- Default. INFO.
- Purpose. Controls function logging outputs. Choices: INFO, WARN, CRITICAL, ERROR, DEBUG.
- Endpoint
Create a Service Connector for reading logs from Logging and Triggering the OCI Function
- In the Oracle Cloud Console, click the navigation menu, and select Observability & Management. Go to the Logging menu and select Connectors.
- Click Create Connector, and from the Source drop-down list, select Logging and from the Functions drop-down list, select Target.
- Under the Configure source connection section, select your Compartment Name, your LogGroupForBucketActivity for Log Group, and logForBucketActivity for Logs.
- If you want to use audit logs, click +Another log, choose your compartment and add _Audit for Log Group.
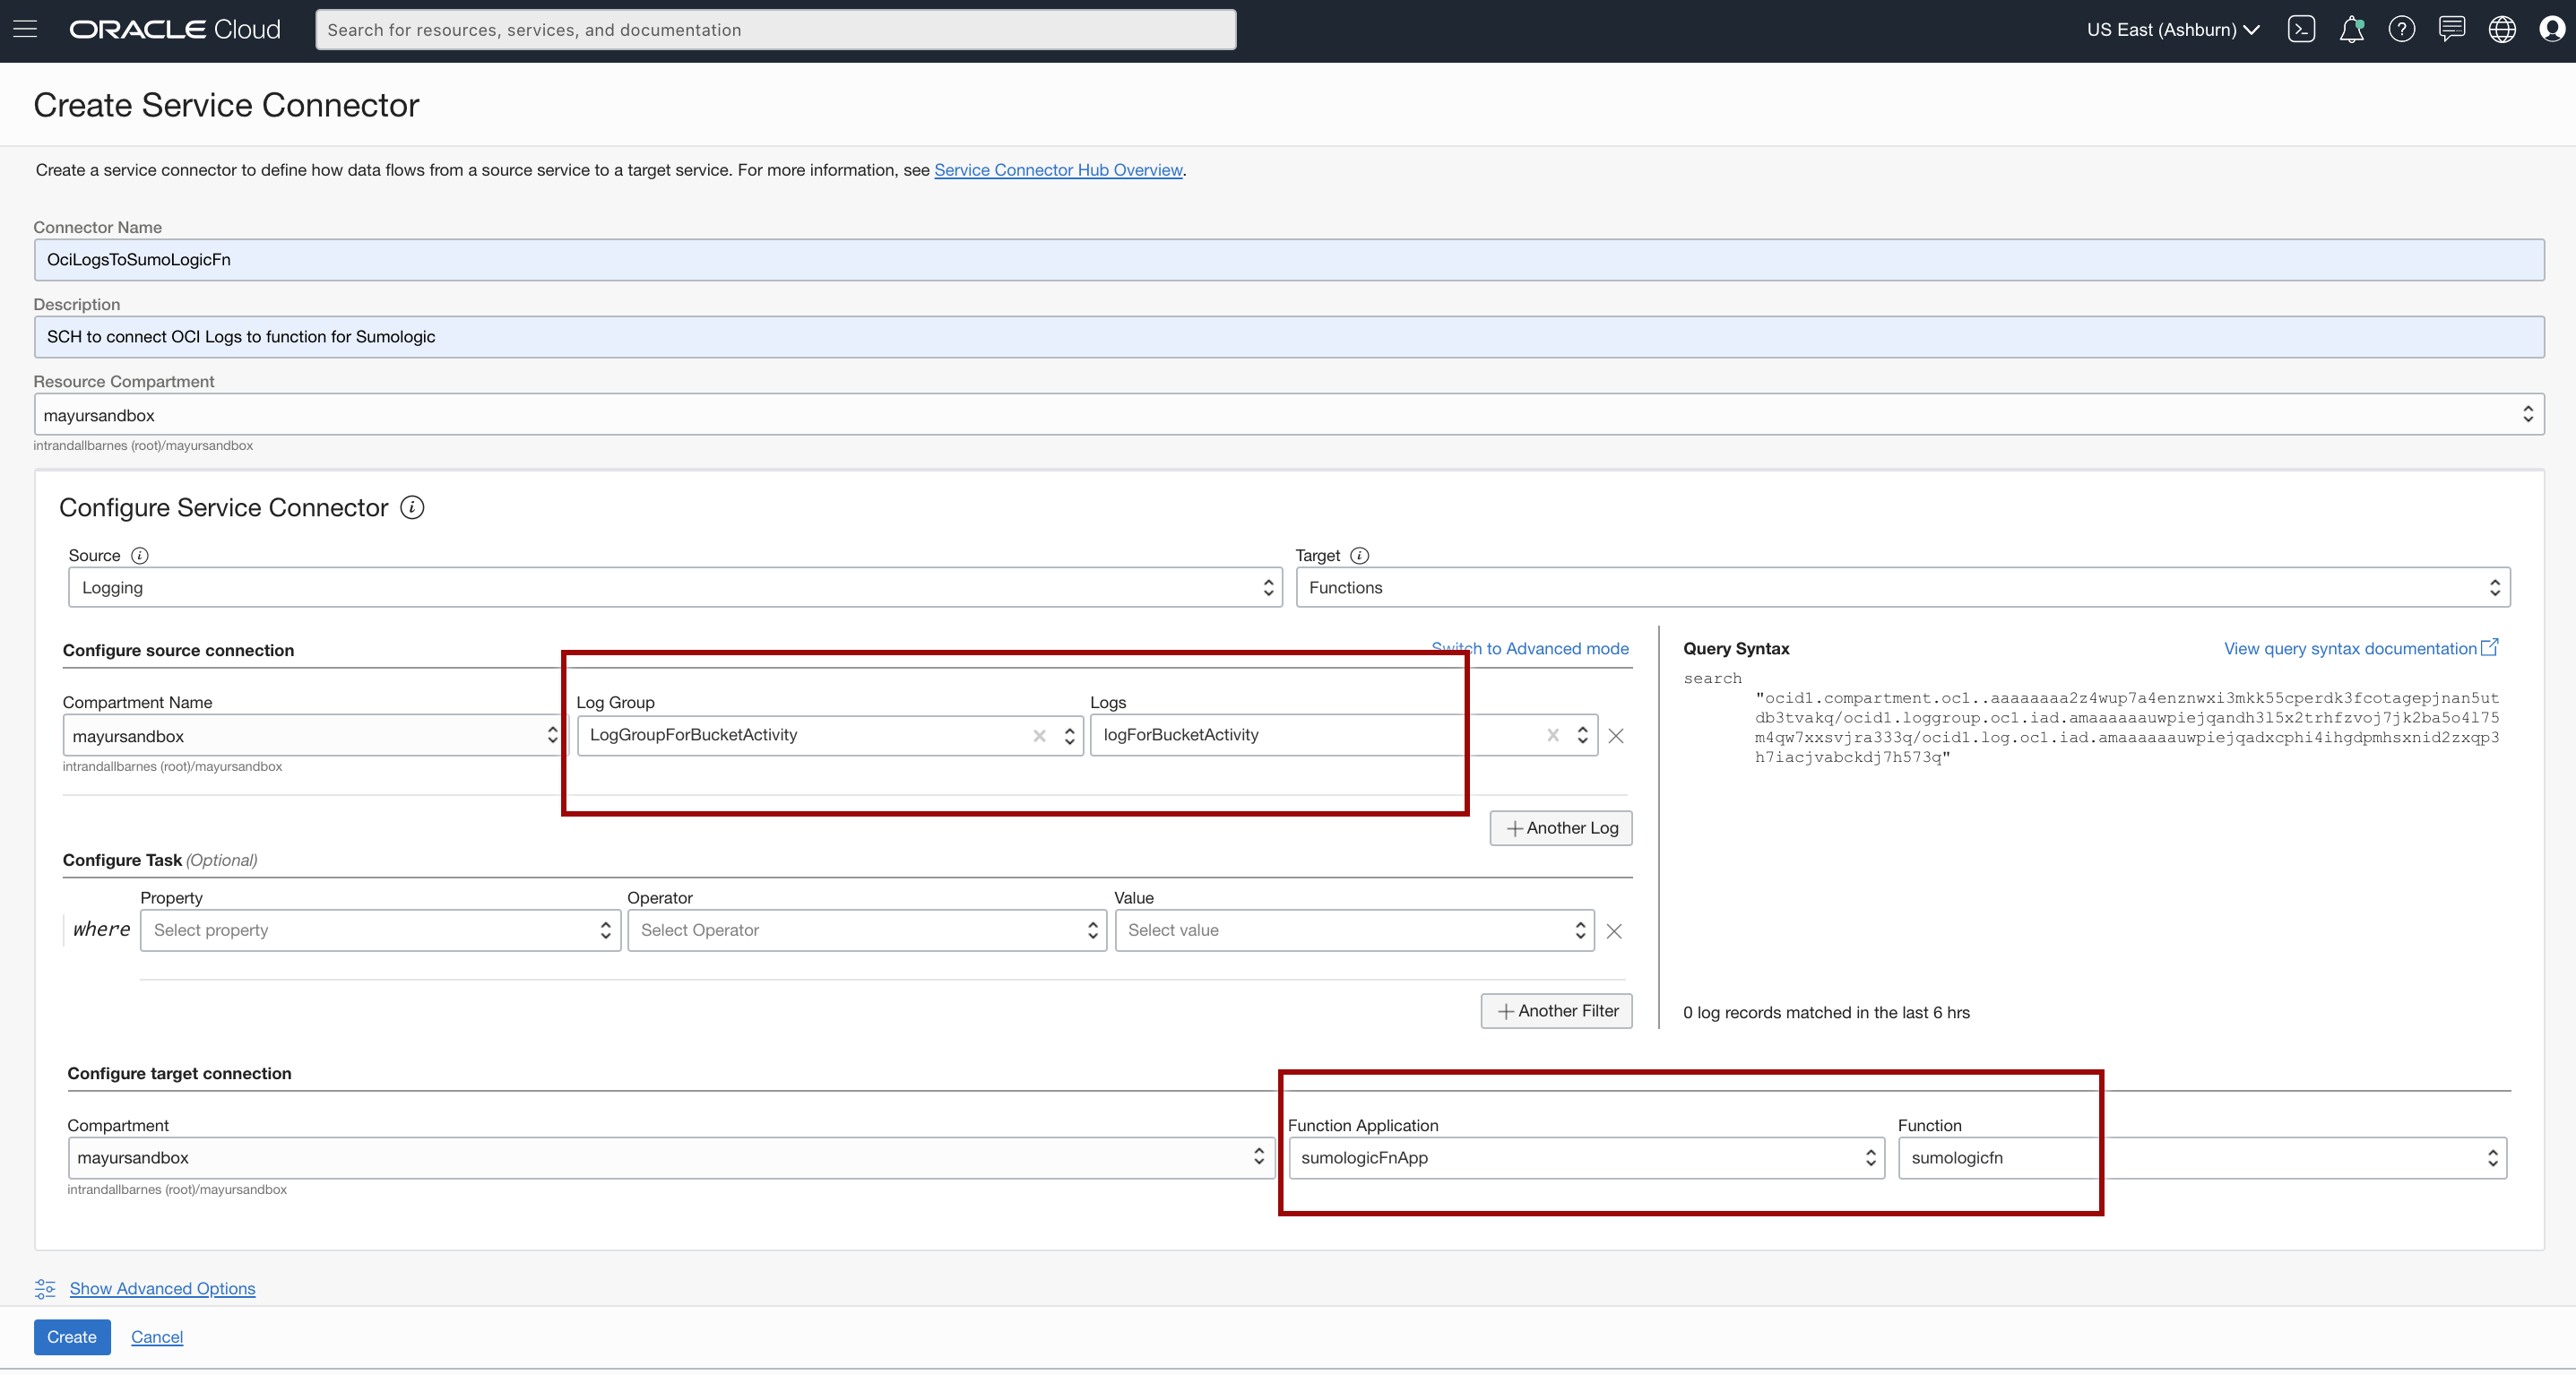
- If prompted to create a policy for writing to Functions, click Create.
note
The Service Connector is now set up and will trigger the function to ingest logs into Sumo Logic every time it finds logs in the Logging service.
- You can now visualize your logs in Sumo Logic.
Monitor the OCI Function
This section shows how you can use a simple email alert to monitor the status of your solution.
For more details, see Overview of Functions.
Create a Topic and a Subscription for the Notification Service
- In the Oracle Cloud Console, from the navigation menu in the upper-left corner, select Application Integration, and then select Notifications.
- Click Create Topic and create a topic with the name my_function_status.
- Choose your topic, click Create Subscription, and use the following example:
- Protocol. Email and add create a subscription with your email.
- The subscription will be created in "Pending" status. You will receive a confirmation email and will need to click the link in the email to confirm your email address.
Check Metrics and Create an Alarm Definition from Metrics
- From the navigation menu in the upper-left corner, select Developer Services, and then select Functions.
- Choose the application and the function that you want to monitor.
- From the Metrics page, go to the Functions Errors chart, click Options, and then click Create an Alarm on this Query.
- Add a name and under Notification, select Destination service as the notification service, select your_compartment, and then select Topic as my_function_status.
Monitor the Status Service Connector Hub
This section shows how you can use a simple email alert to monitor the status of your Service Connector Hub (SCH).
For more details, refer to Service Connector Hub Overview.
Create a Topic and a Subscription for the Notification Service
- In the Oracle Cloud Console, from the navigation menu in the upper-left corner, select Application Integration, and then select Notifications.
- Click Create Topic and create a topic with the name
my_sch_status. - Choose your topic, click Create Subscription and use the following example:
- Protocol. Email and add create a subscription with your email.
- The subscription will be created in “Pending” status. You will receive a confirmation email and will need to click the link in the email to confirm your email address.
Check Metrics and create an Alarm Definition from Metrics
- From the navigation menu in the upper-left corner, select Developer Services, and then select Service Connectors.
- Choose the connector that you want to monitor and from the Resources list in the left navigation panel, select Metrics.
- From the metrics chart that you want to add the alarm to, for example, “Service Connector Hub Errors”, click Options and Create an Alarm on this Query.
- Add a name and under Notification, select Destination service as the notification service, select your_compartment, and then select Topic as my_sch_status.