Kubernetes Fluentd plugin
The configuration described on this page is deprecated. We recommend using our comprehensive Kubernetes solution instead.
To monitor Kubernetes, Sumo recommends using the open source FluentD agent to collect log data, rather than a Sumo collector.
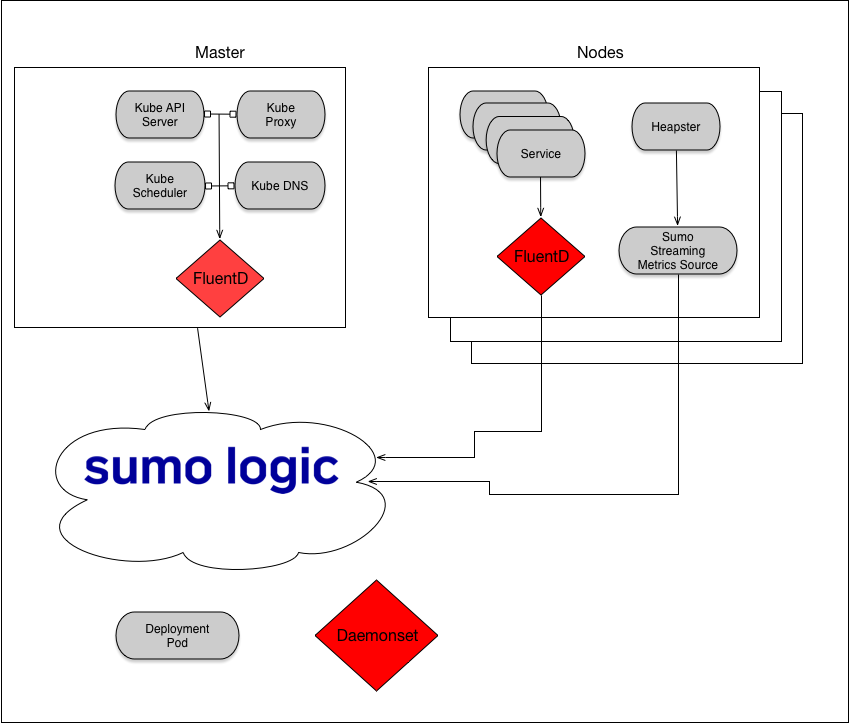
FluentD, with its ability to integrate metadata from the Kubernetes master, is the dominant approach for collecting logs from Kubernetes environments. We have developed a FluentD plugin that sends data directly to Sumo Logic, and for ease of deployment, we have containerized a preconfigured package of FluentD and the Sumo Fluentd plugin. For ease of implementation, we provide a Kubernetes Helm Chart for the Sumo-FluentD integration.
This page describes the Sumo Kubernetes Fluentd plugin, available at https://github.com/SumoLogic/fluentd-kubernetes-sumologic.
The plugin runs as a Kubernetes DaemonSet; it runs an instance of the plugin on each host in a cluster. Each plugin instance pulls system, kubelet, docker daemon, and container logs from the host and sends them, in JSON or text format, to an HTTP endpoint on a hosted collector in the Sumo service.
This integration is supported by Sumo Logic, with the help of a community of open source developers. For support, add a request at https://github.com/SumoLogic/fluentd-kubernetes-sumologic/issues. This will allow the community to participate in support and further improvement of the integration.
Step 1: Create hosted collector and HTTP source in Sumo
In this step you create, on the Sumo service, an HTTP endpoint to receive your logs. This process involves creating an HTTP source on a hosted collector in Sumo. In Sumo, collectors use sources to receive data.
- If you don’t already have a Sumo account, you can create one by clicking the Free Trial button on https://www.sumologic.com/.
- Create a hosted collector, following the instructions on Configure a Hosted Collector in Sumo help. (If you already have a Sumo hosted collector that you want to use, skip this step.)
- Create an HTTP source on the collector you created in the previous step. For instructions, see HTTP Logs and Metrics Source in Sumo help.
- When you have configured the HTTP source, Sumo will display the URL of the HTTP endpoint. Make a note of the URL. You will use it when you configure the Kubernetes service to send data to Sumo.
Step 2: Create a Kubernetes secret
Create a secret in Kubernetes with the HTTP source URL. If you want to change the secret name, you must modify the Kubernetes manifest accordingly.
kubectl create secret generic sumologic --from-literal=collector-url=INSERT_HTTP_URL
You should see the confirmation message:
secret "sumologic" created
Step 3: Install the Sumo Kubernetes FluentD plugin
Follow the instructions in Option A below to install the plugin using kubectl. If you prefer to use a Helm chart, see Option B.
Before you start, see Environment variables for information about settings you can customize, and how to use annotations to override selected environment variables and exclude data from being sent to Sumo.
Option A: Install plugin using kubectl
See the sample Kubernetes DaemonSet and Role in fluentd.yaml.
- Clone the GitHub repo.
- In fluentd-kubernetes-sumologic, install the chart using kubectl.
Which .yaml file you should use depends on whether or not you are running RBAC for authorization. RBAC is enabled by default as of Kubernetes 1.6.
Non-RBAC (Kubernetes 1.5 and below)
kubectl create -f /daemonset/nonrbac/fluentd.yaml
RBAC (Kubernetes 1.6 and above)
kubectl create -f /daemonset/rbac/fluentd.yaml
If you modified the command in Step 2 to use a different name, update the .yaml file to use the correct secret.
Option B: Helm chart
If you use Helm to manage your Kubernetes resources, there is a Helm chart for the plugin at https://github.com/kubernetes/charts/tree/master/stable/sumologic-fluentd.
Logs should begin flowing into Sumo within a few minutes of plugin installation.
Environment variables
Environment variables may not apply to all Fluentd sources. See the table following the environment variable definitions for information about which Fluentd sources are affected by each variable.
| Environment variable | Description |
|---|---|
CONCAT_SEPARATOR | The character to use to delimit lines within the final concatenated message. Most multi-line messages contain a newline at the end of each line. Default: "" |
EXCLUDE_CONTAINER_REGEX | A regular expression for containers. Matching containers will be excluded from Sumo. The logs will still be sent to Fluentd. |
EXCLUDE_FACILITY_REGEX | A regular expression for syslog facilities. Matching facilities will be excluded from Sumo. The logs will still be sent to Fluentd. |
EXCLUDE_HOST_REGEX | A regular expression for hosts. Matching hosts will be excluded from Sumo. The logs will still be sent to Fluentd. |
EXCLUDE_NAMESPACE_REGEX | A regular expression for namespaces. Matching namespaces will be excluded from Sumo. The logs will still be sent to Fluentd. |
EXCLUDE_PATH | Files matching this pattern will be ignored by the in_tail plugin, and will not be sent to Kubernetes or Sumo. This can be a comma-separated list as well. See in_tail documentation for more information. For example, defining EXCLUDE_PATH as shown below excludes all files matching /var/log/containers/*.log. See the example below the table. |
EXCLUDE_POD_REGEX | A regular expression for pods. Matching pods will be excluded from Sumo. The logs will still be sent to Fluentd. |
EXCLUDE_PRIORITY_REGEX | A regular expression for syslog priorities. Matching priorities will be excluded from Sumo. The logs will still be sent to Fluentd. |
EXCLUDE_UNIT_REGEX | A regular expression for systemd units. Matching units will be excluded from Sumo. The logs will still be sent to Fluentd. |
FLUENTD_SOURCE | Fluentd can tail files or query systemd. Allowable values: file, systemd. Default: file |
FLUENTD_USER_CONFIG_DIR | A directory of user-defined Fluentd configuration files, which must be in the *.conf directory in the container. |
FLUSH_INTERVAL | How frequently to push logs to Sumo. Default: 30s |
KUBERNETES_META | Include or exclude Kubernetes metadata such as namespace and pod_name if using JSON log format. Default: true |
LOG_FORMAT | Format in which to post logs to Sumo. Allowable values:
json |
MULTILINE_START_REGEXP | he regular expression for the concat plugin to use when merging multi-line messages. Defaults to Julian dates, for example, Jul 29, 2017. |
NUM_THREADS | Set the number of HTTP threads to Sumo. It might be necessary to do so in heavy-logging clusters. Default: 1 |
READ_FROM_HEAD | Start to read the logs from the head of file, not bottom. Only applies to containers log files. See in_tail doc for more information. Default: true |
SOURCE_CATEGORY | Set the _sourceCategory metadata field in Sumo. Default: "%{namespace}/%{pod_name}" |
SOURCE_CATEGORY_PREFIX | Prepends a string that identifies the cluster to the _sourceCategory metadata field in Sumo. Default: kubernetes/ |
SOURCE_CATEGORY_REPLACE_DASH | Used to replace a dash (-) character with another character. Default: /For example, a Pod called travel-nginx-3629474229-dirmo within namespace app will appear in Sumo with _sourceCategory=app/travel/nginx. |
SOURCE_HOST | Set the _sourceHost metadata field in Sumo. Default: "" |
SOURCE_NAME | Set the _sourceName metadata field in Sumo. Default: "%{namespace}.%{pod}.%{container}" |
AUDIT_LOG_PATH | Define the path to the Kubernetes Audit Log. Default: /mnt/log/kube-apiserver-audit.log |
TIME_KEY | The field name for json formatted sources that should be used as the time. See time_key. Default: time |
Example for EXCLUDE_PATH:
...

env:
  - name: EXCLUDE_PATH
  value: "[\"/var/log/containers/*.log\"]"
The following table show which environment variables affect which Fluentd sources.
| Environment Variable | Containers | Docker | Kubernetes | Systemd |
|---|---|---|---|---|
EXCLUDE_CONTAINER_REGEX | ||||
EXCLUDE_FACILITY_REGEX | ||||
EXCLUDE_HOST_REGEX | ||||
EXCLUDE_NAMESPACE_REGEX | ||||
EXCLUDE_PATH | ||||
EXCLUDE_PRIORITY_REGEX | ||||
EXCLUDE_POD_REGEX | ||||
EXCLUDE_UNIT_REGEX | ||||
TIME_KEY |
Override environment variables using annotations
You can override the LOG_FORMAT, SOURCE_CATEGORY, and SOURCE_NAME environment variables, per pod, using Kubernetes annotations. For example:
apiVersion: v1
kind: ReplicationController
metadata:
  name: nginx
spec:
  replicas: 1
  selector:
    app: mywebsite
  template:
    metadata:
      name: nginx
      labels:
        app: mywebsite
      annotations:
        sumologic.com/format: "text"
        sumologic.com/sourceCategory: "mywebsite/nginx"
        sumologic.com/sourceName: "mywebsite_nginx"
    spec:
      containers:
      - name: nginx
        image: nginx
        ports:
        - containerPort: 80
Exclude data using annotations
You can also use the sumologic.com/exclude annotation to exclude data from Sumo. This data is sent to Fluentd, but not to Sumo.
apiVersion: v1
kind: ReplicationController
metadata:
  name: nginx
spec:
  replicas: 1
  selector:
    app: mywebsite
  template:
    metadata:
      name: nginx
      labels:
        app: mywebsite
      annotations:
        sumologic.com/format: "text"
        sumologic.com/sourceCategory: "mywebsite/nginx"
        sumologic.com/sourceName: "mywebsite_nginx"
        sumologic.com/exclude: "true"
    spec:
      containers:
      - name: nginx
        image: nginx
        ports:
        - containerPort: 80
Step 4: Set up Heapster for metric collection
The recommended way to collect metrics from Kubernetes clusters is to use Heapster and a Sumo collector with a streaming metrics source.
Heapster aggregates metrics across a Kubernetes cluster. Heapster runs as a pod in the cluster, and discovers all nodes in the cluster and queries usage information from each node's kubelet—the on-machine Kubernetes agent.
Heapster provides metrics at the cluster, node and pod level.
Install Heapster in your Kubernetes cluster and configure a Graphite Sink to send the data in Graphite format to Sumo. For instructions, see https://github.com/kubernetes/heapster/blob/master/docs/sink-configuration.md#graphitecarbon.
Assuming you have used the below YAML files to configure your system, then the sink option in graphite would be --sink=graphite:tcp://sumo-graphite.kube-system.svc:2003. You may need to change this depending on the namespace you run the deployment in, the name of the service or the port number for your Graphite source.
Use the Sumo Docker container. For instructions, see https://hub.docker.com/r/sumologic/collector/.
The following sections contain an example configmap, which contains the sources.json configuration, an example service, and an example deployment. Create these manifests in Kubernetes using kubectl.
Kubernetes configMap
kind: ConfigMap
apiVersion: v1
metadata:
  name: "sumo-sources"
data:
  sources.json: |-
    {
      "api.version": "v1",
      "sources": [
        {
          "name": "SOURCE_NAME",
          "category": "SOURCE_CATEGORY",
          "automaticDateParsing": true,
          "contentType": "Graphite",
          "timeZone": "UTC",
          "encoding": "UTF-8",
          "protocol": "TCP",
          "port": 2003,
          "sourceType": "Graphite"
        }
      ]
    }
Kubernetes service
apiVersion: v1
kind: Service
metadata:
  name: sumo-graphite
spec:
  ports:
    - port: 2003
  selector:
    app: sumo-graphite
Kubernetes deployment
apiVersion: extensions/v1beta1
kind: Deployment
metadata:
  labels:
    app: sumo-graphite
  name: sumo-graphite
spec:
  replicas: 2
  template:
    metadata:
      labels:
        app: sumo-graphite
    spec:
      volumes:
      - name: sumo-sources
        configMap:
          name: sumo-sources
          items:
          - key: sources.json
            path: sources.json
      containers:
      - name: sumo-graphite
        image: sumologic/collector:latest
        ports:
        - containerPort: 2003
        volumeMounts:
        - mountPath: /sumo
          name: sumo-sources
        env:
        - name: SUMO_ACCESS_ID
          value: <SUMO_ACCESS_ID>
        - name: SUMO_ACCESS_KEY
          value: <SUMO_ACCESS_KEY>
        - name: SUMO_SOURCES_JSON
          value: /sumo/sources.json
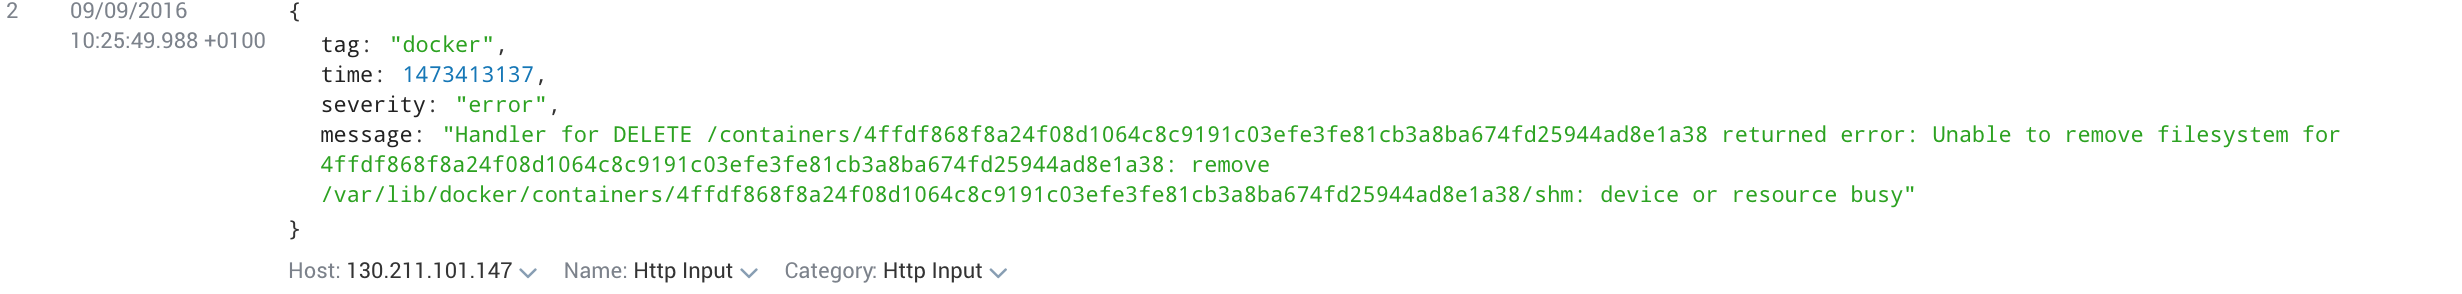
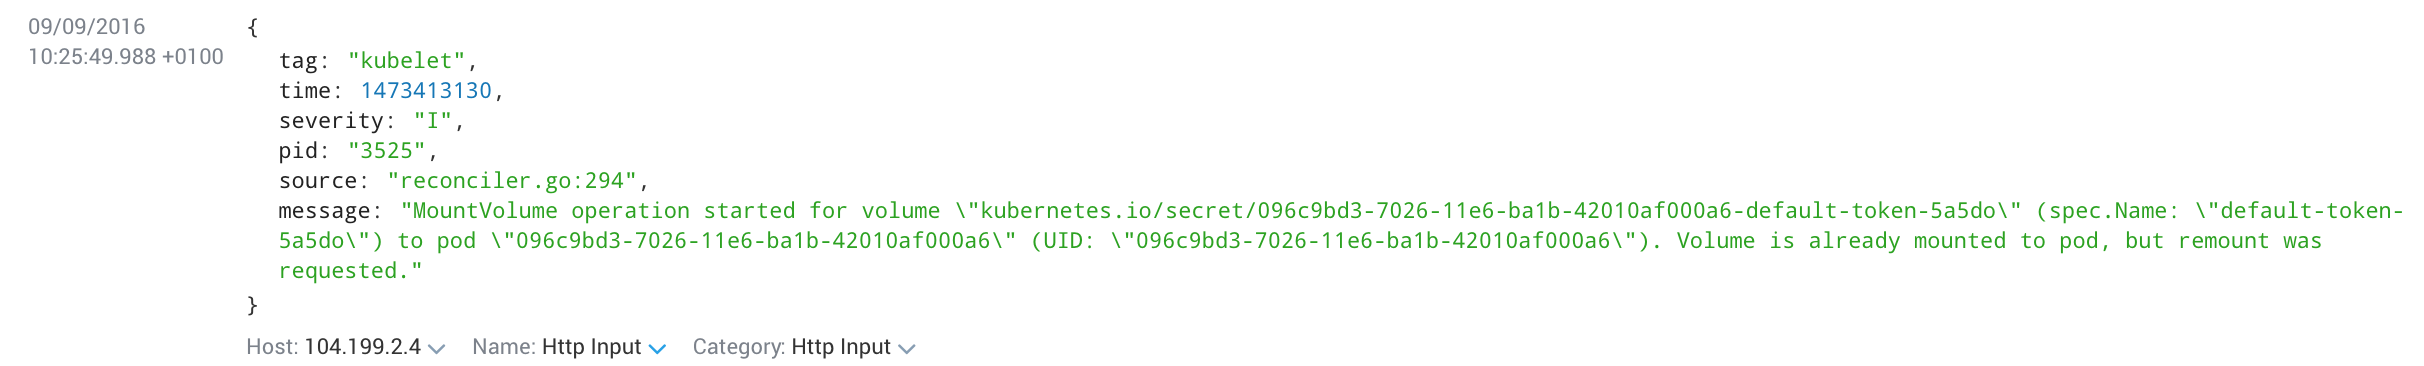
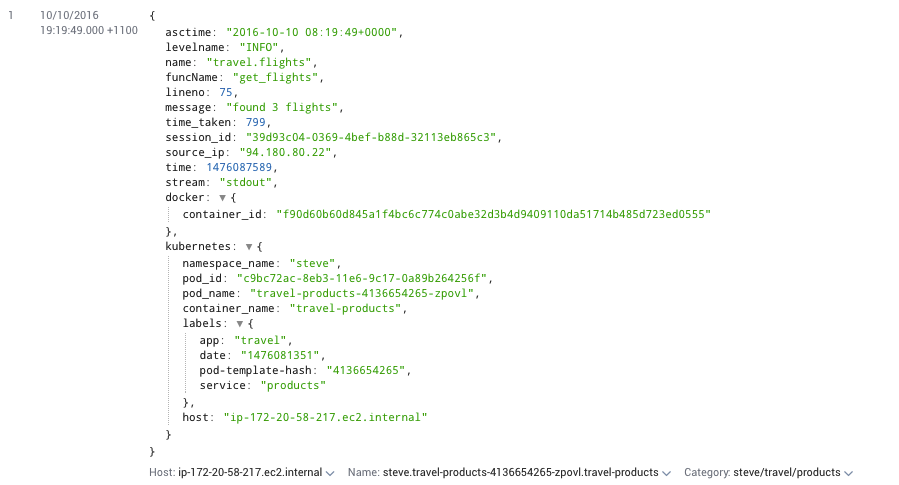
Log data
After performing the configuration described above, your logs should start streaming to Sumoin json or text format with the appropriate metadata. If you're using json format you can auto extract fields, for example:
_sourceCategory=some/app | json auto.
Docker
Kubelet
Kubelet logs are only collected If you're using systemd. Kubernetes no longer outputs the kubelet logs to a file.
Containers
Taints and Tolerations
By default, the Fluentd pods will schedule on, and therefore collect logs from, any worker nodes that do not have a taint and any master node that does not have a taint beyond the default master taint. If you would like to schedule pods on all nodes, regardless of taints, uncomment the following line from fluentd.yaml before applying it.
tolerations:
           #- operator: "Exists"
Running On OpenShift
This daemonset setting mounts /var/log as service account FluentD so you need to run containers as privileged container. Here is command example:
oc adm policy add-scc-to-user privileged system:serviceaccount:logging:sumologic-fluentd
oc adm policy add-cluster-role-to-user cluster-reader system:serviceaccount:logging:sumologic-fluentd
oc label node —all logging-sumologic-fluentd=true
oc patch ds sumologic-fluentd -p "spec:
  template:
    spec:
      containers:
      - image: sumologic/fluentd-kubernetes-sumologic:latest
        name: fluentd
        securityContext:
          privileged: true"
oc delete pod -l name = fluentd-sumologic