Amazon CloudWatch Source for Metrics
A Sumo Logic CloudWatch Source allows you to gather metrics data from an Amazon resource.
We recommend using the newer AWS Kinesis Firehose for Metrics Source to collect CloudWatch metrics. For more information, see Which to use: Kinesis Firehose source or CloudWatch source?
Supported AWS metrics
A Sumo CloudWatch Source only supports CloudWatch metrics that are emitted at a regular interval. It cannot ingest metrics that are emitted with significant latency, such as Amazon S3 Daily Storage Metrics or AWS Billing metrics, or at sporadic intervals, such as Amazon DynamoDB throttled events.
Sumo does support S3 Request Metrics. Since S3 does not publish the request metrics by default, you must enable them if you want to collect them. For more information, see Monitoring Metrics with Amazon CloudWatch in AWS help.
EC2 metrics have high latency and can increase the costs of your AWS account. For EC2 metrics, consider Installing a Collector with a Host Metrics Source. The advantage is near zero latency and more information at a lower overall cost.
About AWS tag filtering
When you configure a CloudWatch source, you have the option of defining AWS tag filters. Tag filters allow you to filter the CloudWatch metrics you collect by the AWS tags assigned to your resources. For each AWS namespace, you can define one or more tag-value pairs.
Tag filtering is only supported for user-defined AWS tags, not for AWS-generated tags.
Here’s how tag filtering works:
-
If you do not specify a tag filter for a namespace, the source will collect all metrics for the namespace.
-
If you specify a single
tag = valuepair for a namespace, the source will collect metrics from resources with that tag value. -
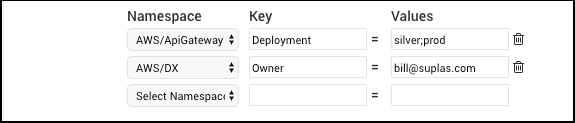
If you specify multiple values for a specific tag for a namespace, as shown below, the filters are OR’ed. For example, with the following setting, the source will collect metrics from resources in the AWS/DynamoDB namespace whose
ownertag is either “Veronica” or “Bryan”.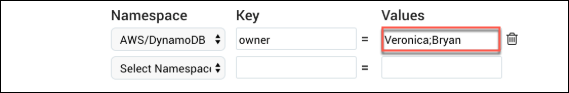
-
You can use multiple lines to define filters for different tags in the same namespace. Filters on the same namespace but in different lines are AND’ed together. For example, with the following setting the source will collect metrics from resources in the AWS/DynamoDB namespace whose whose
ownertag is “Veronica” andEnvtag is = “prod”.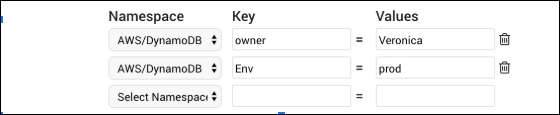
-
Filters on different namespaces are UNION’ed together. For example, with the following setting the source will collect metrics from resources in the AWS/DynamoDB namespace whose
ownertag is “Veronica”, and also from resources in the AWS/Redshift namespace whoseEnvtag is “prod”.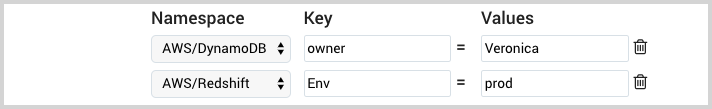
Tag filters will not be applied to previously ingested data, and can take a few minutes to apply to existing data.
AWS tag filtering namespace support
AWS tag filtering is supported for the following AWS namespaces.
- AWS/ApiGateway
- AWS/ApplicationELB
- AWS/AppStream
- AWS/CloudFront
- AWS/DMS
- AWS/DX
- AWS/DynamoDB
- AWS/EBS
- AWS/EC2
- AWS/EC2Spot
- AWS/EFS
- AWS/ElastiCache
- AWS/ElasticBeanstalk
- AWS/ElasticMapReduce
- AWS/ELB
- AWS/ES
- AWS/Firehose
- AWS/Inspector
- AWS/Kinesis
- AWS/KinesisAnalytics
- AWS/KinesisVideo
- AWS/KMS
- AWS/Lambda
- AWS/Logs
- AWS/ML
- AWS/NATGateway
- AWS/NetworkELB
- AWS/OpsWorks
- AWS/RDS
- AWS/Redshift
- AWS/Route53
- AWS/S3
- AWS/SageMaker
- AWS/SQS
- AWS/StorageGateway
- AWS/VPN
- AWS/WorkSpaces
Set up an Amazon CloudWatch source
-
Before you begin, grant permission for Sumo Logic to list available metrics and get metric data points. See Grant Access to an AWS Product for details.
-
Classic UI. In the main Sumo Logic menu, select Manage Data > Collection > Collection.
New UI. In the Sumo Logic top menu select Configuration, and then under Data Collection select Collection. You can also click the Go To... menu at the top of the screen and select Collection. -
Click Add Source next to a Hosted Collector.
-
Select AWS CloudWatch Metrics.
-
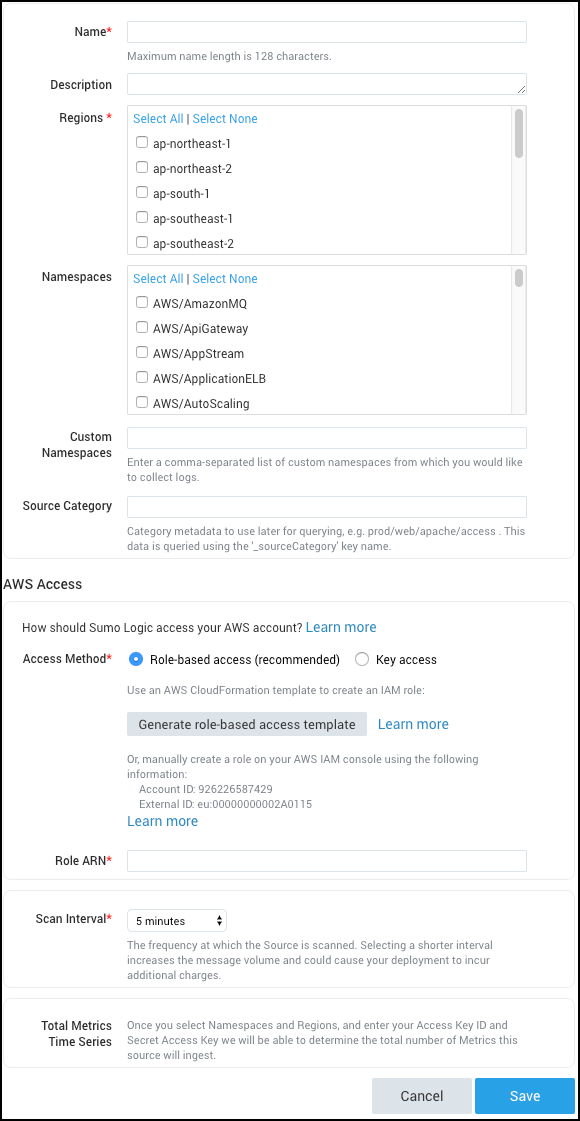
Name. Enter a name to display for the new source.
-
Description. Optional description.
-
Regions. Select one or more Amazon regions.
-
Namespaces. Select one or more Amazon namespaces.
noteIf you change the namespace selection, there may be a delay of as much as 15 minutes before the change is reflected in the available options for metrics queries.
-
AWS Tag Filters. This setting is visible only if you selected one or more of the namespaces listed in About AWS tag filtering.
Tag filters allow you to filter the CloudWatch metrics you collect by the AWS tags you have assigned to your AWS resources. You can define tag filters for each supported namespace. If you do not define any tag filters, all metrics will be collected for the regions and namespaces you configured for the source above:
- Namespace. Select a namespace from the pulldown.
- Values. Enter one or more tag values. If you specify multiple values, separate them with a semicolon character (;). For example,
stage;prod - After you define a filter, a new row appears. You can define another filter for the same namespace, or one for a different one. If you want to filter on an additional tag for the same namespace, select that namespace again from the pulldown, and specify the Key and Values fields.
noteIf you filter by metrics from a namespace by multiple tags (different keys) the source will only collect metrics that match all tags.
-
Custom Namespaces. Enter a comma-separated list of any custom namespaces from which you want to collect custom metrics. For more information about custom metrics, see http://docs.aws.amazon.com/AmazonCloudWatch/latest/monitoring/publishingMetrics.html.
-
Source Category. Enter any string to tag the output collected from this Source. (Category metadata is stored in a searchable field called
_sourceCategory.) -
For AWS Access you have two Access Method options. Select Role-based access or Key access based on the AWS authentication you are providing. Role-based access is preferred, this was completed in step 1, Grant Sumo Logic access to an AWS Product.
- For Role-based access enterthe Role ARN that was provided by AWS after creating the role.
- For Key access enter the Access Key ID and Secret Access Key. See AWS Access Key ID and AWS Secret Access Key for details in AWS's documentation.
-
Scan Interval. Use the default of 5 minutes, or change this value to indicate how frequently Sumo Logic should poll the CloudWatch API. To learn more about polling interval considerations, see AWS CloudWatch Scan Interval below.
-
Total Metrics. This field displays the total number of metrics (unique metric time series) that will be collected if the Source is created with the current configuration. If all of your CloudWatch metrics are published at a 1 minute interval, then "Total Metrics" will also be the total number of 'data points per minute' that are generated by this source. However, if your CloudWatch metrics are published every 5 minutes, then you would divide this number by 5 to get the number of 'data points per minute' that would be generated by this source. The field automatically refreshes the count when there are changes to the following fields: Regions, Namespaces, or AWS credentials.
-
Click Save.
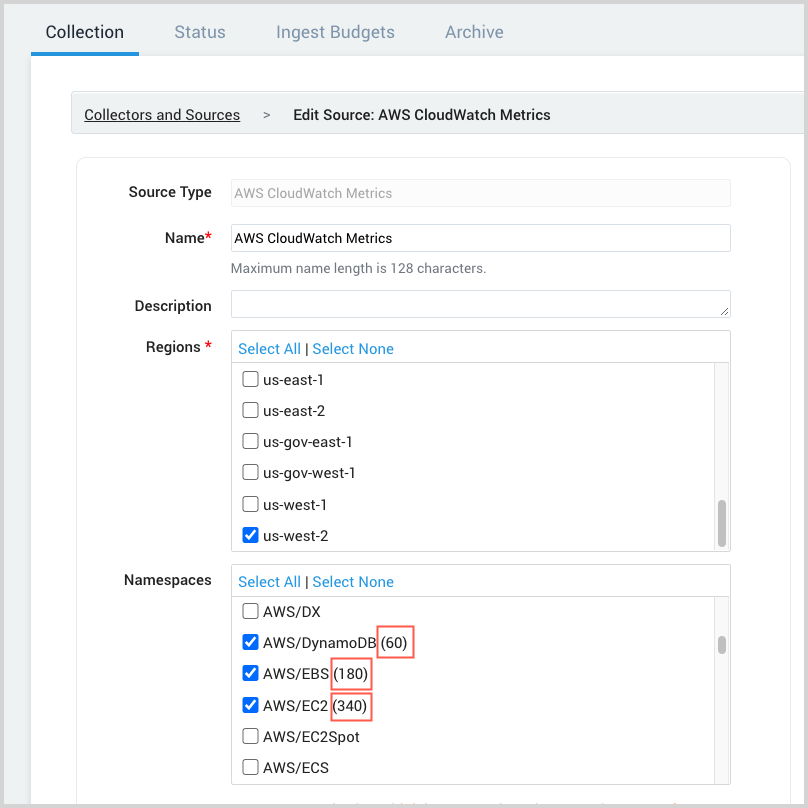
Unique time series per namespace
Sometime after you configure the AWS access method for the source, the source configuration UI will start to display the number of unique time series for each namespace configured for the source.
CloudWatch metric visibility
Your CloudWatch metrics will not be immediately available in Sumo Logic. Metrics should be available after a period approximately equal to the metric latency on CloudWatch plus five minutes.
AWS CloudWatch scan interval
The scan interval defines how long Sumo Logic waits between calls to the CloudWatch API. This does not affect the number of metric data points collected. If metrics are published to CloudWatch every minute, and you scan every 5 minutes, then each API response would return 5 data points. Decreasing the interval will reduce the number of API calls, which may help with your AWS bill. However, it will also add latency to your CloudWatch Metrics collection.
AWS reports CloudWatch metrics at different granularities (1-minute, 3-minute, and 5-minute intervals), so setting a scan interval that's too short could lead to excessive querying. Setting an interval that's too long can delay the update frequency of new metrics appearing in Sumo Logic.
Under some circumstances, Sumo Logic automatically increases the scan interval to avoid data loss due to throttling of data by AWS. See Enable and Manage the Audit Index for details.
Querying the AWS CloudWatch Metrics API can incur data transfer charges that may appear on your AWS bill.
Throttling of CloudWatch data
AWS automatically throttles CloudWatch data if the limits that Amazon sets for the associated APIs are exceeded. If you have a high volume of metrics data points in your account, it is likely that Amazon will throttle your CloudWatch data.
If no adjustments are made on the Sumo Logic side, throttling on the Amazon side can cause metrics data to be dropped. To prevent this from occurring, Sumo Logic automatically doubles the CloudWatch scan interval if more than one throttling message is received in a single interval. However, the change in scan interval isn't reflected in the Sumo Logic UI. The original configured interval is still shown.
If the scan interval is automatically changed, a message similar to the following is added to the audit log. No action is required by the Sumo Logic user. CloudWatch source ui-cw-oldPrimary received throttling exception from AWS while querying for metrics. Increasing scan interval to 20 minutes.
CloudWatch data point aggregation
AWS pre-aggregates CloudWatch data points using these aggregators:
- Minimum
- Maximum
- Average
- Sum
- SampleCount
When you query CloudWatch metrics, all of the above aggregation types will be charted unless you include a Statistic tag in your query selector. To return and chart only the aggregation type you want, use the following selector in your query:
Statistic=<aggregator>
For example,
Statistic=Minimum
Collected metrics
For details on Amazon CloudWatch collected metrics, refer to: CW Support for AWS