Host Metrics Source
An installed Sumo Logic Collector can collect host metrics pertaining to the local host. The metrics are ingested and become available for metrics visualization. The host metrics are gathered by the open-source SIGAR library.
This topic describes how to set up a host metrics Source, and lists the metrics that are collected, and the relevant time intervals. See JSON Parameters for Installed Sources for a list of JSON parameters for this Source.
Host Metrics are available on Collector versions 19.155 and later.
You'll need an installed Collector to set up a host metrics Source. See Installed Collectors for instructions on installing Collectors. After your Collector and Sources are installed, you can install the Host Metrics App with preconfigured searches and Dashboards, to analyze your metrics data.
Permission Requirements
When not using a root or administrator user you need to provide the necessary permissions for the Collector to gain access to your host's metrics data.
- Linux metrics are fetched from the
/procdirectory, so a non-root user needs read permission in this directory (and its subdirectories) to collect host metrics. - Windows needs the user to be added to the "Performance Monitor Users" local group.
Host Metrics Source on EC2 instances
A host metric source running on an Installed Collector on an Amazon EC2 instance will automatically apply the following EC2 tags to the metric it collects:
- InstanceID
- Instance type
- Availability Zone
- Region
- AccountID
Manually Configure a Host Metrics Source
-
Classic UI. In the main Sumo Logic menu, select Manage Data > Collection > Collection.
New UI. In the Sumo Logic top menu select Configuration, and then under Data Collection select Collection. You can also click the Go To... menu at the top of the screen and select Collection. -
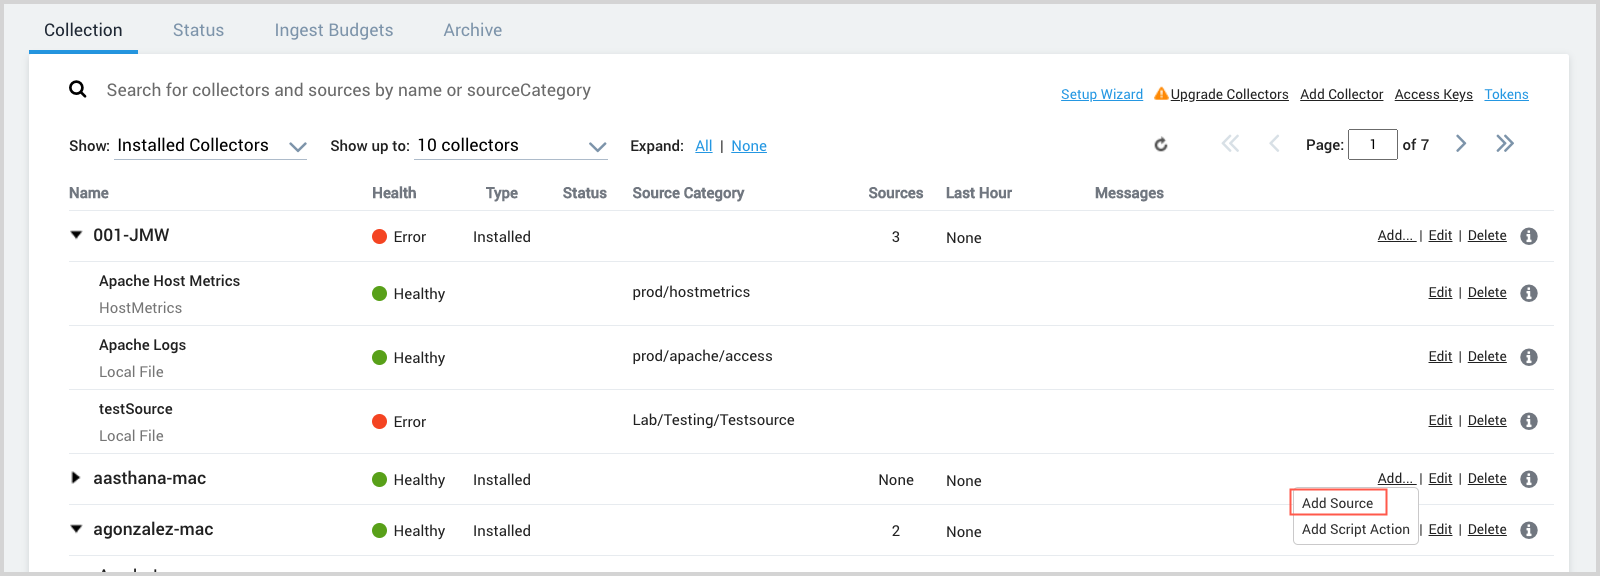
Find the name of the installed collector to which you'd like to add a source. Click Add and then choose Add Source.
-
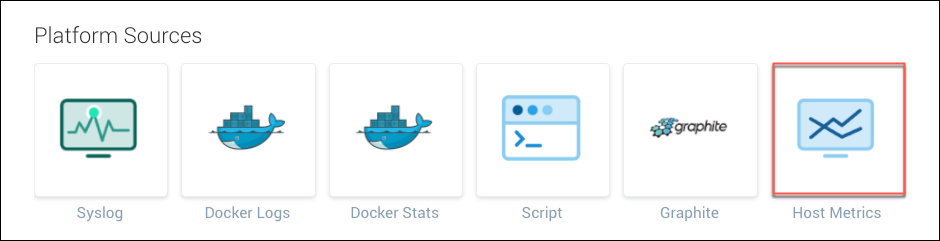
Select Host Metrics as the source type.
-
Set the following:
-
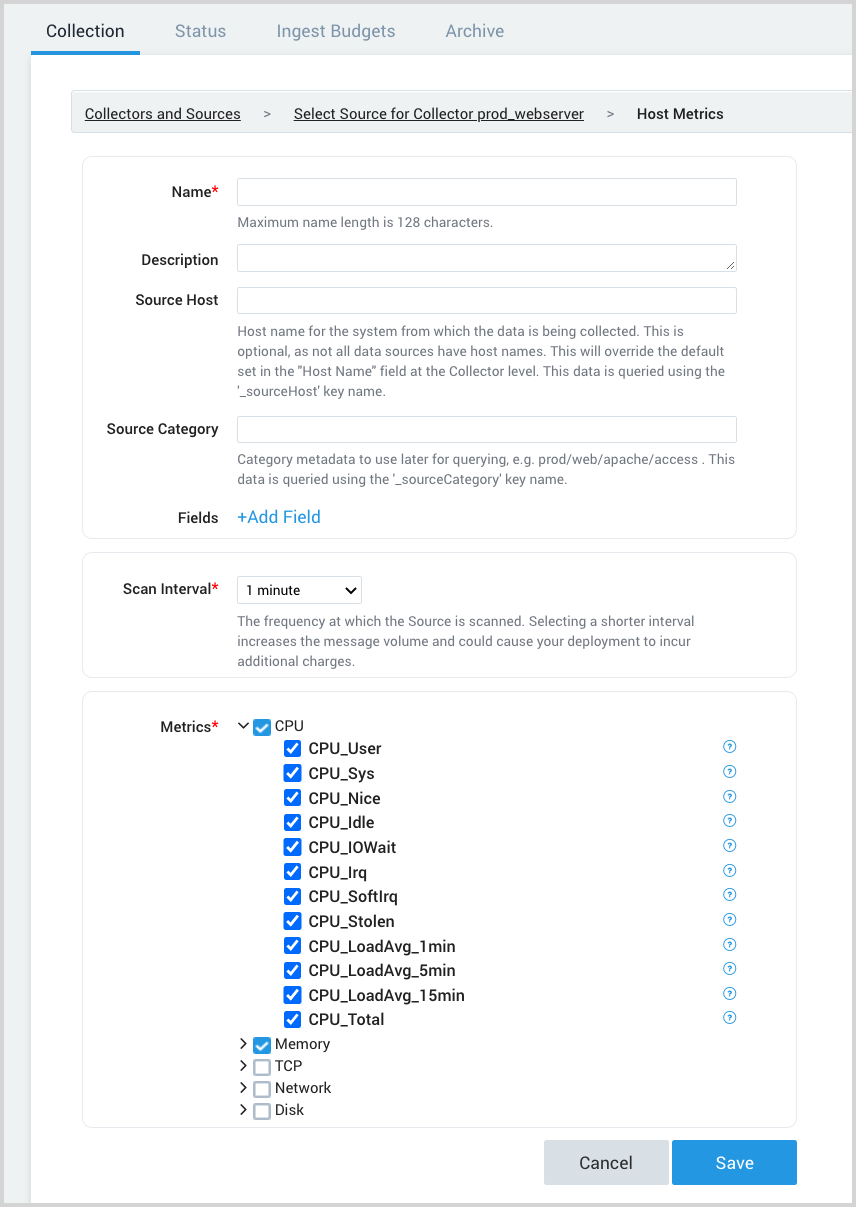
Name. Enter the name you'd like to display for the new Source. Description is optional. Source name metadata is stored in a searchable field called
_sourceCategory. -
Source Host. Enter the host name of the machine from which the metrics will be collected.
-
Source Category. Enter any string to tag the output collected from this Source with searchable metadata. For example, enter firewall to tag all entries from this Source in a field called
_sourceCategory. Type_sourceCategory=firewallin the Search field to return results from this Source. For more information, see Metadata Naming Conventions. -
Fields. Click the +Add Field link to add custom metric metadata. Define the fields you want to associate, providing a name (key) and value for each.
-
Scan Interval. Select the frequency for the Source to scan for host metrics data. Selecting a short interval will increase the message volume and could cause your deployment to incur additional charges. The default is 1 minute.
-
Metrics. Select check boxes for the metrics to collect. By default, all CPU and memory metrics are collected.
- Select the top level check box to select all metrics in that category. A blue checkmark icon
 indicates that the category is selected.
 - To select individual metrics, click the right-facing arrow to expand the category and select the individual metrics. The icon changes to
 , as shown in the screenshot.
- Select the top level check box to select all metrics in that category. A blue checkmark icon
-
-
When you are finished configuring the Source, click Save.
Collected Metrics
The following tables list the available host metrics.
CPU Metrics
| Metric | Units | Description |
|---|---|---|
| CPU_User | % | Total system cpu user time |
| CPU_Sys | % | Total system cpu kernel time |
| CPU_Nice | % | Total system cpu nice time |
| CPU_Idle | % | Total system cpu idle time |
| CPU_IOWait | % | Total system cpu IO wait time |
| CPU_Irq | % | Total system cpu time servicing interrupts |
| CPU_SoftIrq | % | Total system cpu time servicing softirqs |
| CPU_Stolen | % | Total system cpu involuntary wait time |
| CPU_LoadAvg_1min* | Average | System load average for past 1 minute |
| CPU_LoadAvg_5min* | Average | System load average for past 5 minutes |
| CPU_LoadAvg_15min* | Average | System load average for past 15 minutes |
| CPU_Total | % | Total system CPU usage time |
Load averages are not available on Windows platform
Memory Metrics
| Metric | Units | Description |
|---|---|---|
| Mem_Total | Bytes | Total amount of physical RAM |
| Mem_Free | Bytes | The amount of physical RAM left unused by the system |
| Mem_Used | Bytes | Total used system memory, calculated asMemTotal - MemFreeThis metric includes the space allocated in buffers and in the Page Cache, which can make it appear that a larger portion of physical RAM is being consumed than is actually in use. |
| Mem_ActualFree | Bytes | Actual total free system memory calculated as:Mem_Free + Buffers + CachedWhere Buffers - The amount of physical RAM used for file buffersCached - The amount of physical RAM used as cache memory |
| Mem_ActualUsed | Bytes | Actual total used system memory calculated as:Mem_Total - Mem_Actual_FreeThis metric better represents the amount of physical RAM in use than Mem_Used. |
| Mem_UsedPercent | % | Percent total used system memory calculated as:(Mem_Total - Mem_Actual_Free) / Mem_total |
| Mem_FreePercent | % | Percent total free system memory |
| Mem_PhysicalRam | Bytes | System random access memory |
TCP Metrics
| Metric | Units | Description |
|---|---|---|
| TCP_InboundTotal | Count | TCP inbound connection count |
| TCP_OutboundTotal | Count | TCP outbound connection count |
| TCP_Established | Count | TCP established connection count |
| TCP_Listen | Count | TCP listen connection count |
| TCP_Idle | Count | TCP idle connection count |
| TCP_Closing | Count | TCP closing connection count |
| TCP_CloseWait | Count | TCP close_wait connection count |
| TCP_Close | Count | TCP close connection count |
| TCP_TimeWait | Count | TCP time_wait connection count |
Networking Metrics
These have two additional dimensions:
- Interface: Name of the network interface (example:
eth0) - Description: Description of the network interface (example:
Dual Band Wireless-AC 8265)
Networking metrics are cumulative, so you can use the rate operator to display these metrics as a rate per second
Example: metric=Net_InBytes Interface=eth0 | rate
| Metric | Units | Description |
|---|---|---|
| Net_InPackets | Packets | Number of received packets |
| Net_OutPackets | Packets | Number of sent packets |
| Net_InBytes | Bytes | Number of received bytes |
| Net_OutBytes | Bytes | Number of sent bytes |
Disk Metrics
Disk metrics have two additional dimensions:
- DevName: Device name, such as the mount name (example: udev)
- DirName: Directory name, such as the mount directory (example: /dev)
Disk_Reads, Disk_Writes, Disk_ReadBytes, and Disk_WriteBytes are cumulative, so you can use the rate operator to display these metrics as a rate per second.
Example: metric=Disk_WriteBytes | rate
| Metric | Units | Description |
|---|---|---|
| Disk_Reads | Operations | Number of physical disk reads |
| Disk_ReadBytes | Bytes | Number of physical disk bytes read |
| Disk_Writes | Operations | Number of physical disk writes |
| Disk_WriteBytes | Bytes | Number of physical disk bytes written |
| Disk_Queue | Operations | Number of disk queue operations |
| Disk_InodesAvailable* | Nodes | Number of free file nodes |
| Disk_Used | Bytes | Total used bytes on filesystem |
| Disk_UsedPercent | % | Percentage of filesystem space used |
| Disk_Available | Bytes | Total available bytes on filesystem |
Disk_InodesAvailable is not available on Windows platform
Time Intervals
The time interval determines how frequently the Source is scanned for metrics data. Sumo Logic supports pre-specified time intervals (10 seconds, 15 seconds, 30 seconds, 1 minute, and 5 minutes).
You can also specify a time interval in JSON by using the interval parameter, as follows:
"interval" : 60000
The JSON parameter is in milliseconds. We recommend 60 seconds (60000 ms) or longer granularity. Specifying a shorter interval will increase the message volume and could cause your deployment to incur additional charges.
AWS Metadata
Collectors running on Amazon EC2 instances can optionally collect AWS Metadata such as EC2 tags to make it easier to search for Host Metrics. For more information, see AWS Metadata Source for Metrics.
Only one AWS Metadata Source for Metrics is required to collect EC2 tags from multiple hosts.