Remote Windows Performance Monitor Log Source
This Source is no longer supported or available with Collector version 19.361-8.
Set up a Remote Windows Performance Monitor Log Source to collect remote performance data you would normally see in the Windows Performance Monitor. Before collecting Windows performance data from a remote machine, you'll need to configure a few settings.
A Windows Performance Monitor Log Source collects the unique formats of Windows Events using the WMI (Windows Management Instrumentation) interface. You can configure a Windows Performance Monitor Log Source to collect from multiple remote machines by designating a comma-separated list of remote host names.
Prerequisites
To collect remote Performance Monitor logs, you first need to configure a domain user and adjust firewall and RPC settings. See Preconfiguring a Machine to Collect Remote Windows Performance Monitoring Logs for more information.
Create a remote Windows Performance Monitor Log Source
To configure a remote Windows Performance Monitor Log Source:
-
Complete the prerequisites to collecting remote events.
-
Classic UI. In the main Sumo Logic menu, select Manage Data > Collection > Collection.
New UI. In the Sumo Logic top menu select Configuration, and then under Data Collection select Collection. You can also click the Go To... menu at the top of the screen and select Collection. -
Find the name of the installed Collector to which you'd like to add a Source. Click Add and then choose Add Source from the pop-up menu.
-
Click Windows Performance.
-
Choose Remote for the Type of Windows Performance Source.
-
Set the following:
-
Name. Type the name to display for this Source from within Sumo Logic.
-
Description is optional.
-
Windows host(s). Enter one or more hostnames for the Windows machines from which you want to collect Windows Performance Monitor data. If you'd like to collect from more than one remote host, separate the hostnames with a comma. (If you enter more than one hostname, each host must have the same domain user. See Preconfiguring a Machine to Collect Remote Windows Performance Monitoring Logs for more information.) The hostname can be a maximum of 128 characters.
-
Frequency. Depending on your Windows system and its needs, select a frequency to run the selected queries. If your Windows system is relatively stable, a frequency of 15m should be appropriate. (Selecting a frequency of 1m could flood your system with logs and create an undesirable outcome.)
-
Source Category. Enter a string used to tag the output collected from this Source with searchable metadata. For example, typing web_apps tags all the logs from this in the sourceCategory field. For more information, see Metadata Naming Conventions.
-
Fields. Click the +Add Field link to define the fields you want to associate, each field needs a name (key) and value.
 A green circle with a check mark is shown when the field exists in the Fields table schema.
 An orange triangle with an exclamation point is shown when the field doesn't exist in the Fields table schema. In this case, an option to automatically add the nonexistent fields to the Fields table schema is provided. If a field is sent to Sumo that does not exist in the Fields schema it is ignored, known as dropped.
-
Windows Domain. Type the name of the Windows Domain, the Username for this host, and the Password.
-
-
Perfmon Queries. Select from the provided default Perfmon Queries, or create your own custom query.
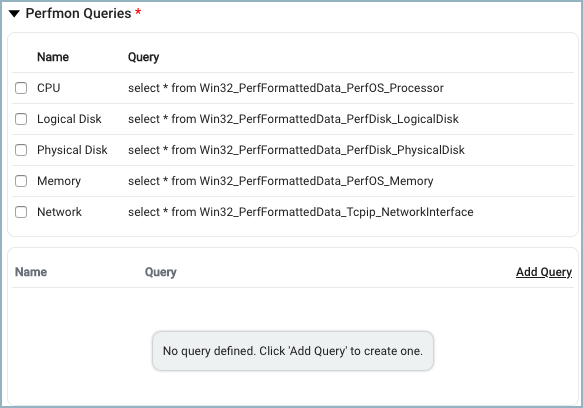
- Click the query's check box to select it.
- To add a custom query, click Add Query, enter a name and the query. Then click Add.
-
Processing Rules (Optional). To add processing rules for the new source, click Add Rule. Enter a name, a filter, and select the type. Then click Apply.
-
When you are finished configuring the Source, click Save.
You can return to this dialog and edit the settings for the Source at any time.