Windows Source Template
The Windows source template creates an OpenTelemetry configuration that can be pushed to a remotely managed OpenTelemetry collector (abbreviated as otelcol). By creating this source template and pushing the config to the appropriate OpenTelemetry agent, you can collect Windows event logs and metrics from Windows systems and send them to Sumo Logic.
Fields created by the source template
When you create a source template, the following fields are automatically added (if they don’t already exist):
sumo.datasource. Fixed value of windows.deployment.environment. User configured field at the time of collector installation. This identifies the environment where the Windows system resides. For example:dev,prod, orqa.host.group. This is a collector-level field that is user configured at the time of collector installation. It identifies the Windows host group.host.name. This is tagged through the resourcedetection processor. It holds the value of the host name where the OTel collector is installed.
Prerequisites
For logs collection
Ensure that the channel for collecting Windows event logs is installed and enabled on the monitored Windows machine.
Configuring the Windows source template
Follow the below steps to set a remotely managed OpenTelemetry collector and push the source template to it.
Step 1: Set up remotely managed OpenTelemetry collector
In this step, we'll install the collector and add a uniquely identifiable tag to these collectors.
- Classic UI. In the main Sumo Logic menu, select Manage Data > Collection > OpenTelemetry Collection.
New UI. In the Sumo Logic main menu select Data Management, and then under Data Collection select OpenTelemetry Collection. You can also click the Go To... menu at the top of the screen and select OpenTelemetry Collection. - On the OpenTelemetry Collection page, click + Add Collector.
- In the Set up Collector step:
- Choose your platform (for example, Linux).
- Enter your Installation Token.
- Under Tag data on Collector level, add a new tag to identify these collectors for their corresponding use case (for example, if you are running Apache, set
application = Apache). - Leave the Collector Settings at their default values to configure collectors as remotely managed.
- Under Generate and run the command to install the collector, copy and run the installation command in your system terminal where the collector needs to be installed.
- After installation is complete, click Next to proceed.
- Select a source template (for example, Apache source template) to start collecting logs from all linked collectors, then proceed with the data configuration.
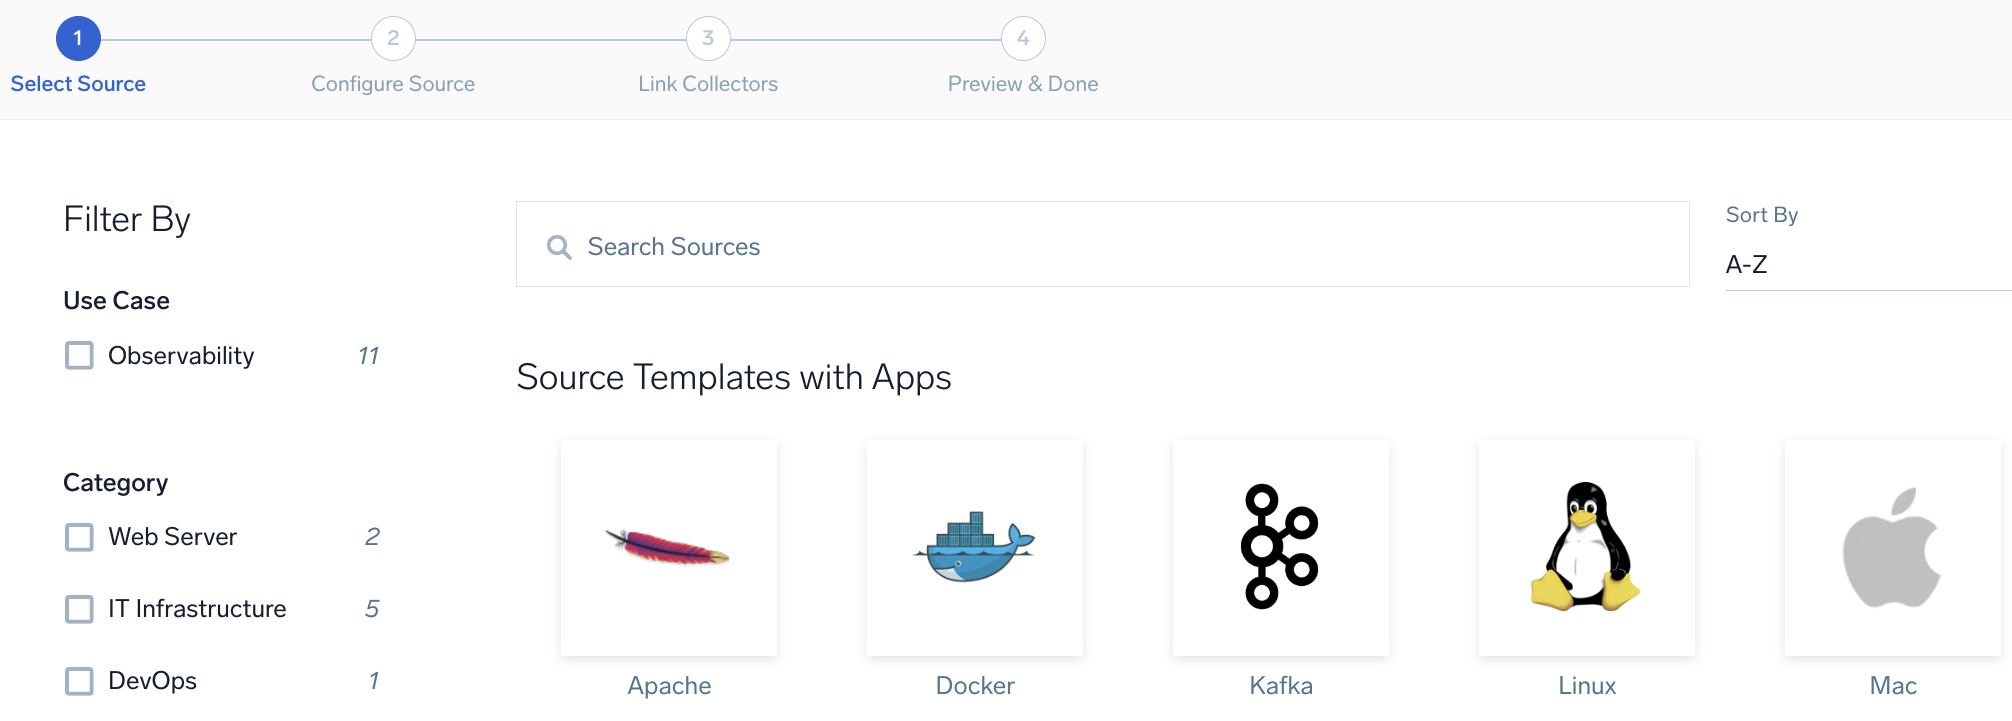
To revisit this screen later: From the Classic UI, select Manage Data > Collection > Source Template. From the New UI, select Data Management and under Data Collection select Source Template.
Step 2: Configure the source template
In this step, you will configure the YAML required for Windows collection. Below are the inputs required for configuration:
- Name. Name of the source template.
- Description. Description for the source template.
Logs collection
- Fields/Metadata. You can provide any customer fields to be tagged with the data collected. By default, Sumo Logic tags
_sourceCategorywith the valueotel/windows. - Windows Event. In this section you can select choose among the most widely used Windows event channel for which Windows event log collection will be enabled. You can also provide Custom Event Channels providing any customer event channel for which event logs are to be collected.
- Forward to SIEM. Check the checkbox to forward your data to Cloud SIEM.
Metrics collection
- Metrics. Select the metric scrappers you want to enable. By default, metric collection for CPU, memory, disk, load, file system, network and paging are enabled, and process metric collection is disabled.
Enable process metric collection (optional)
By default, the collector will not send process metrics to Sumo Logic. This is because the number of processes running on a host can be very large, which would result in a significant increase in Data Points per Minute (DPM).
Click the Enable process metric collection checkbox to collect process-level metrics.
- Name of process. Add the list of process names.
- Include/Exclude the above pattern. Signifies if you want to exclude or include the metrics for the processes listed previously.
- Match type for process name. Select if the process name given should be considered for a strict match with the host machine processes or if it should be considered as regex when matching.
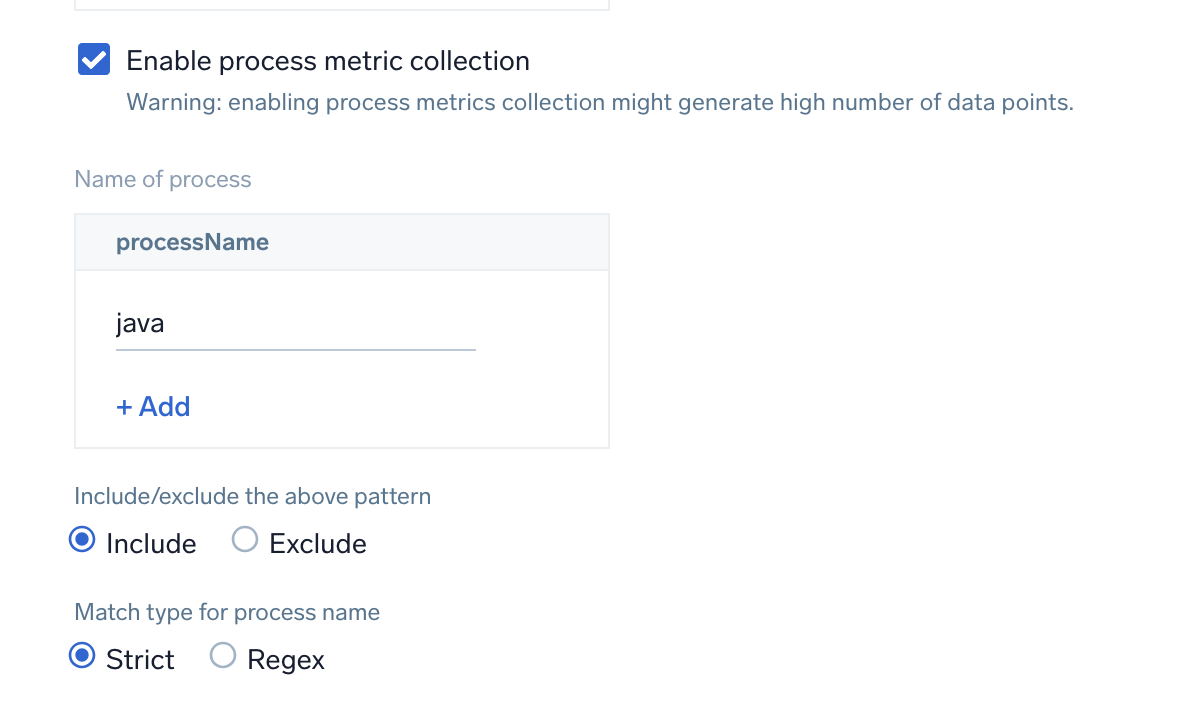
If you need to edit the process list in the future, you can do this manually in the OTEL config yaml by adding or removing in the names list under process scrapper.
process:
  include:
    names: [ <process name1>, <process name2> ... ]
    match_type: <strict|regexp>
- Scan Interval. The frequency at which the source is scanned.
- Processing Rules. You can add processing rules for logs/metrics collected. To learn more, refer to Processing Rules. For masking windows event logs, refer to Mask Rules for Windows Source Template.
Step 3: Push the source template to the desired remotely managed collectors
A new source template will always be created with the latest version of the source template.
Follow the below steps to create a data collection configuration to gather the required logs and link them to all the collectors with the help of collector tags.
- Complete the source template form with the name and file path for your logs (for example, error logs or access logs), then click Next.
- Under Link Collectors, you will have the option to link the collectors using the collector name or by adding tags to find the group of collectors (for example,
application = Apache).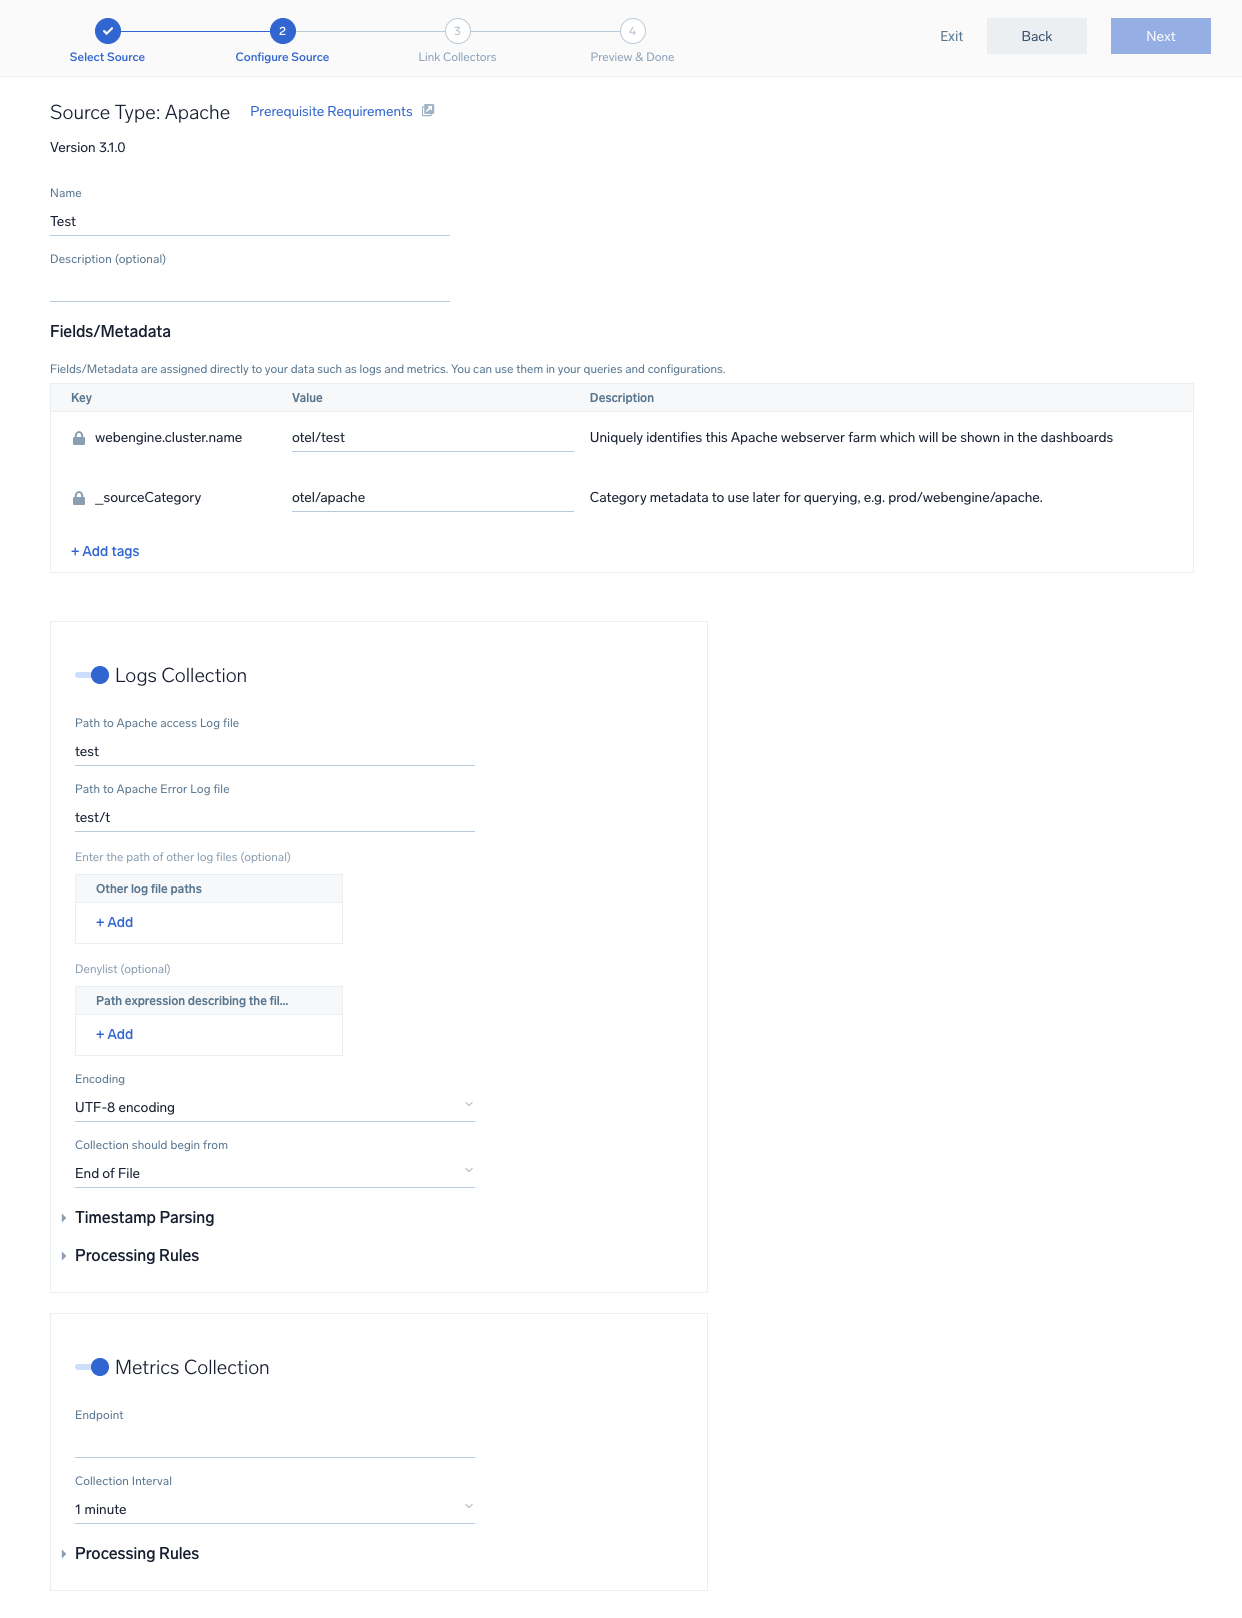
- Preview and confirm the collectors that will be linked (fetched automatically) to the newly created source template.
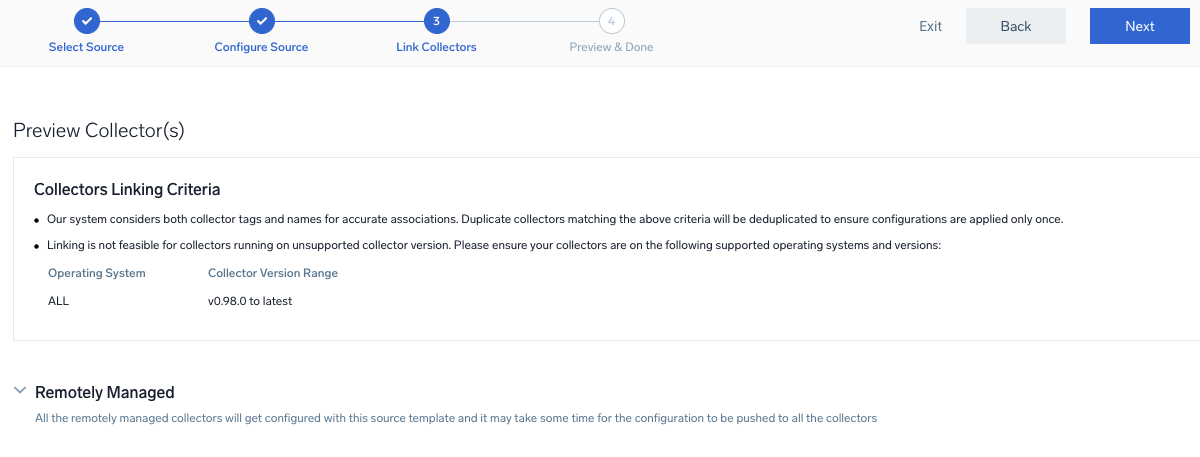
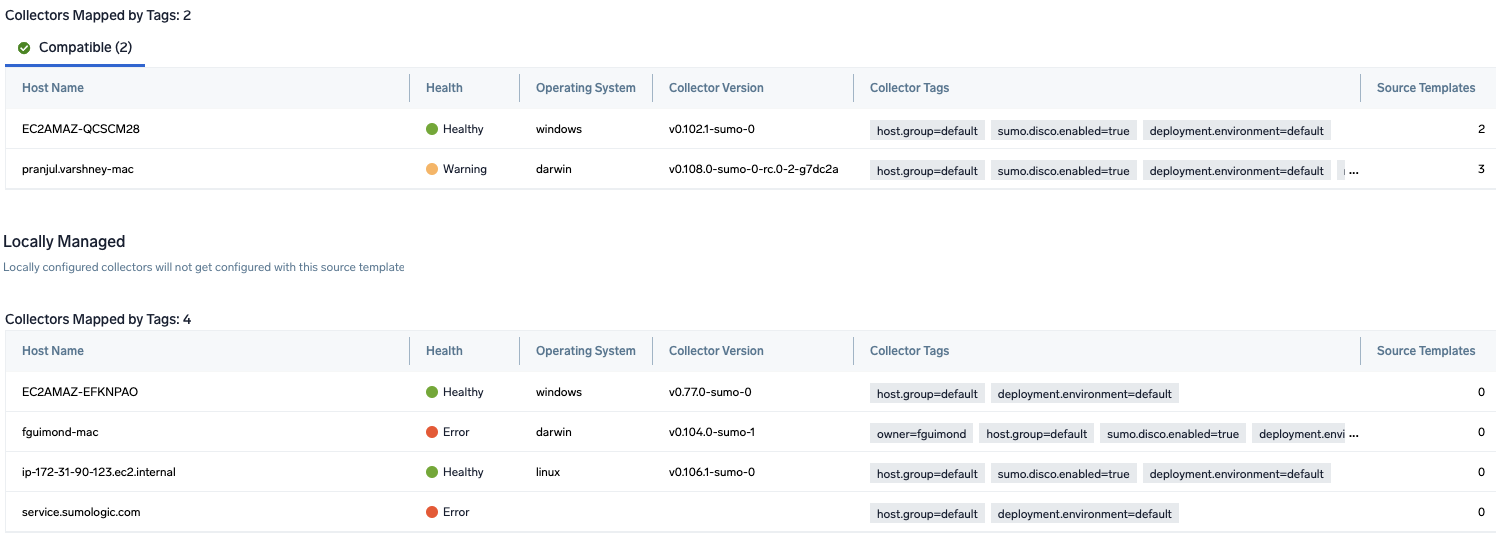
- Click Next to complete the source template creation. In the background, the system will apply the configuration to all the linked collectors and will start collecting the respective telemetry data from the remote host (in the example, it would start collecting Apache error logs).
- Click the Log Search or Metrics Search icons to search for and analyze your data collected for this source template.
If the agent crashes with the following error log:
failed to start service: cannot start pipelines: failed to start "windowseventlog/(channel_name)" receiver: start stanza: failed to open local subscription, error: failed to subscribe to (channel_name) channel: The specified channel could not be found.;
It means that the specified event channel name in the custom event channel list does not exist on the remote host where the source template is being pushed. To resolve this issue, you can either remove the non-existent channel name from the source template (ST) or upgrade the Sumo Logic OpenTelemetry Collector agent to version 0.130.1 or later and the ST to version 8.0.0 or later.
Refer to the changelog for information on periodic updates to this source template.