2023 Archive
This is an archive of the 2023 Sumo Logic Service Release Notes.
November 29, 2023 (Manage Account)
Download SAML Metadata XML
We're happy to announce that you can download the metadata XML of your SAML configurations. The service provider metadata XML allows you to easily share the Sumo Logic configuration information with your identity provider administrators, assisting them with the SAML setup process.
From the SAML configuration details screen, click the Download Metadata XML button to download the metadata XML for that configuration. You can also use the getSamlMetadata API to export the metadata XML.
For more information, see our documentation on how to download metadata XML.
November 28, 2023 (Observability)
Logs for Monitoring and Troubleshooting for AWS
We are excited to announce several improvements to our AWS Observability solution.
- AWS Observability Hub. A landing page to access all the capabilities of the Sumo Logic AWS Observability solution, including the out-of-the-box dashboards, alerts, and performance benchmark reports, all from a single place.
- Log Searches for Troubleshooting. Quickly troubleshoot issues within your AWS environment with pre-baked log searches. No need to learn the search query syntax. These new searches can be accessed from the new hub page.
To learn more about the AWS Observability solution and how to set it up, check out our documentation here.
To access these new capabilities, you just have to install the AWS Observability solution. If you have one already installed, congratulations! You'll gain access to these new features automatically.
November 27, 2023 (Apps)
Cloud Infrastructure Security for AWS - Preview
We’re excited to announce a preview of Cloud Infrastructure Security for AWS. This solution unifies views of active threats, security control failures, and suspicious activity across your AWS environment to give you security posture visibility at a glance.
Here are some of the key features the new solution offers:
- Risk overview. See a summary of all resources that pose risks in a single dashboard that rolls up the findings from other dashboards. Get an action plan for addressing the most important areas of concern.
- Active threats. See active threats in APIs, resources, and storage.
- Misconfigurations. See areas in your environment that need to be addressed because they fail best practice security controls.
- Suspicious activity assessment. See suspicious activity across users, web interactions, networks, and Identity Access Management (IAM).
To learn how you can set up and use Cloud Infrastructure Security for AWS, and for preview limitations, check out our technical documentation here.
To use the solution, you are required to sign up and activate Amazon GuardDuty and AWS Security Hub.
November 21, 2023 (Apps)
New Partner Apps
We've released two new Partner apps for Sumo Logic:
- Dataminr Pulse for Sumo Logic enables rapid identification and mitigation of emerging threats so you can deliver more time to detection and response.
- Jamf Protect for Sumo Logic empowers security teams with in-depth visibility into Mac security events, providing integrated visualization for enriched investigation into macOS threat alerting with tuned endpoint telemetry data streams. This app supports data streams from the macOS security and Jamf security cloud portals, resulting in one single collection point for all endpoint and network-based events that occur across your Apple device fleet. With the Jamf Protect app, Sumo Logic users can easily integrate their Apple security data, gain valuable insights into Apple's security posture, and quickly respond to security incidents.
November 7, 2023 (Alerts)
Time Zone Settings for Monitors
We've rolled out the ability to designate a Preferred Time Zone when you're setting up alert monitor notifications. Learn more.
Currently, we support time zone specifications within an email action object. This is being deprecated for API and Terraform users only and will not be supported effective February 2024.
November 2, 2023 (Observability)
AWS Observability 2.7.0
We are excited to announce AWS Observability 2.7.0. This update includes:
- Support for Amazon RDS - new out-of-the-box dashboards based on RDS logs including MySQL to support diagnosing slow queries
- Support for Terraform 5.x
- Updated Lambda functions runtime version to Python 3.11 includes functions for auto-subscription to CloudWatch log groups, CloudWatch Logs forwarder functions, or functions used to set up CloudWatch Metric Stream.
To learn more, see Updating Your AWS Observability Stack.
October 27, 2023 (Manage Account)
Role Based Search Index
We're excited to announce that you can use roles to restrict access to specific data in search indexes. When you create a role, you can select Index based filters to allow access to data based on indexes, or you can select Advanced filter to define a dataset to allow access based on search criteria. This ensures that users only see the data they are supposed to.
This feature is in Beta. To participate, contact your Sumo Logic account executive or our Support Team.
October 25, 2023 (Manage Account)
Scheduled View ID
We’re excited to introduce scheduled view ID on scheduled view details pane, which enables faster debugging and improved internal operation efficiency. Learn more.
October 25, 2023 (Collection)
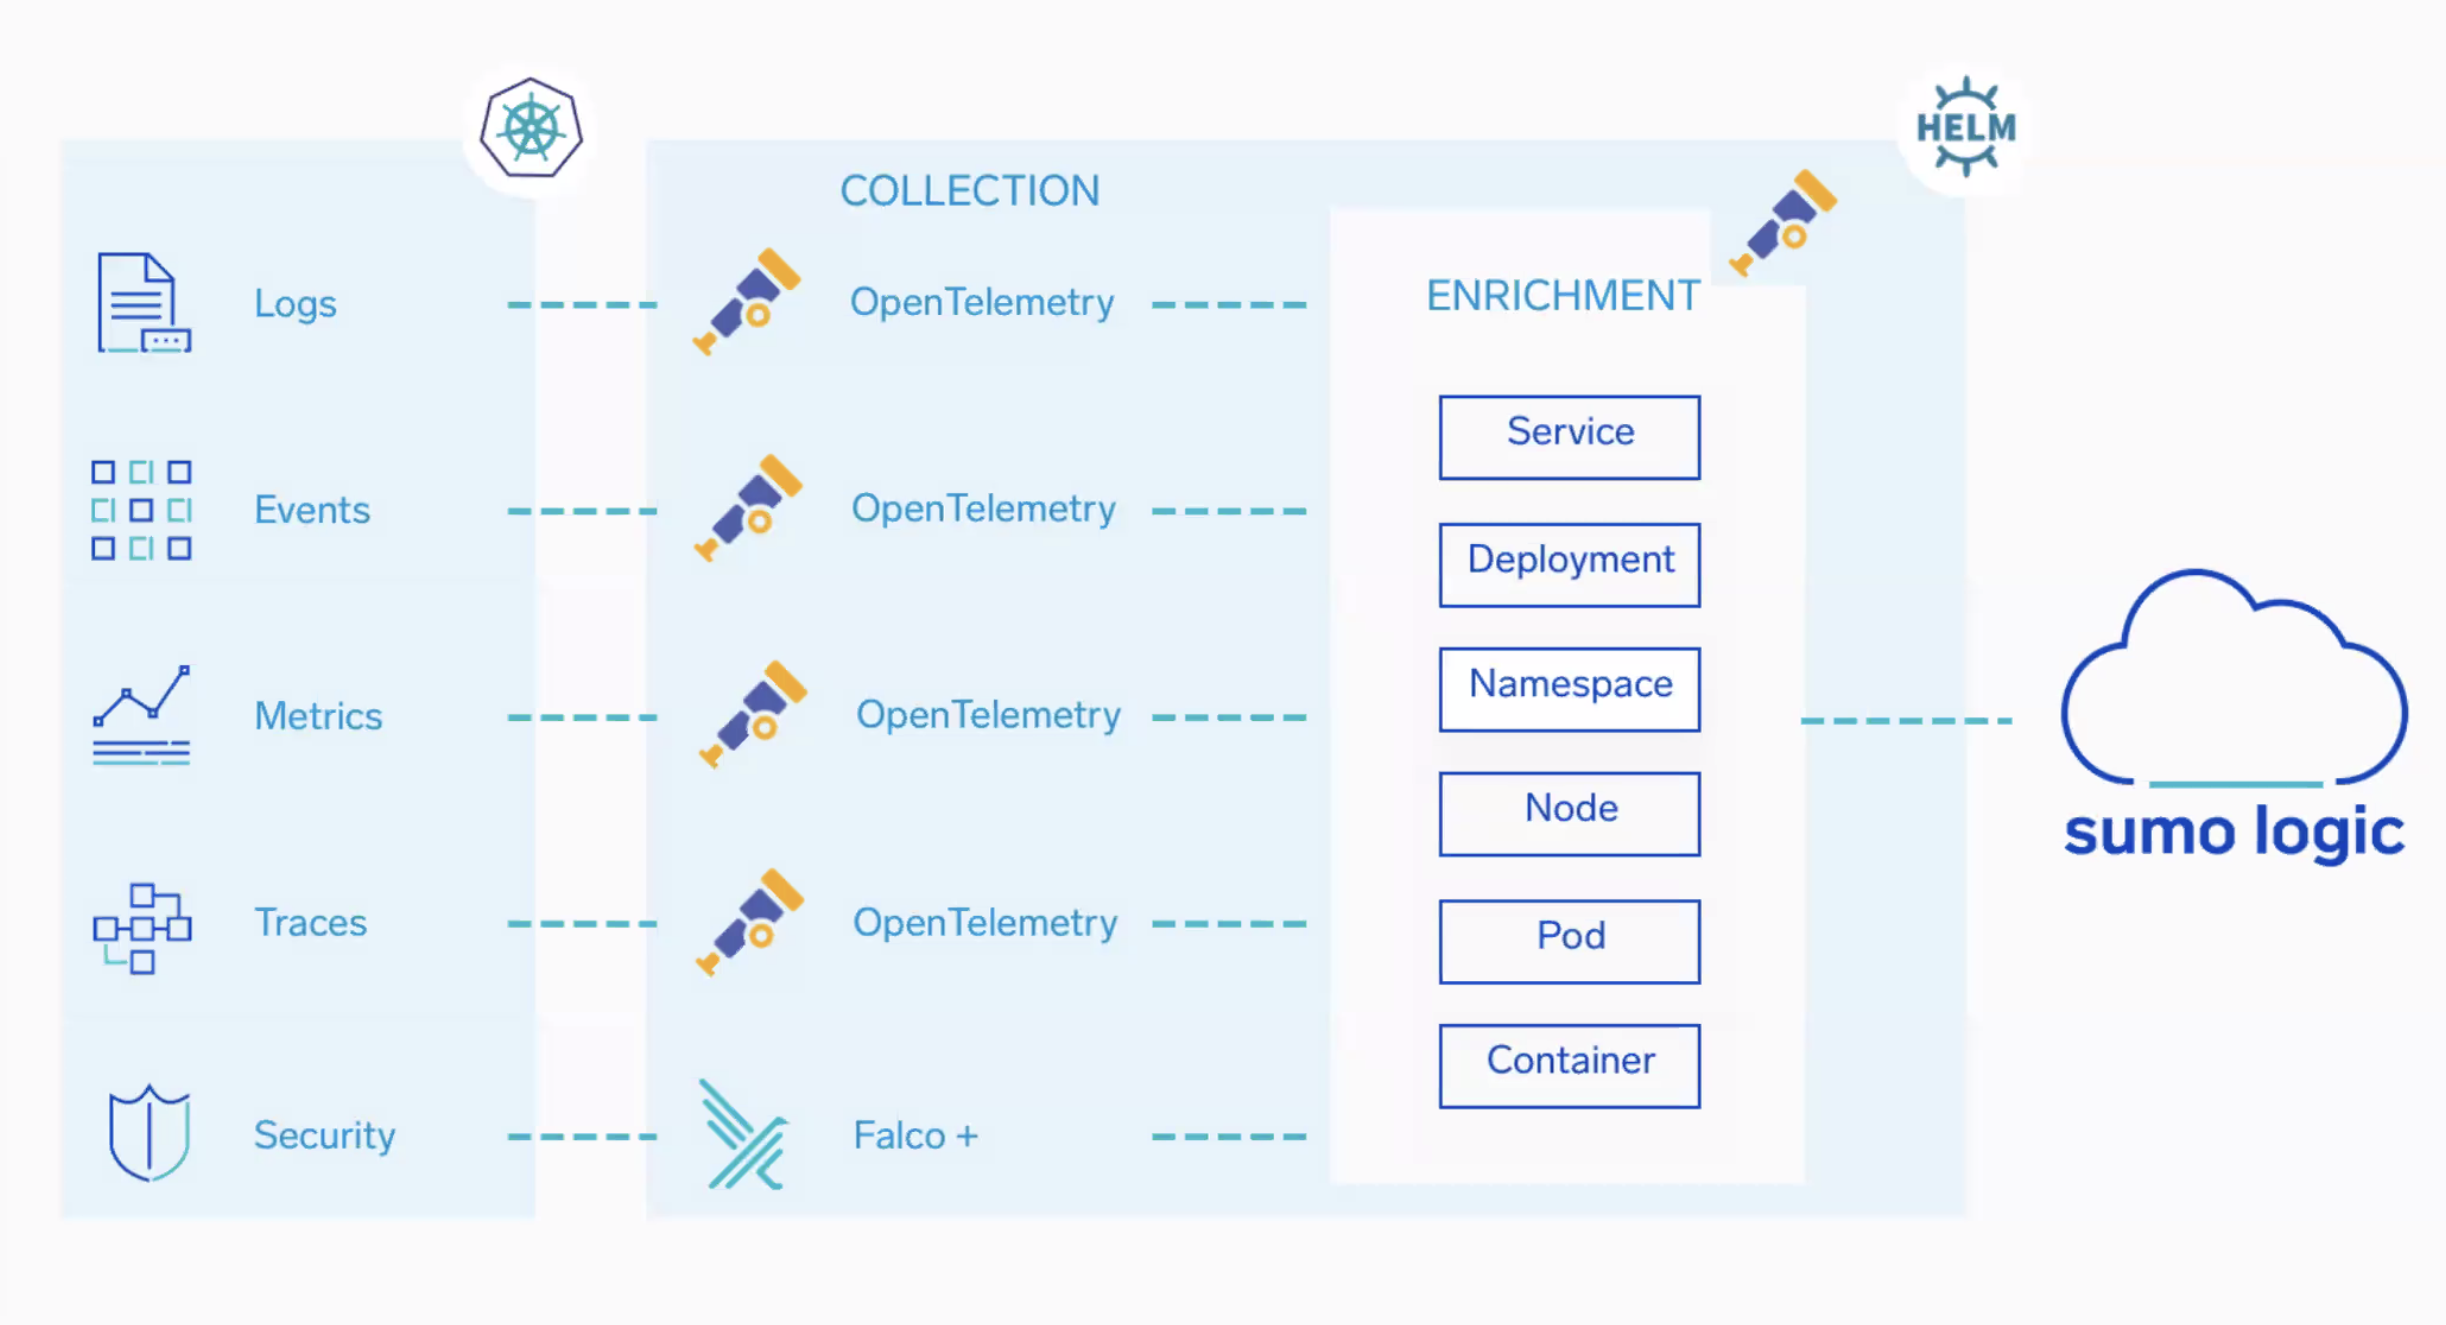
Kubernetes Helm v4 Chart Update
We’re excited to announce that we've updated the Sumo Logic Kubernetes Helm Chart from v3 to v4. With this update, our Helm chart is now packaged to collect logs, events, and metrics using the more cost-effective and faster OpenTelemetry collector. To further streamline this solution, we've also removed dependencies on third-party solutions like Fluentbit, Fluentd, and Prometheus.
To learn more, see Set up Data Collection for Kubernetes and the diagram below, which distinguishes support available on Falco for collection and enrichment.
October 18, 2023 (Apps)
New Setup Guides for Security
We’re excited to announce the release of seven new setup guides to our App Catalog, enabling you to connect various services to Sumo Logic. These setup guides provide easy step-by-step configuration instructions for setting up data collection, allowing you to explore your data within Sumo Logic.
The new security setup guides are:
- Cisco AMP
- Crowdstrike FDR
- CrowdStrike FDR Host Inventory
- CSE AWS EC2 Inventory
- CyberArk EPM
- Netskope WebTx
- Sophos Central
October 5, 2023 (Apps)
New Setup Guides
We’re excited to announce the release of 25 new setup guides to our App Catalog, enabling you to connect various services to Sumo Logic. These setup guides provide easy step-by-step configuration instructions for setting up data collection, allowing you to explore your data within Sumo Logic.
The new setup guides are:
- Automation Anywhere
- Banzai Cloud
- BetterCloud
- Bit Defender
- Cribl
- Delinea Secret Server
- Doppler
- Egnyte
- Lacework
- NxLog
- OpsRamp
- Oracle Cloud Infrastructure
- Palo Alto Networks Cortex Data Lake
- Prometheus
- Red Hat OpenShift
- rsyslog
- Ruby on Rails
- StatsD
- syslog-ng
- Tanium
- Terraform
- VMware AirWatch
- VMWare Tanzu Application Services
- VMware vRealize Log Insight
- VMware vRealize Operations Manager 8 Enterprise
October 5, 2023 (Apps)
Setup Guides for Azure Services
We’re excited to announce the release of 43 new setup guides to our App Catalog, enabling you to connect various Azure services to Sumo Logic. These setup guides provide easy step-by-step configuration instructions for setting up data collection, allowing you to explore your data within Sumo Logic.
The new setup guides for Azure services are:
- Azure Analysis Services
- Azure API Management
- Azure App Configuration
- Azure App Service Environment
- Azure App Service Plan
- Azure Application Gateway
- Azure Automation
- Azure Backup
- Azure Batch
- Azure Blob Storage
- Azure Cache for Redis
- Azure Cognitive Search
- Azure Cosmos DB
- Azure Cosmos DB for PostgreSQL
- Azure Data Explorer
- Azure Data Factory
- Azure Database for MariaDB
- Azure Database for MySQL
- Azure Database for PostgreSQL
- Azure Event Grid
- Azure Event Hubs
- Azure Front Door
- Azure Functions
- Azure HDInsight
- Azure IoT Hub
- Azure Key Vault
- Azure Load Balancer
- Azure Logic App
- Azure Machine Learning
- Azure Monitor Logs
- Azure Monitor Metrics
- Azure Network Interface
- Azure Notification Hubs
- Azure Public IP addresses
- Azure Relay
- Azure Service Bus
- Azure SQL Elastic Pool
- Azure SQL Managed Instance
- Azure Storage
- Azure Stream Analytics
- Azure Synapse Analytics
- Azure Virtual Network
- Microsoft Dynamics 365 Customer Insights
October 5, 2023 (Apps)
Setup Guides for Amazon Web Service (AWS)
We’re excited to announce the release of 41 new setup guides to our App Catalog, enabling you to connect various AWS services to Sumo Logic. These setup guides provide easy step-by-step configuration instructions for setting up data collection, allowing you to explore your data within Sumo Logic.
The new setup guides for AWS services are:
- Amazon AppFlow
- Amazon AppStream 2.0
- Amazon Athena
- Amazon Chime
- Amazon Chime SDK
- Amazon CloudSearch
- Amazon Cognito
- Amazon Connect
- Amazon Data Lifecycle Manager
- Amazon DocumentDB
- Amazon DynamoDB Accelerator (DAX)
- Amazon EC2 Auto Scaling
- Amazon EC2 Elastic Graphics
- Amazon EC2 Spot Fleet
- Amazon Elastic Block Store
- Amazon Elastic File System
- Amazon EMR
- Amazon EventBridge
- Amazon GameLift
- Amazon MSK Prometheus
- Amazon OpenSearch Service
- AWS Amplify
- AWS Application Migration Service
- AWS App Runner
- AWS AppSync
- AWS Backup
- AWS Certificate Manager
- AWS Chatbot
- AWS Client VPN
- AWS CloudHSM
- AWS CodeBuild
- AWS Database Migration Service
- AWS DataSync
- AWS Direct Connect
- AWS Elastic Beanstalk
- AWS Global Accelerator
- AWS Ground Station
- AWS HealthLake
- AWS OpsWorks
- AWS Private Certificate Authority
- AWS Security Quickstart
October 4, 2023 (Apps)
Setup Guides for Webhook-based Services
We’re excited to announce the release of 32 new setup guides to our App Catalog, enabling you to connect various webhook-based services to Sumo Logic. These setup guides provide easy step-by-step configuration instructions for setting up data collection, allowing you to explore your data within Sumo Logic.
The new setup guides for Webhook-based services are:
- Buddy
- Bugsnag
- ConfigCat
- Datadog
- EMnify
- Firefly
- Flagsmith
- Grafana OnCall
- Gremlin
- Hasura
- Honeybadger
- iLert
- Mailgun
- mParticle
- NeoLoad
- Netlify
- New Relic Alert
- Nobl9
- PaperTrail
- Postman
- Pusher
- Rollbar
- SendGrid
- Sentry
- SIGNL4
- Split
- Squadcast
- Stripe
- Superwise
- Uptime.com
- Zebrium RCaaS
- Zenduty
October 4, 2023 (Apps)
Setup Guides for Google Cloud Platform (GCP) Services
We’re excited to announce the release of 37 new setup guides to our App Catalog, enabling you to connect various GCP services to Sumo Logic. These setup guides provide easy step-by-step configuration instructions for setting up data collection, allowing you to explore your data within Sumo Logic.
The new setup guides for GCP services are:
- GCP Metrics
- Google Cloud AlloyDB for PostgreSQL
- Google Cloud API Gateway
- Google Cloud APIs
- Google Cloud Armor
- Google Cloud Auto Scaler
- Google Cloud Backup for GKE
- Google Cloud BigQuery BI Engine
- Google Cloud Bigtable
- Google Cloud Certificate Authority Service
- Google Cloud Certificate Manager
- Google Cloud Composer
- Google Cloud Dataflow
- Google Cloud Dataproc Metastore
- Google Cloud Dataproc
- Google Cloud Datastore
- Google Cloud Datastream
- Google Cloud Deploy
- Google Cloud Filestore
- Google Cloud Firebase
- Google Cloud Firestore
- Google Cloud Fleet Engine
- Google Cloud Interconnect
- Google Cloud Logging
- Google Cloud Memorystore for Redis
- Google Cloud Net App Cloud Volumes Service
- Google Cloud Network Topology
- Google Cloud Pub/Sub
- Google Cloud Router
- Google Cloud Run
- Google Cloud Spanner
- Google Cloud Tasks
- Google Cloud TPU
- Google Cloud Trace
- Google Cloud Traffic Director
- Google Cloud Vertex AI
- Google Cloud VPN
October 2, 2023 (Dashboards)
Classic Dashboards Deprecation
Effective today, Sumo Logic has removed the ability to create or copy Classic Dashboards from within Sumo Logic. We understand that you may have existing classic dashboards that you may still need to access and use. To make this transition as seamless as possible, we have implemented the following:
- Automatic Migration. If you have edit permissions to a classic dashboard, when you open the dashboard we will automatically create a new copy of the dashboard.
- Choice of Version. Once your classic dashboard has been migrated, when opening a classic dashboard we will provide you the option to open the new version of the dashboard or continue with the classic version.
Once you have had a chance to review your new dashboards, we recommend deleting the classic versions of your dashboards.
On January 8, 2024, Sumo Logic will no longer support the viewing of classic dashboards and will begin a process to auto migrate your remaining classic dashboards. Please note that this migration may take a little time, so you may still encounter classic dashboards within your account during this period. Here is what you can expect beginning January 8:
Automatic Migration. When opening a classic dashboard from the Library or via a previously shared link, the classic dashboard will be automatically migrated and you will be redirected to the new version of that dashboard.
September 28, 2023 (Search)
Log Message Inspector
We're excited to announce the release of Log Message Inspector, a new feature that allows you to quickly identify the type of each log message, raw log message, message time, receipt time, and the parameter values associated with the query in one pop-up screen. Learn more.
September 27, 2023 (Collection)
Cisco Vulnerability Management
We're excited to announce the release of our new cloud-to-cloud source for Cisco Vulnerability Management. This source collects assets and vulnerabilities data using the Asset API and Vulnerability API. Learn more.
September 26, 2023 (Manage Account)
Sumo Orgs - Export Detailed Child Usages
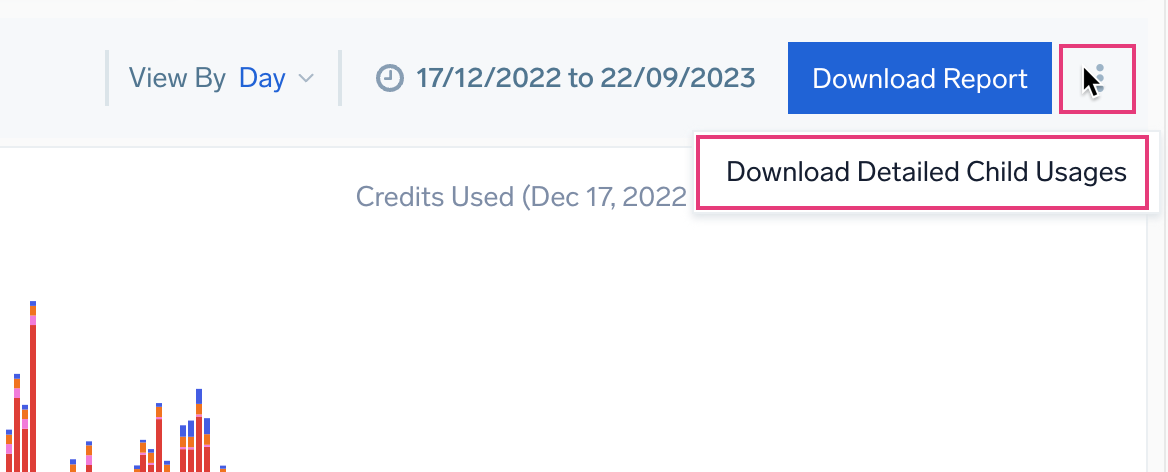
We're excited to introduce a new addition to Sumo Logic account management. Org parent account users can now download detailed child org usage data directly from the account overview page.
Here's how to export detailed child usages:
- Navigate to the Account Overview page.
- Click on the kebab button and select Download Detailed Child Usages, to export/dowload the detailed child usages.
September 22, 2023 (Apps)
Heroku app
We're excited to announce the release of the new Heroku app for Sumo Logic. This app is used to monitor Heroku applications with preconfigured dashboards that provide insights into request timings, error trends, and memory utilization to monitor Heroku infrastructure, applications, metrics, and error scenarios.
Check out our technical documentation here to learn how to set up and use our Heroku app.
September 14, 2023 (Apps)
Tenable app
We're excited to announce the release of the new Tenable app for Sumo Logic. This app leverages Sumo Logic Cloud-to-Cloud Tenable source to gain comprehensive visibility and actionable insights into your organization's security posture. Here are some of the key features that this app offers:
- Vulnerability Assessment. Perform in-depth vulnerability assessments across your infrastructure using the Tenable Vulnerabilities API.
- Audit Event Monitoring. Monitor and analyze critical audit events within your organization using the Tenable Audit Events API.
Check out our technical documentation here to learn how you can set up and use the Tenable app for Sumo Logic.
September 8, 2023 (Search)
Elapsed Query Timer Enhancement
Bug fix - We've enhanced the elapsed query timer so that while a query is running, and your users navigate to a different Sumo internal tab or browser tab and then return, the timer no longer resets to zero seconds but instead displays the precise amount of time that has passed.
September 6, 2023 (Collection)
Abnormal Security
We're excited to announce the release of our new cloud-to-cloud source for Abnormal Security. This source collects abnormal threat log from the Abnormal Security platform using the Abnormal Security API. Learn more.
August 23, 2023 (Metrics)
Grafana plugin
We have released a new version (v1.1.0) of the Sumo Logic Grafana plugin that adds support for log queries (both aggregated and non-aggregated). This version also includes small enhancements and bug fixes.
August 22, 2023 (Alerts)
Monitor Tags
We've added the ability to tag your Monitors, allowing you to better categorize, search, filter, and correlate Monitors with other data. Tags are key/value pairs that allow you to apply additional metadata to your Monitors beyond their name and description. Example tag: team=alerting, where the key is team and value is alerting. Learn more.
August 17, 2023 (Reliability Management)
Operator Support for Metrics-Based SLOs
You can now use metrics operators in SLO queries. The metrics query specified in your SLO should have a quantization specified after the selector. You can specify one or more operators in the query for SLO. Learn more.
August 7, 2023 (Dashboards)
Dashboard Time Range Enhancements
We are excited to announce a new set of changes that enhance the time range management capabilities within dashboards and dashboard panels. With these updates, you'll have more control over time ranges, making it easier to investigate specific periods of interest and analyze data effectively. Here's what's included in this update:
- Dashboard-Level Time Range Override. When setting a dashboard-level time range, the new time range will now be temporarily applied to all panels displayed on the dashboard. The updated dashboard time range is applied only for the current viewer of the dashboard unless saved as the new dashboard default.
- Panel-Level Time Range Override. We've introduced the ability for users to temporarily override panel-level time ranges, allowing you to customize the time range for individual panels without changing the time range for other viewers of the dashboard. The updated panel time range is applied only for the current viewer of the dashboard unless saved as the new panel default.
- Time Range Inheritance on Adding Panels. When adding a panel to an existing dashboard from the Log Search page, you'll now have the flexibility to specify whether the new panel inherits the time selection of the query as configured or if it inherits the dashboard-level time range. This gives you more control over how time ranges are applied to the new panel.
See our help documentation here to learn more about setting time ranges within dashboards and panels.
August 3, 2023 (Alerts)
Muting Schedules
New - we're happy to announce the release of Muting Schedules, a new feature that allows you to pause monitor notifications according to a schedule that you define. You can apply this setting to individual monitors and/or folders. For folders, this will mute all nested monitors and subfolders.
Some scenarios where you might want to mute your monitor notifications include your org's scheduled system maintenance and off-business hours activity. Learn more.
July 25, 2023 (Apps)
New Security Apps and Connectors
At Sumo Logic, we are committed to continuously providing our customers with new and updated applications and integrations to allow for easy and accessible data collection and powerful visualization from various sources, no matter where it is.
Over the past quarter, the Sumo Logic team has been hard at work crafting cloud-to-cloud connectors for sources including a generic Google BigQuery cloud-to-cloud connector that enables you to set up an incremental pull to bring any data in BigQuery into Sumo Logic. For instance, this is now the standard for ingesting Gmail logs. The team has also created applications to further help customers better analyze data from tools such as Cisco Meraki.
With a total of 13 new cloud-to-cloud connectors and 14 new security apps, providing out-of-the-box queries and visualizations, Sumo Logic helps users gain the most insight out of their data.
Here’s the complete list of all new cloud-to-cloud connectors from this past quarter:
- Asana Audit Logs
- Cato Networks
- Cisco Meraki
- Citrix Cloud
- Crowdstrike Falcon Data Replicator
- DocuSign Monitor
- Druva
- Google BigQuery
- KnowBe4
- Microsoft O365 Exchange Trace Logs
- Rapid7 InsightVm
- Webex
- Zero Networks Segment Audit and Activities logs
And here is the list of new security apps added to the catalog:
- Airtable
- Dropbox
- Microsoft Graph Azure Active Directory Reporting
- Microsoft Graph Identity Protection
- Microsoft Graph Security
- Microsoft O365 Exchange Trace Logs
- Mimecast
- Miro
- Proofpoint on Demand
- Proofpoint Targeted Attack Protection
- Palo Alto Cortex XDR
- Rapid7
- SentinelOne
- Symantec Web Security Service
Did you know Sumo Logic has an active community of users generating new content as well? In case you missed it, the Sumo Logic Community Ecosystem, which launched in February, is the perfect conduit for security practitioners to share and rate open-source applications. Below is the current list of content from the Community Ecosystem:
- Amazon CloudSearch
- Amazon RDS - Enhanced Monitoring
- Aruba Wireless - Auth Manager & WMS Module
- Aruba Wireless - TACACS
- AWS CloudTrail - User Activity
- AWS EC2 - Host Metrics for OpenTelemetry
- AWS Health Events
- Centrify
- Checkpoint Firewall
- Chef
- Cisco Sourcefire
- Citrix Netscaler VPN
- Citrix XenServer
- Fortinet Fortigate Firewall
- F5 Distributed Cloud Services
- GCP Loud Balancer Metrics
- JAMF
- Microsoft Defender for Endpoint
- MISP Threat Intelligence
- Open Source CSPM
- Palo Alto Cortex XDR
- Proofpoint Targeted Attack Protection (TAP)
- Sophos Central
- Sumo Logic Traces
- Symantec Web Security Service (WSS)
- Tenable.io
- Qualys VMDR & Inventory
July 21, 2023 (Reliability Management)
Saved Filter Views for SLOs
New - We've added the ability to save views for SLOs, allowing you to create views using filters on SLOs list page and customize your SLO insights experience based on your preferences and focus on the SLOs you care about most.
July 20, 2023 (Metrics)
Late Arriving Metrics Limit
We are making some changes to Metrics ingest and storage. Metrics reported with a timestamp older than 24 hours ago or newer than 24 hours in the future from the time they are reported will be dropped. These changes are made to make our metrics backend system more performant, efficient, and reliable.
The update should not have any impact on your usage of Sumo Logic, unless you were specifically sending old metrics data to the platform. Check out more details here.
July 12, 2023 (Dashboards)
Public Dashboards
Our new Public Dashboards feature enables you to share your dashboard with users who do not have a Sumo Logic account. You can share with the world, or fine tune with your security policies to restrict unauthenticated access from specific IP addresses.
Check out our technical documentation here to learn more about public dashboards.
July 10, 2023 (Search)
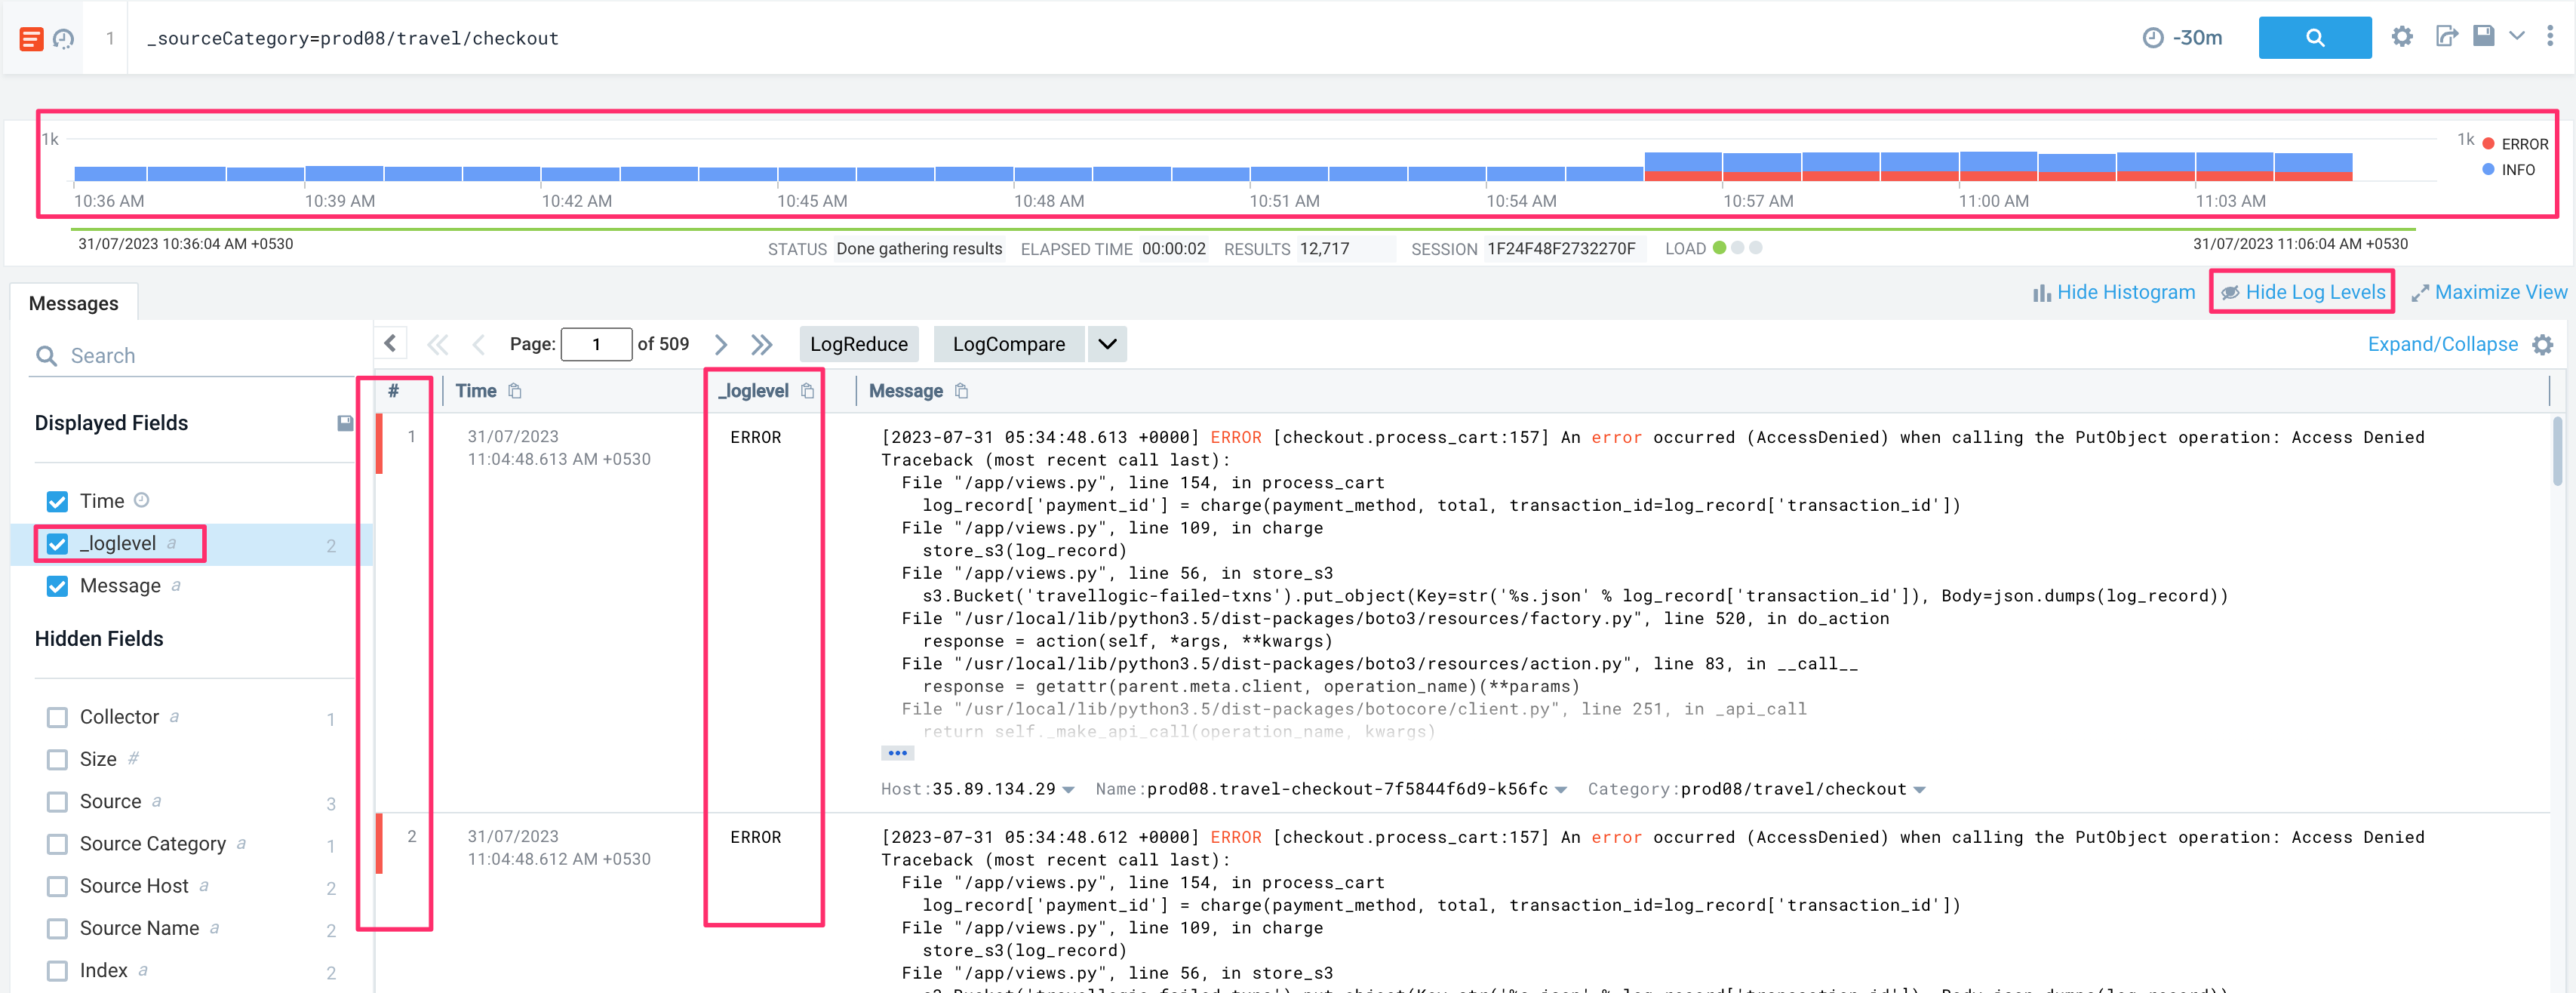
Automatic Log Level Detection
New - We're excited to announce automatic log level detection for Log Search queries. You can now quickly identify anomalies without having to search through large volume of logs to find high severity issues.
With this update, you can now visualize and filter log-level distribution in both your Histogram results and Messages table. This allows you to view messages of specific log level(s) in the same view. Learn more.
July 10, 2023 (Collection)
JumpCloud Directory Insights
We're excited to announce the release of our new cloud-to-cloud source for JumpCloud Directory Insights. This source collects Directory Insights Events from the JumpCloud platform using the REST API. Learn more.
July 7, 2023 (Collection)
CrowdStrike Spotlight
We're excited to announce the release of our new cloud-to-cloud source for CrowdStrike Spotlight. This source collects combined endpoint vulnerabilities data using the CrowdStrike Spotlight API. Learn more.
July 6, 2023 (Collection)
Code42 Incydr
We're excited to announce the release of our new cloud-to-cloud source for Code42 Incydr. This source collects alerts, file events, and audit logs (audit events) using the Incydr API. Learn more.
July 5, 2023 (Apps)
Next-Gen Apps
In response to many requests for better App management, we are happy to announce the release of our new Next-Gen Apps located within a new section of the Applications Catalog. Sumo Logic's next generation of apps introduce features not previously available within Classic Apps and simplifies the management and maintenance of apps. Learn more.
Key Features
- Role-based access controls, which ensure that only authorized individuals within your organization can install, uninstall, or update apps. To perform these actions you must be a member of the default Administrator role. Sumo Logic will be providing a new “Manage Apps” role capability soon, which can be used to grant these permissions to additional roles.
- To identify which apps have been installed within your org, Next-Gen app icons will display a badge indicating their installed status.
- When an update to an installed App becomes available, these new apps will provide a badge noting there is an update available. An upgrade can then be applied with a simple click within the App Catalog.
- Installed apps can be uninstalled and removed through the App Catalog, making it easy to clean up apps you no longer use.
- Additional filter options make it easy to find your installed or upgradeable apps.
- To support the ability to upgrade and to make app content easier to locate, app content will be installed into a shared “Installed Apps” folder of the Library.
- To support the ability to upgrade and to make sure upgrades do not overwrite any customizations you may apply, the content installed by an app is immutable. If you wish to customize the content you will need to first make a custom copy of the content.
While the initial set of Next-Gen apps is designed to help you get started using the Sumo Logic Distribution of the OpenTelemetry agent, we haven't forgotten about those who'd like to continue sending data through our Installed Collector and Hosted Sources.
Over the coming year, we will be converting all existing Classic Apps to the Next-Gen framework and will continue to provide support for these collection methods. In the meantime, our Classic Apps will remain available to you within the App Catalog.
We'll also be making additional improvements within the Apps Catalog to assist with better search, filtering, upgrade notifications, and management. Stay tuned for these future updates.
July 4, 2023 (Metrics)
Increased Cardinality Limit
We've increased the maximum number of time series processed by a single aggregate query to 50,000. Learn more.
June 29, 2023 (Manage Account)
Account Page Improvements
We've enhanced our Account Overview page to make it easier for you to understand how your credits are being allocated. With Details of Credit Usage, you can separate out your ingest, storage, and scan credit burn rates as Promotional Credits covers any promotional credits you are using with the account. You can also filter your view by day, week, and month, or view by time period. And you can download these reports as a CSV.
June 28, 2023 (Metrics, Dashboards)
Download Visualization as Images and CSV
We've enhanced the flexibility and usability of Metrics and Dashboards with our latest update. You now have the ability to download visualization as images (PNG files) or CSV files, allowing you to copy them to the clipboard as CSV or download CSV files (available only for table visualization).
Image Downloads. Download visualization as PNG images directly from the Metrics and Dashboards interface. This feature is available for all types of visualizations, including metric queries, log queries, and spans queries on both the Dashboard and Spans tabs.
CSV Downloads (Table Visualizations Only). Extract the underlying data from the table visualization and download it as CSV files.
Supported Visualization. The new download options apply to a wide range of visualization available within Metrics and Dashboards, including:
- Time Series. Visualize trends and patterns over time with detailed time series charts.
- Categorical/Distribution. Explore categorical and distribution data using bar charts, pie charts, histograms, and more.
- Single Value. For single-value visualization, such as key performance indicators (KPIs) or summary statistics, you can now easily download them as images, ensuring the data is readily accessible for presentations or reports.
- Honeycombs. Download honeycomb visualization as images or CSV files.
Currently, you can download PNG files for all visualizations except maps, and CSV files are available only for table visualizations. However, in the upcoming releases, CSV download functionality will be extended to cover all types of visualizations.
June 28, 2023 (Collection)
Sophos Central Source
We have introduced a new approach where endpoint and alert data from Sophos Central platform are sent separately to Sumo Logic using two different APIs: Alerts and Endpoint. Learn more.
June 28, 2023 (Collection)
Druva Cyber Resilience
We're excited to announce the release of our new cloud-to-cloud source for Druva Cyber Resilience. This source collects realize events generated within the Druva Realize product using the Druva Realize Events API. Learn more.
June 26, 2023 (Metrics)
Enhancements to rate and delta Operators
We've added the following enhancements to the rate and delta operators, elevating the capabilities for analyzing metrics in time series data.
- Enhanced support to calculate the rate of change. The rate operator now offers two different modes for calculating the rate of change between data points.
- Regular rate mode. Calculates the rate of change between consecutive data points. It divides the difference in values by the difference in timestamps (in milliseconds) and scales it up to a per-second rate.
- Rate Over mode. Allows you to calculate the average rate of change over a specified time window. It considers the first and last metric values within the given interval, providing insights into metric trends and fluctuations over time.
- Support for Counters. Both the
rateanddeltaoperators now support a dedicated counter mode when working with counters. This counter mode accounts for counter resets and ensures that the operators always return non-negative values.- In the rate operator, use the
rate countersyntax to calculate the increase in counter value between data points, considering counter resets. - In the delta operator, use the
delta countersyntax to determine the difference in counter values between consecutive data points, accounting for counter resets.
- In the rate operator, use the
Leverage the new features in the rate and delta operators to make data-driven decisions and gain a detailed understanding of your metrics. Learn more about rate and delta operators.
June 22, 2023 (Collection)
Trellix mVision ePO
We're excited to announce the release of our new cloud-to-cloud source for Trellix mVision ePO. This source collects event logs using the Trellix mVision ePO API. Learn more.
June 20, 2023 (Manage Account)
Deactivation of Unused Access Keys
We’re happy to announce a new security option allowing administrators to set a custom policy for the number of days an API Access Key can go unused before being automatically deactivated. This setting allows administrators to tailor the feature to suit their organization’s specific security requirements. This enhances the security of your account by reducing the risk of unauthorized access through abandoned access keys. This ensures that only active access keys can be used to access your account and its resources.
June 15, 2023 (Collection)
Azure Blob Storage Collector
We are excited to announce the update of Azure Blob Storage Collector, featuring several enhancements and improvements. Here are some of the key highlights of this release:
- Upgraded Azure function runtime in BlockBlob reader. The BlockBlob reader is upgraded from Azure function runtime version 1.x to 4.x, which improves performance, reliability, and compatibility with the latest Azure technologies.
- Support for Azure storage accounts in different regions. Previously, the collection resources deployment and storage account region had to match. With this release, we have introduced a new user parameter called StorageAccountRegion, which allows you to specify a storage account in a different region than the collection resources deployment region, providing greater flexibility and scalability.
- JSON lines format support. You can upload any JSON file in JSON lines format to send data to Sumo Logic. This update enables seamless integration, which allows you to efficiently process and analyze JSON line data for your application's needs.
Check out our technical documentation here to learn more about the updates in Azure Blob Storage Collector.
June 12, 2023 (Alerts)
Subscribe to Alerts from Monitor Folders
New - We've added the ability to subscribe to alerts from monitor folders. When you subscribe at the folder level, you're automatically subscribed to all of its nested monitors and folders. This allows you to subscribe to alerts from multiple monitors at once, rather than subscribing to each individual monitor. Learn more.
June 8, 2023 (Apps)
Proofpoint TAP App
We're excited to announce the release of the new Proofpoint TAP app for Sumo Logic. This app helps you to strengthen your security posture by providing comprehensive visibility and analysis of messages and clicks on malicious URLs. Here are some of the key features that this app offers:
- Message Protection. Provides sophisticated email analysis techniques and helps you to identify malicious emails, such as those containing malware, ransomware, or phishing attempts.
- URL Defense. Analyzes URLs in real-time and helps you identify malicious websites or links used for phishing or spreading malware.
- Attachment Defense. Examines your email attachments for potential threats, including infected files or documents containing macros that can execute malicious code.
Check out our technical documentation here to learn how you can set up and use the Proofpoint TAP app for Sumo Logic.
June 8, 2023 (Apps)
Mimecast App
We're excited to announce the release of the new Mimecast app for Sumo Logic. This app leverages Sumo Logic Cloud-to-Cloud Mimecast source to leverage advanced security monitoring and analytics capabilities for Mimecast data. Here are some of the key features that this app offers:
- Email Traffic Monitoring. Monitor message traffic for both delivered and received emails with a detailed overview of each stage.
- Threat Detection Monitoring. Monitor logs regarding messages with malicious attachments, user activity, and threat detection within the orgaization users.
- Data Loss Monitoring. Monitor data loss resulting from breaches and malicious attacks.
Check out our technical documentation here to learn how you can set up and use the Mimecast app for Sumo Logic.
June 8, 2023 (Apps)
Cisco Meraki - C2C
We're excited to announce the release of the new Cisco Meraki - C2C app for Sumo Logic. This app uses the Sumo Logic Cloud-to-Cloud Cisco Meraki source and helps you to effectively manage and optimize your network performance, enhance security, and proactively respond to potential threats. Here are some of the key features that this app offers:
- Comprehensive Organization Insights. Gain valuable insights into your organizational configuration and operations, including API adoption, configuration template usage, and product distribution.
- Event Analysis and Trend Identification. Analyze your network events based on type, client associations, and SSIDs. You can identify event patterns and trends to understand network activity and potential security risks.
- Client and SSID Monitoring. Monitor your client activity and their association with specific SSIDs to keep track of your client's behavior and network usage for effective management.
- Air Marshal Security Overview. Provides wireless intrusion detection and prevention by monitoring your security status and identifying potential vulnerabilities in the network.
- Enhanced Security Measures. Prioritize your security efforts by identifying top clients and destinations based on security events and take proactive steps to protect the network and mitigate potential threats.
Check out our technical documentation here to learn how you can set up and use the Cisco Meraki - C2C app for Sumo Logic.
June 5, 2023 (Reliability Management)
SLO Tagging
New - We've added the ability to tag your Service Level Objectives (SLOs), allowing for easier filtering and correlation. This is a great way to associate SLOs with variables such as service, application, and team.
Learn more about how to tag new and existing SLOs.
June 1, 2023 (Dashboards)
Data Access Level
Our new Data Access Level feature enables you to control the data that your users see in the shared dashboard, which is governed by the user's role search filter. Based on how you configure the data access level, the role search filter affects the data that users can see.
Here are some of the key features that this feature offers:
- Newly created dashboards run with the
Viewer'srole search filter with whom the dashboard is shared. - Template variable substitutions will be quoted if they contain any non-alphanumeric characters to prevent the viewer from performing subqueries or widening the scope of a query.
Check out our technical documentation here to learn more about data access level.
May 31, 2023 (Apps)
Palo Alto Cortex XDR
We're excited to announce the release of the new Palo Alto Cortex XDR app for Sumo Logic. This app leverages Sumo Logic Cloud-to-Cloud Palo Alto Cortex XDR source to provide visibility and analysis of alerts and incidents from the Palo Alto Networks Cortex XDR platform. Here are some of the key features that this app offers:
- Real-Time Monitoring. Gain real-time visibility into security events and incidents across your organization's infrastructure. Monitor and analyze alerts, threats, and suspicious activities to detect and promptly respond to potential threats.
- Interactive Dashboards. Explore interactive dashboards that provide a holistic view of alerts, incidents, and threat intelligence. Visualize data with pre-built charts, graphs, and tables to understand trends, patterns, and anomalies.
- Incident Management. Streamline incident management processes by tracking security incidents. Monitor incident status, and collaborate with your security team for effective incident response.
Check out our technical documentation here to learn how you can set up and use the Palo Alto Cortex XDR app for Sumo Logic.
May 31, 2023 (Apps)
Cato Networks
We're excited to announce the release of the new Cato Networks app for Sumo Logic. This app leverages Sumo Logic Cloud-to-Cloud Cato Networks source to provide real-time insights into the events and helps you to identify potential security threats with admin activities. Here are some of the key features that this app offers:
- Security event analysis. This app provides a holistic view of event-related metrics and insights, which helps you to detect and respond to security threats in the Cato Networks environment.
- Threat analysis. This app offers a comprehensive overview of threat-related information that allows you to understand and address potential risks effectively, thereby supporting risk management and response strategies.
- Audit summary. This app includes pre-built reports and visualizations of audit logs which facilitates effective monitoring, analysis, and identification of any unusual or suspicious activities within the system.
- Customization and Integration. Customize and tailor your dashboards, reports, and alerts to align specific monitoring and security needs. It also supports integration with other security tools and platforms, enabling a centralized view of the overall security landscape.
Check out our technical documentation here to learn how you can set up and use the Cato Networks app for Sumo Logic.
May 26, 2023 (Metrics)
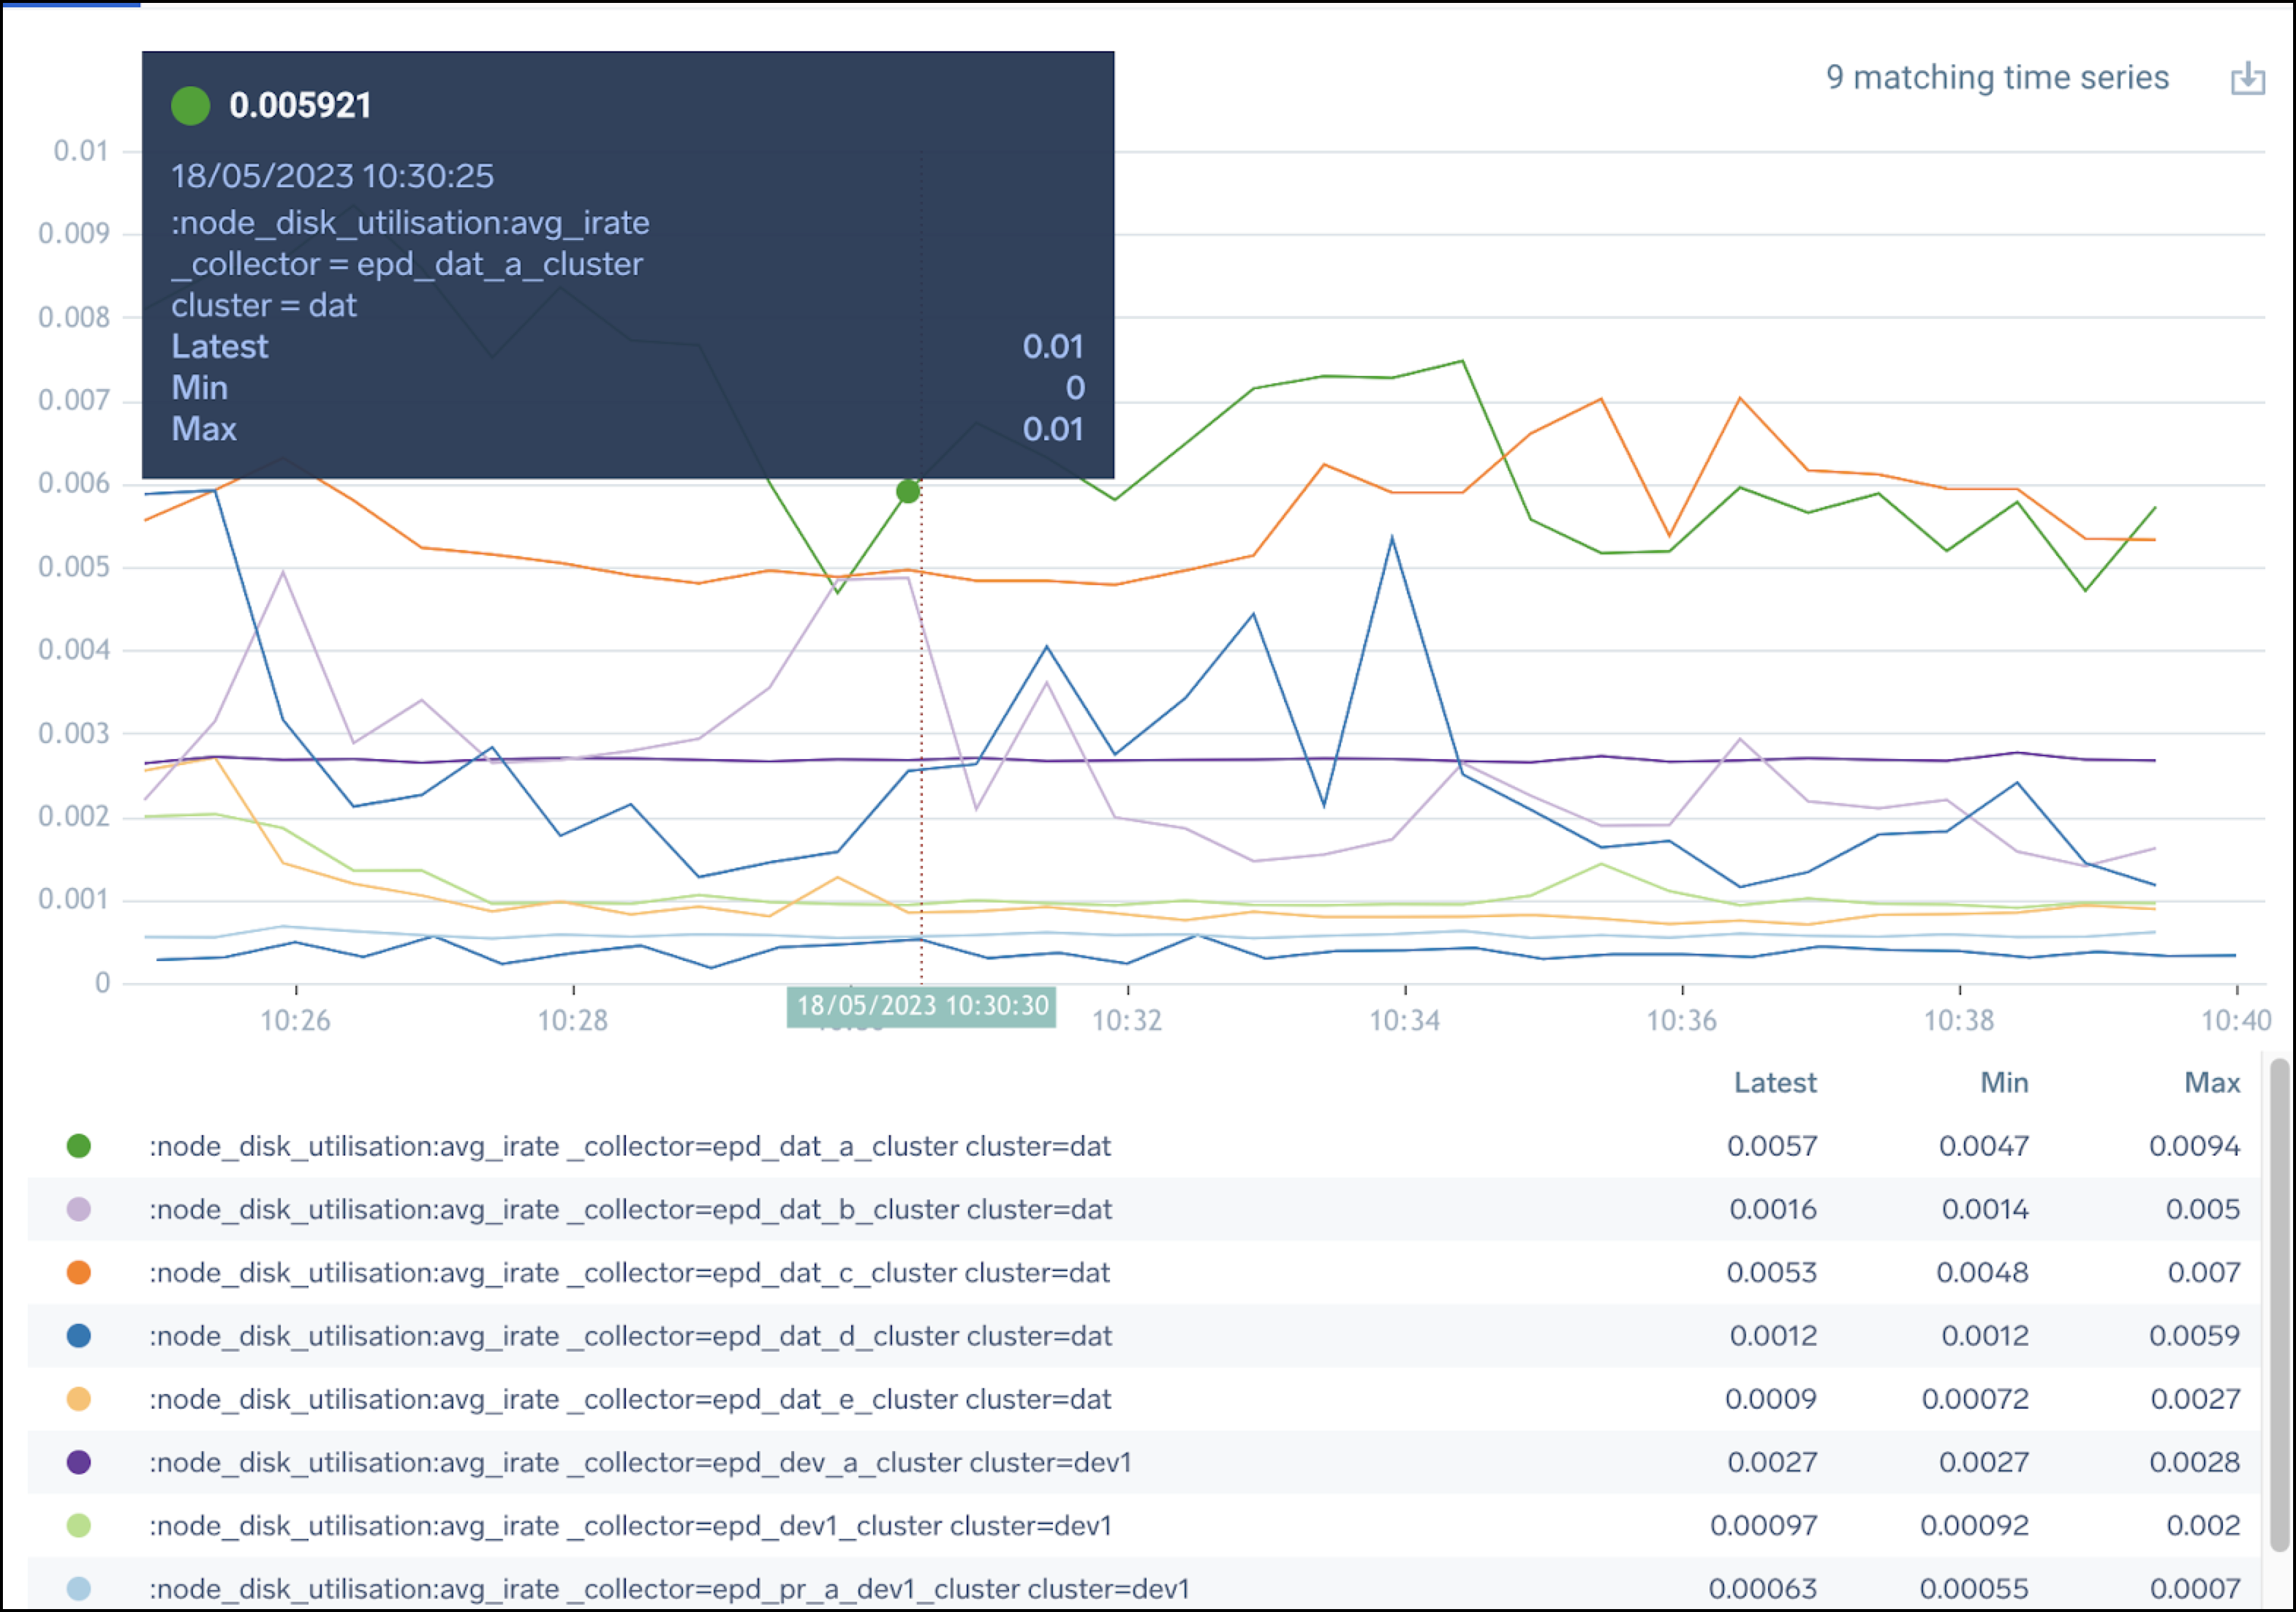
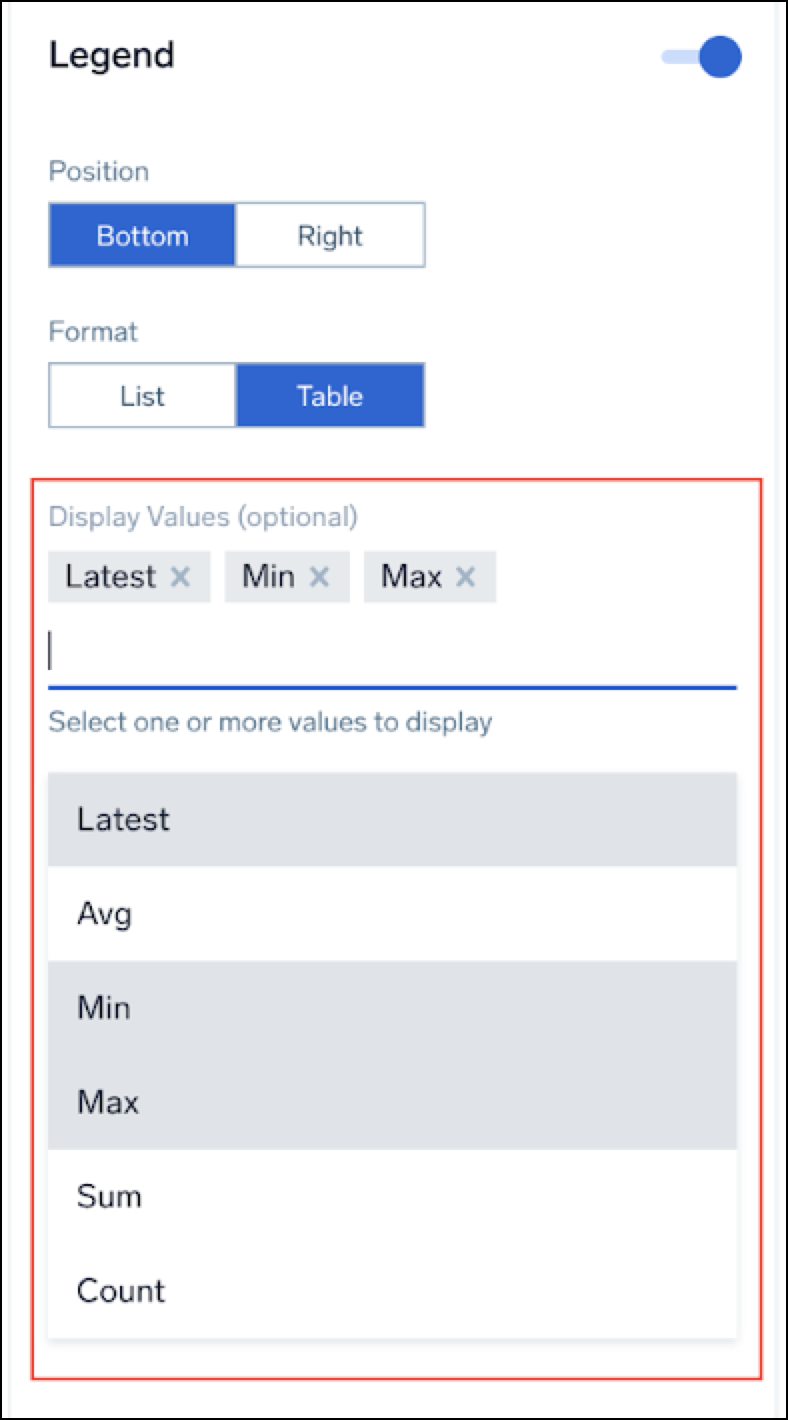
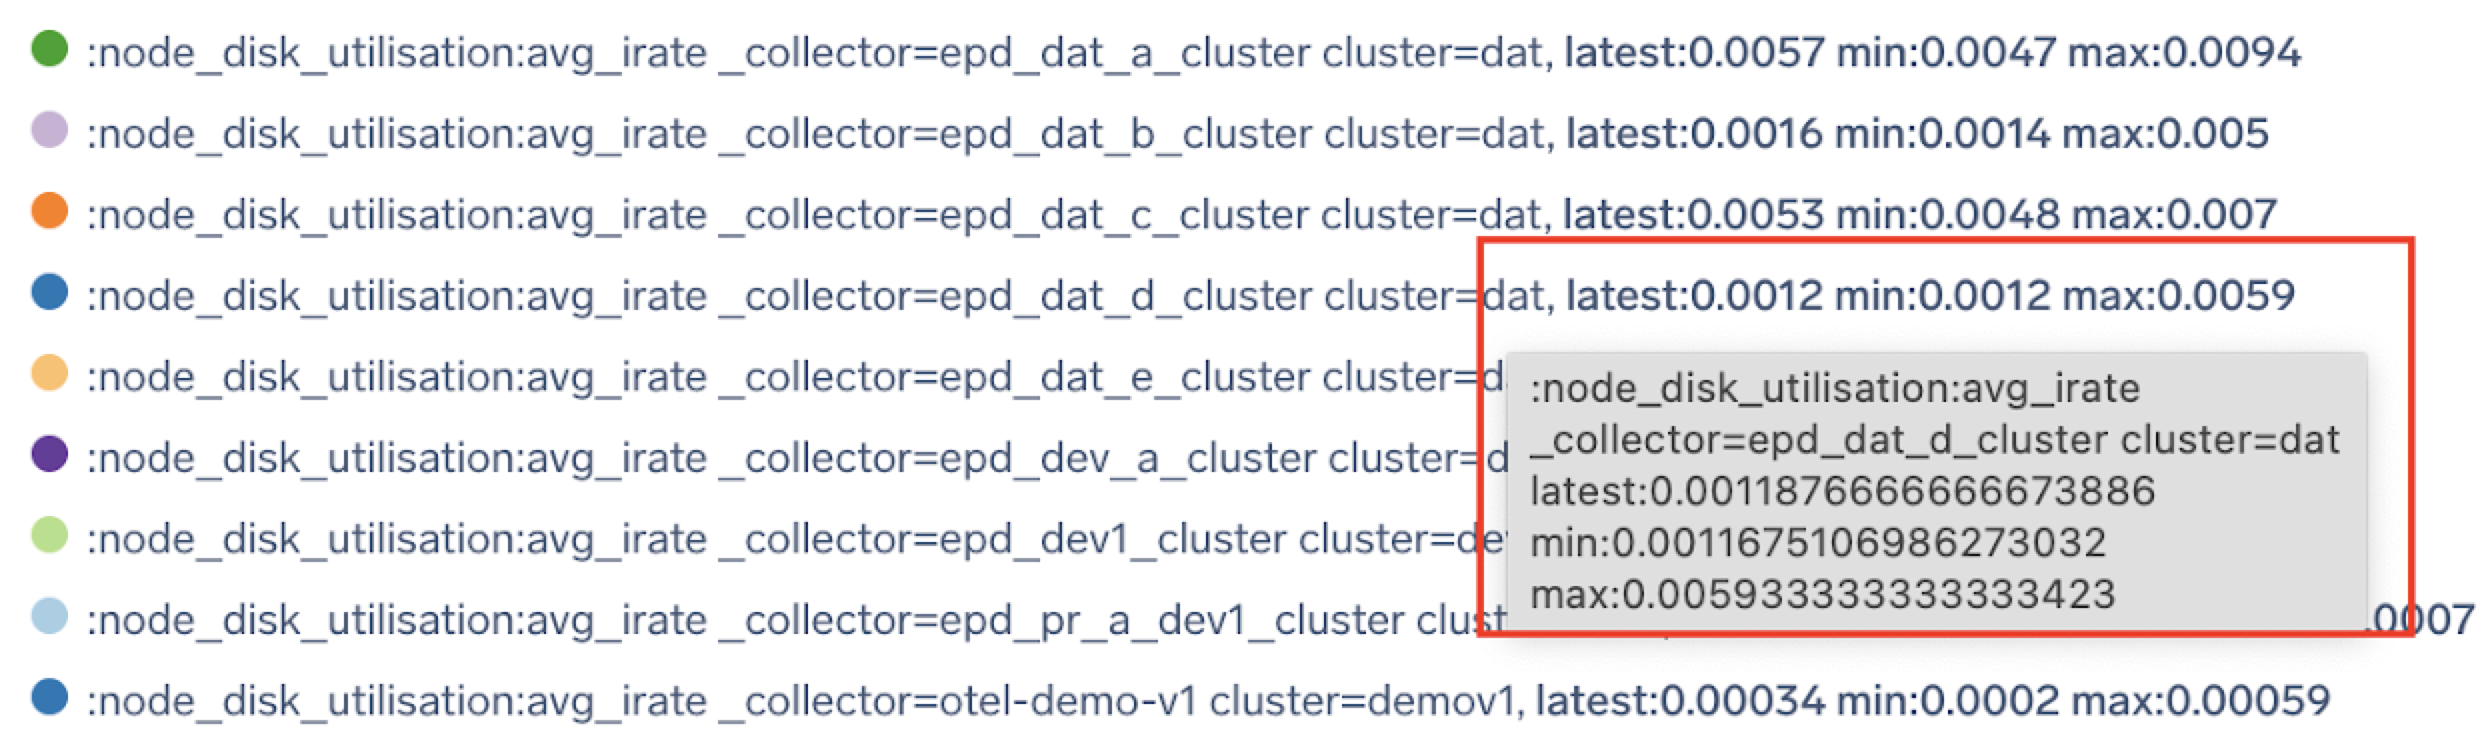
Display Summary Statistics in Legend
We've updated the legend statistics to improve your experience with chart legends and chart tooltips in Time Series visualizations. It lets you visualize aggregate data for your time series. You can simply navigate to the Legend section in the Settings panel on the right-hand side and choose the desired options from the Display values menu.
Enhancements & Updates
Added aggregation statistics options
When it comes to selecting the statistics you want to display, you have a variety of options to choose from. Here is the list of available aggregation statistics.
- Latest (default). Shows the most recent value.
- Average. Displays the average value.
- Min(default. Shows the minimum value.
- Max(default). Displays the maximum value.
- Sum. Shows the total sum of values.
- Count. Displays the count of data points.
By default, when you create a panel in the Metrics view, a default selection of statistics is applied. However, if you are creating a panel in the Dashboard view, no default selection will be applied.
Added display options and sorting functionality
Display Format
Now, you have two display formats to choose from: List and Table. Let's take a closer look at how they work.
- List View. The statistics are displayed in bold text right after the time series name, giving you a clear and concise overview of your data.
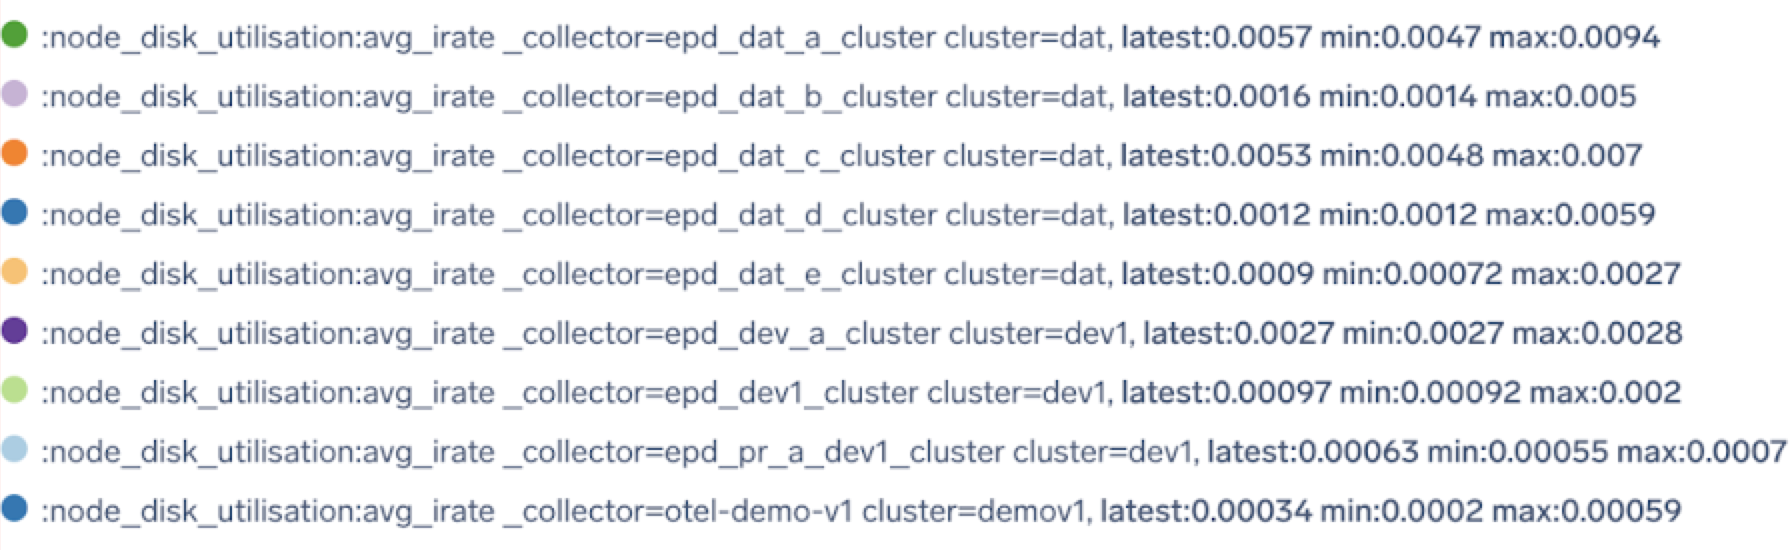
- Table View. The statistics are displayed in separate columns for a structured representation.
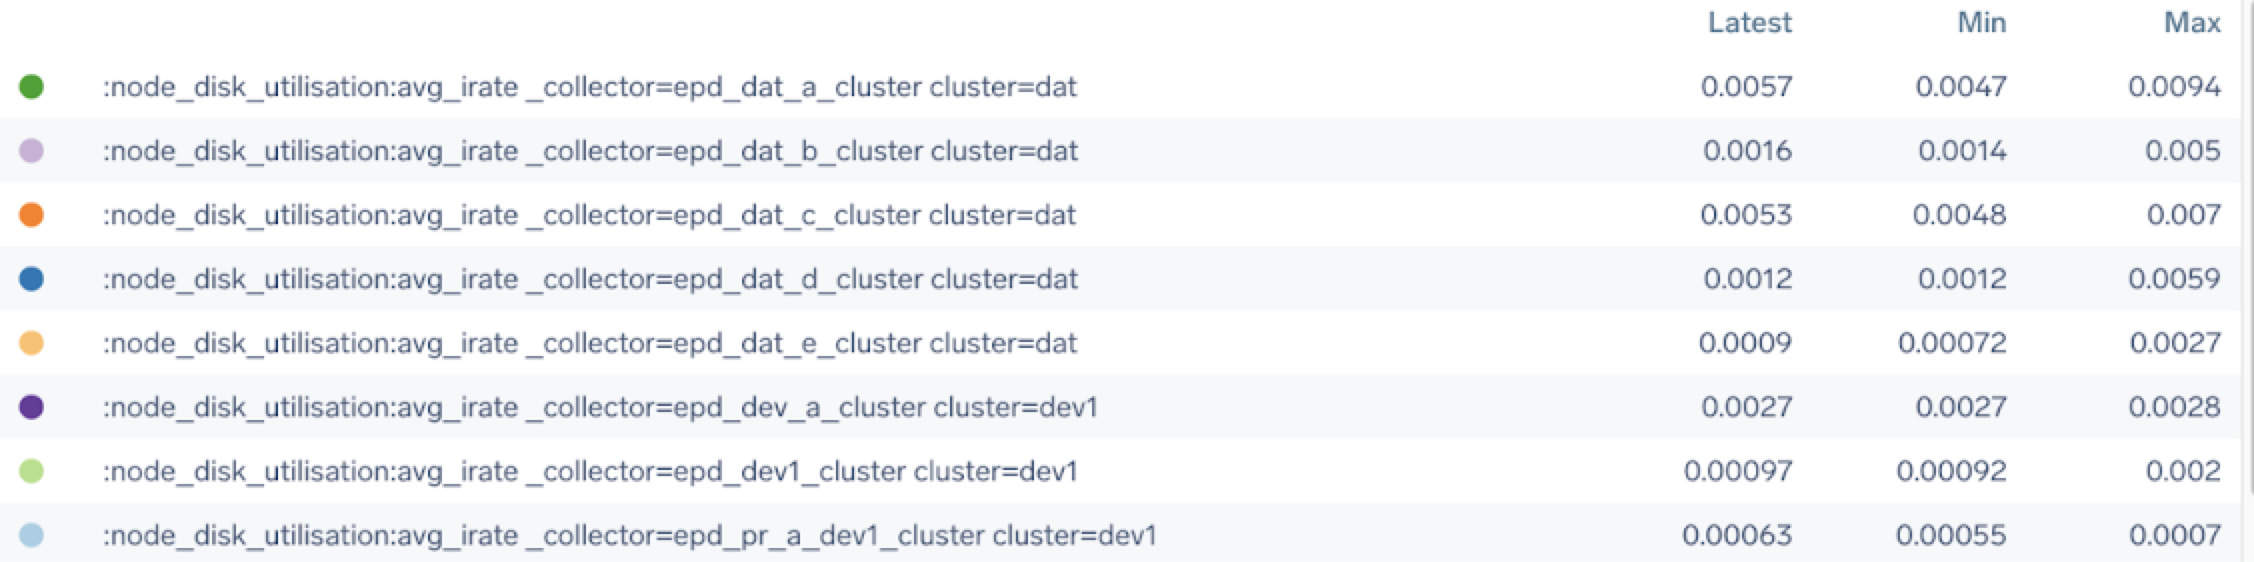
Default Format
- When creating a panel in the Metrics view, the default format is Table.
- For panels in the Dashboard view, the default format is List.
Rounding
- To enhance readability, statistics values are rounded to 2 significant digits.
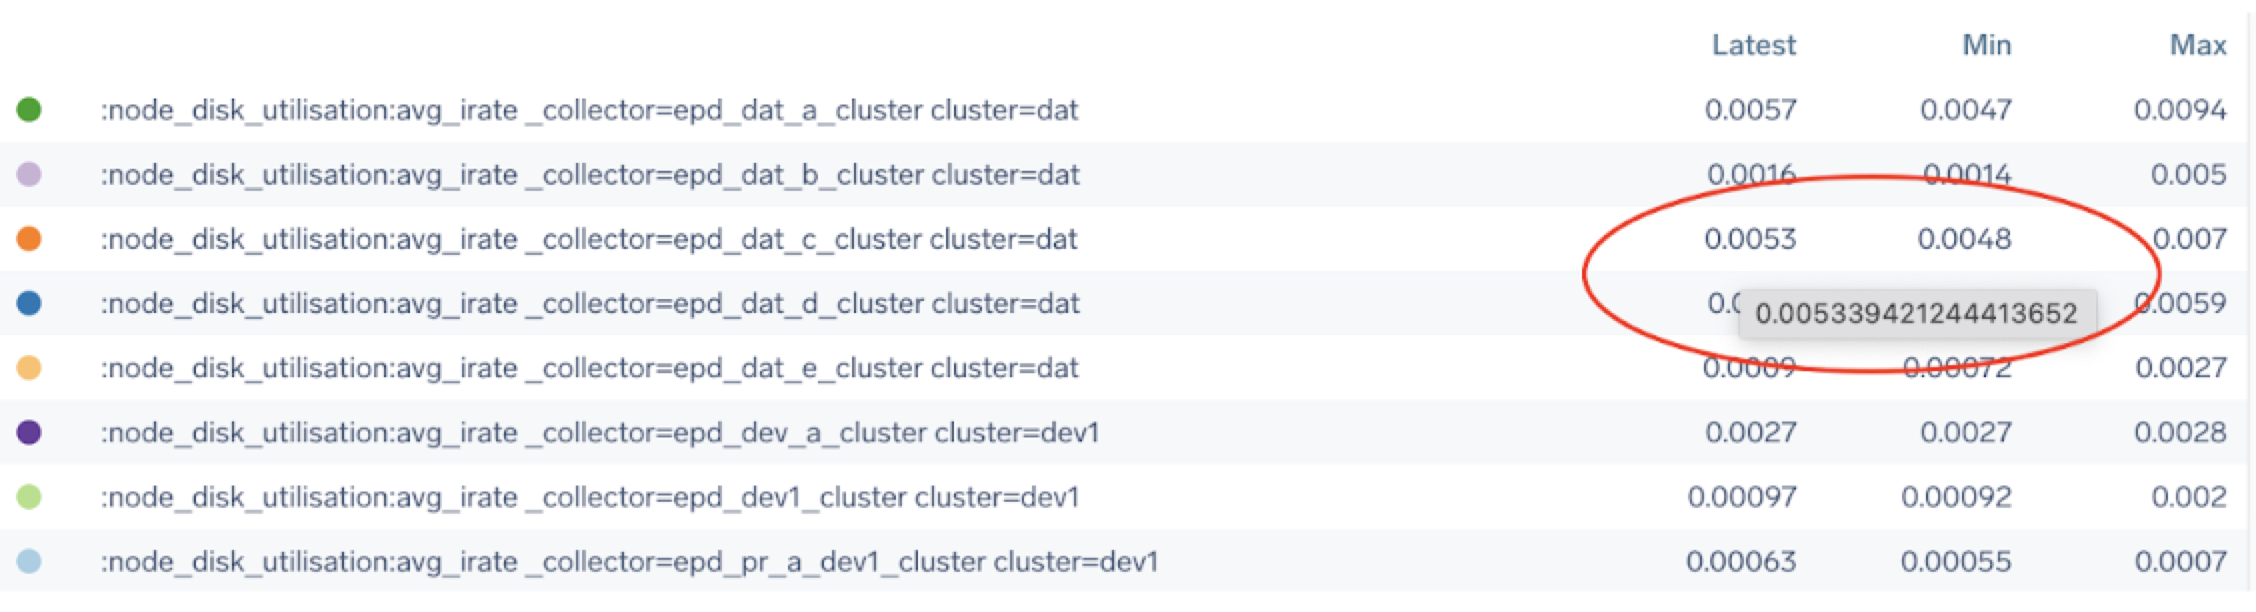
- If you need access to the exact unrounded values, you can find them in the tooltips.
Sorting
Sorting your data is now easier than ever.
- In List View, time series are sorted based on their names.
- In Table View, the default sorting is based on time series names.
Additionally, Table View allows sorting based on statistics. To sort, click on a statistic title in the table header.
- One click to enable ascending order.
- Two clicks to enable descending order.
- Three clicks to disable sorting.
May 25, 2023 (Metrics)
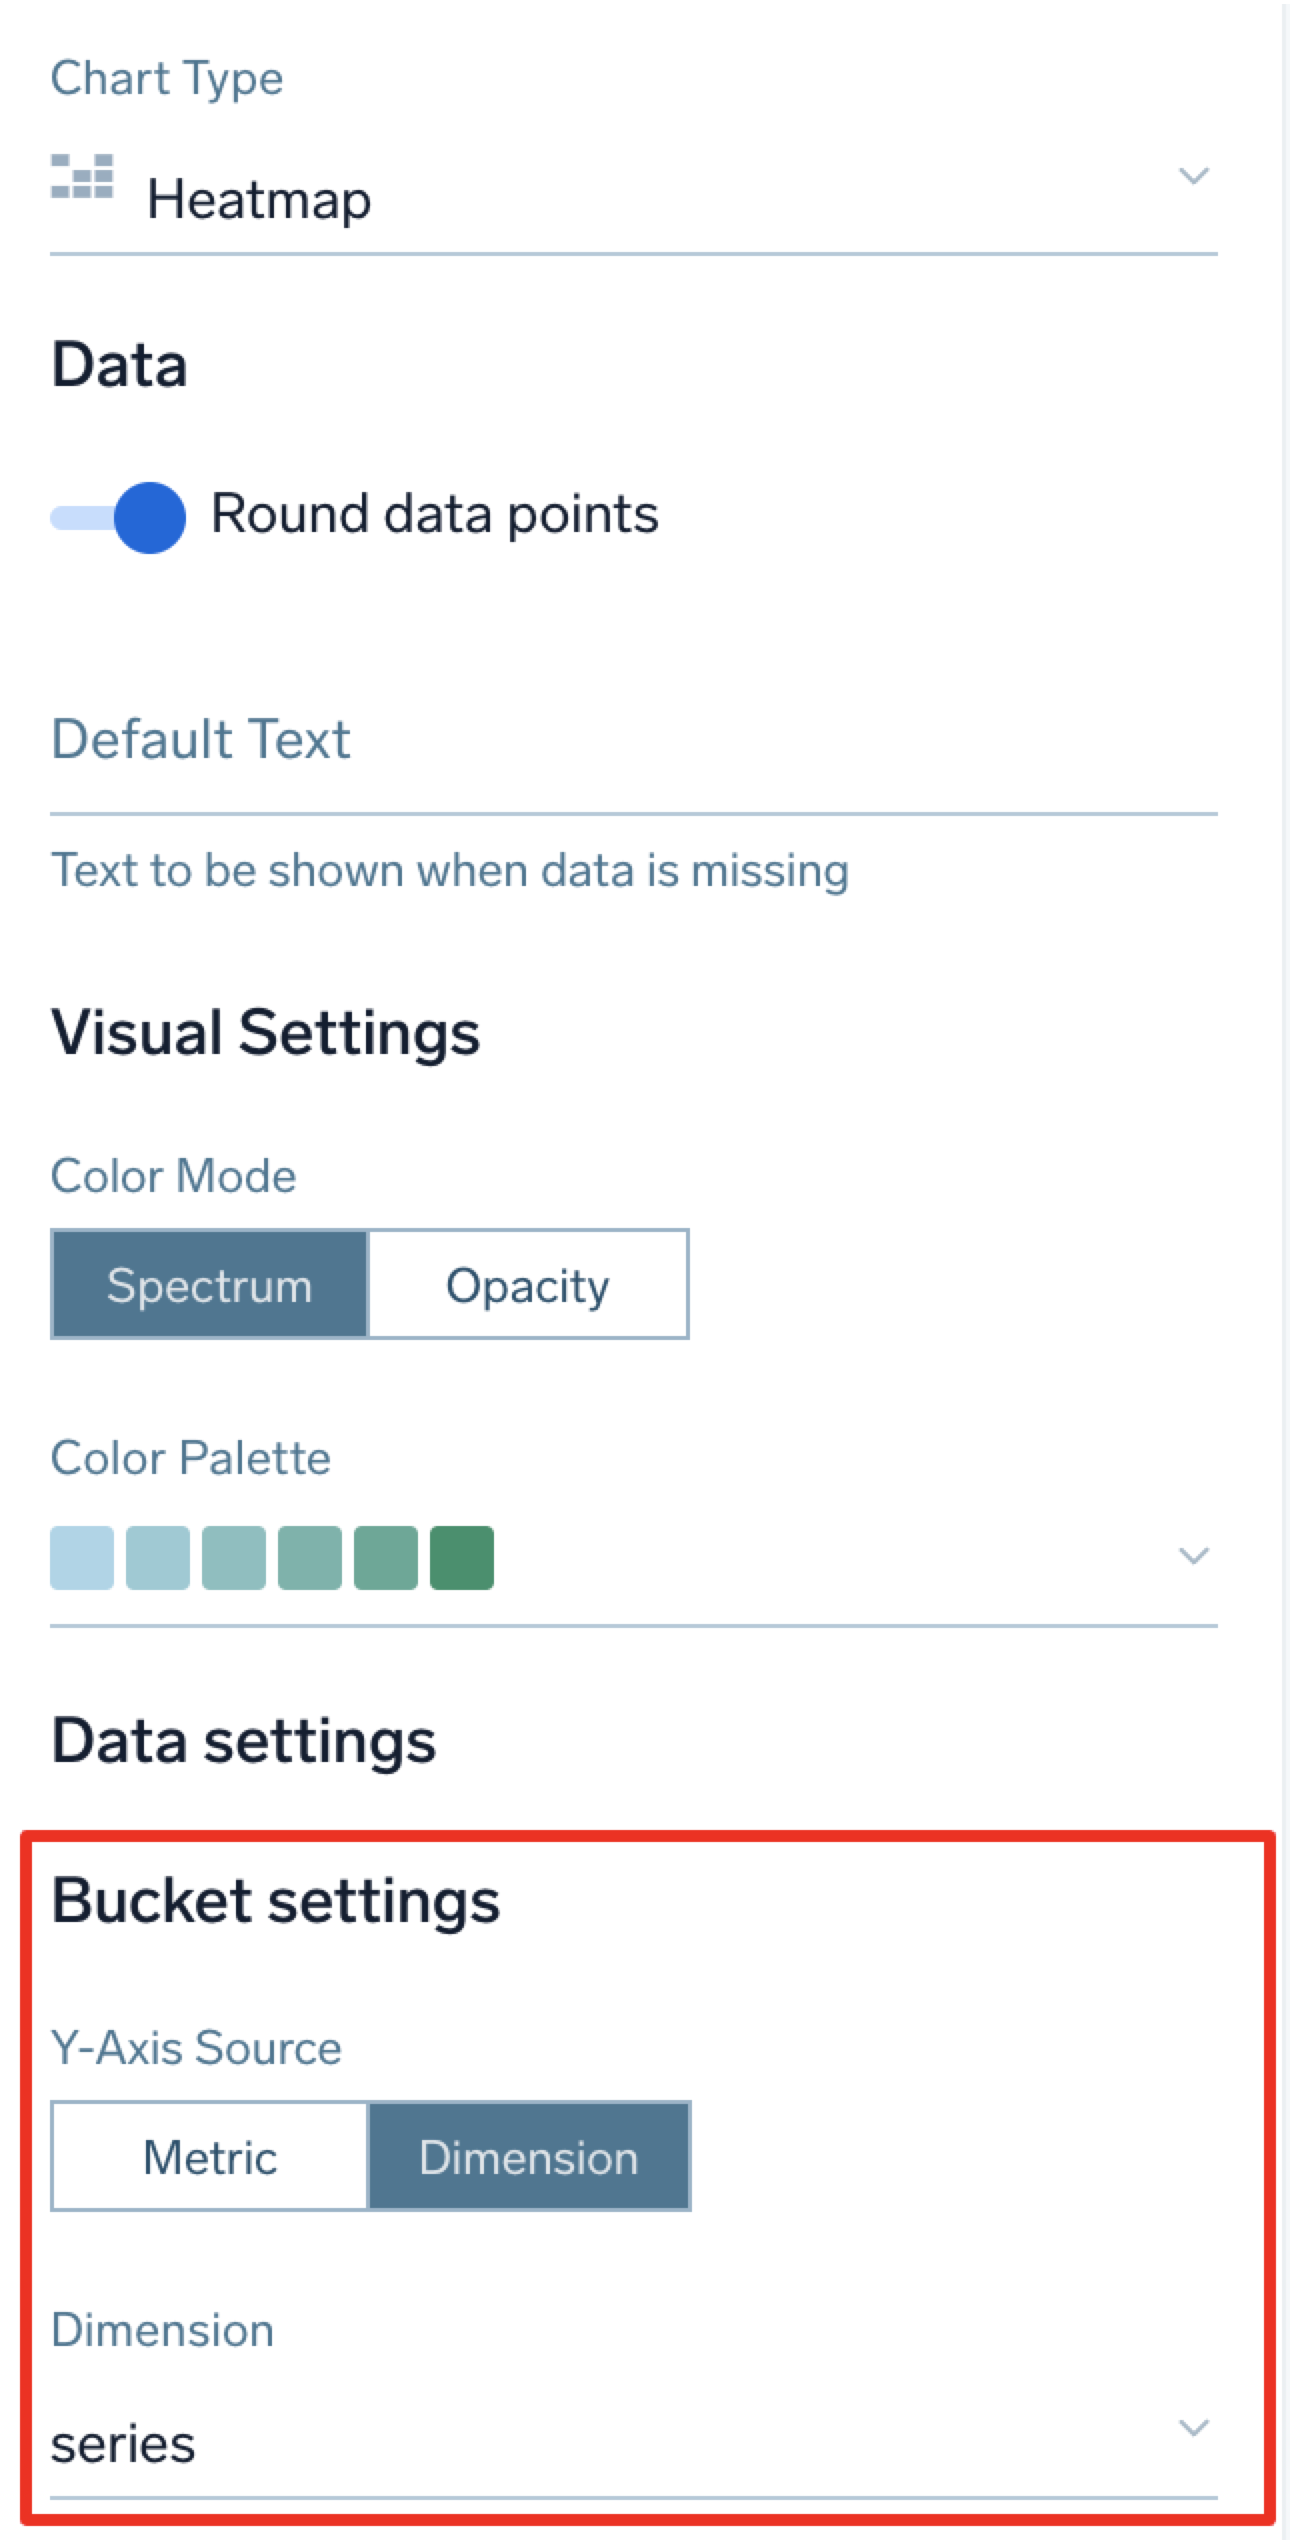
Enhanced Heatmap with Custom Dimensions on Y-Axis
We've enhanced the Heatmap functionality with the addition of custom dimensions on the Y-Axis. This feature enables you to gain deeper insights into your data by visualizing the frequency of occurrences for specific categories within a selected time range.
Using the Dimensional Heatmap, you can now not only see the number of errors that occurred within a chosen time range (as with the regular Heatmap) but also effortlessly identify the specific categories, such as cluster/cpu/collector/sourceCategory, where these errors occurred most frequently.
Configure Dimension Heatmap
To enable the Dimensional Heatmap with Categories on the Y-Axis, follow these steps:
- Run a metrics query or logs query with the transpose operator.
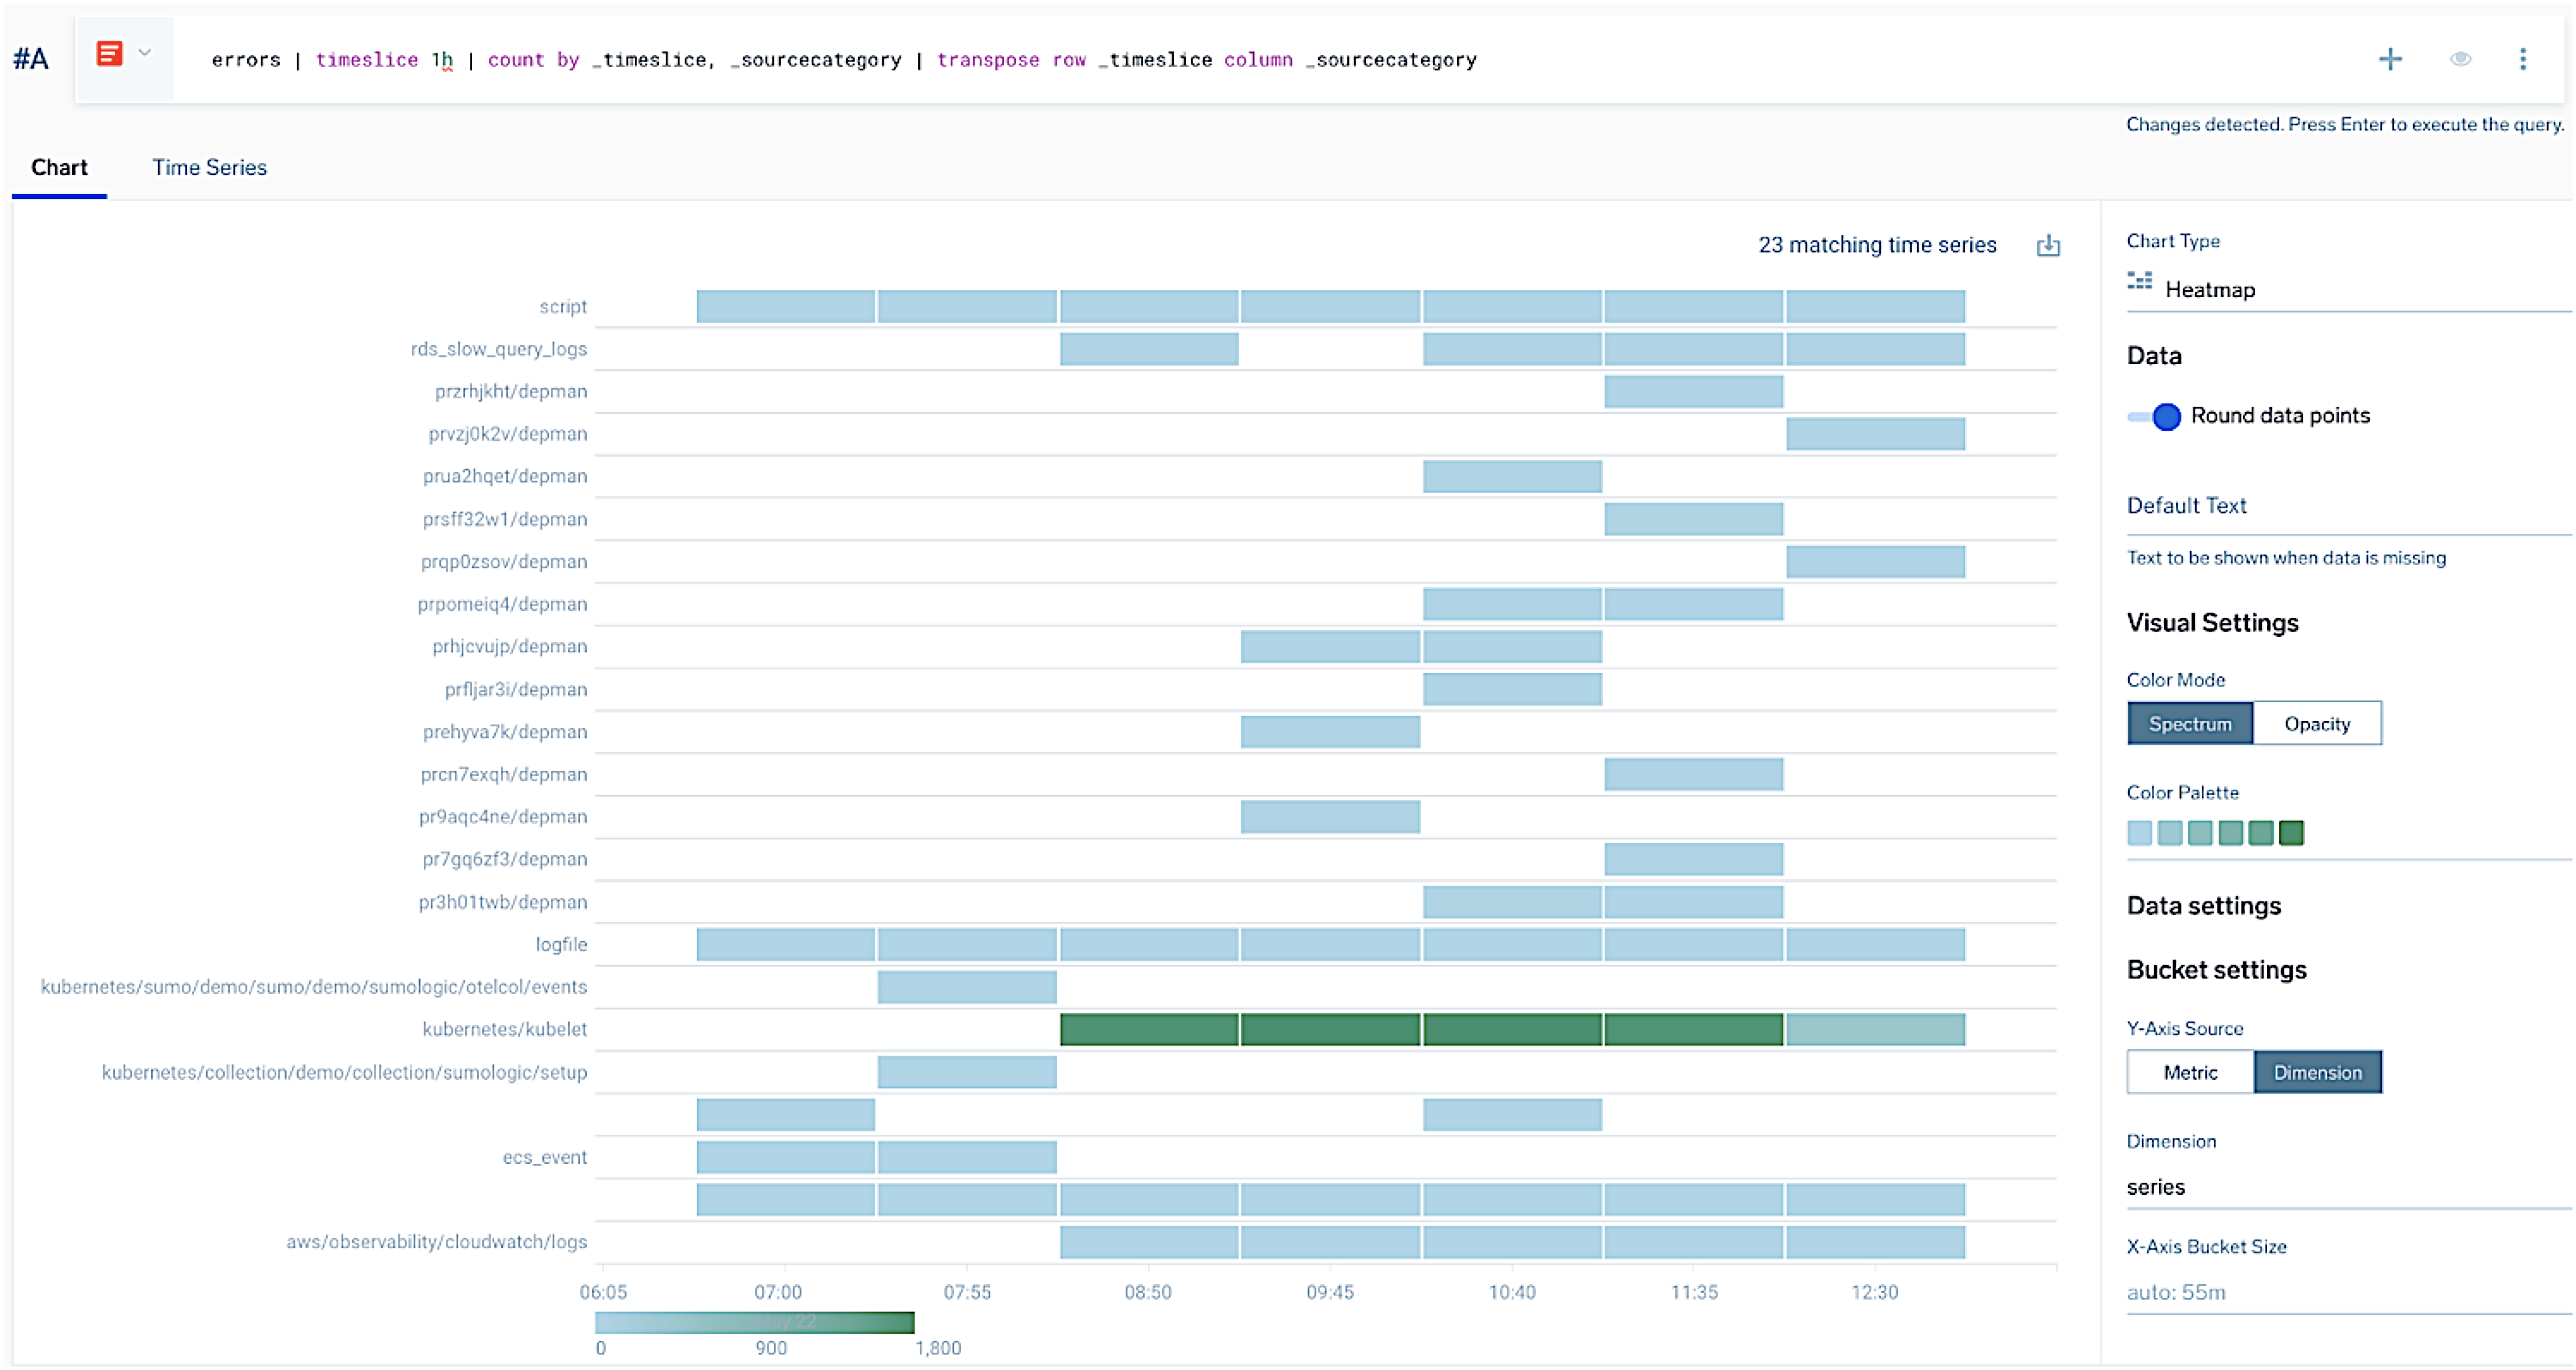
- Change the Y-Axis Source to Dimension.
- A new field, Dimension, will appear. Select the desired dimension from the list to be used as the source for the Y-Axis.
May 25, 2023 (Apps)
Rapid7 app
We're releasing a new app called Rapid7 app that leverages Sumo Logic Cloud-to-Cloud Rapid7 source. It enables you to obtain a deeper understanding of asset and vulnerability management activities, prioritize remediation efforts, reduce attack surfaces, and make informed decisions to improve your overall security posture.
Check out our technical documentation here to learn how you can set up and use the Rapid7 app for Sumo Logic.
May 25, 2023 (Apps)
MS Graph Azure AD Reporting
We're excited to announce the release of the new MS Graph Azure AD Reporting app for Sumo Logic. This app leverages Sumo Logic Cloud-to-Cloud MS Graph Azure AD Reporting source to provide insights into usage of Azure AD platform and identify potential security issues. Here are some of the key features that this app offers:
- Analyze Audit Activities. Provides real-time user activity for every resource category and shows the distribution of audits by operations and services.
- Monitor Sign-In activities. Monitor sign-in activities for your organization, including the number of successful and failed sign-ins, sign-ins by user location, sign-ins by application, and sign-ins from risky countries.
- Identify Suspicious Activities. Identify suspicious activity, such as sign-ins from unfamiliar/risky locations or multiple sign-in attempts.
- Analyze Provisioning Activities. Provides distribution of provisioning activities by status, actions, and initiators. It also shows the most frequent service principals used while provisioning.
Check out our technical documentation here to learn how you can set up and use the Asana App for Sumo Logic.
May 25, 2023 (Apps)
Microsoft Graph Security
We're excited to announce the release of the new Microsoft Graph Security app for Sumo Logic. This app leverages Sumo Logic's Cloud-to-Cloud Microsoft Graph Security source identify security threats and helps you to improve web security posture, proactively detect and mitigate potential security risks, and improve compliance with security policies and regulations.
Check out our technical documentation here to learn how you can set up and use the Microsoft Graph Security app for Sumo Logic.
May 22, 2023 (Apps)
Symantec Web Security Service App
We're excited to announce the release of the new Symantec Web Security Service app for Sumo Logic. This app leverages Sumo Logic's Cloud-to-Cloud Symantec Web Security Service source to provide real-time insights into the web traffic and helps you to identify potential security threats. Here are some of the key features that this app offers:
- Monitor for web-based threats. Monitor the web traffic for potential threats using access logs generated by the Symantec Web Security Service.
- Detect and prevent malware infections. Search access logs for patterns of behavior that are indicative of malware infections.
- Identify and block suspicious web activity. Monitor suspicious web activity, such as requests to known malicious sites.
- Optimize web security policies. Identify areas where policies may be too restrictive or too permissive and make adjustments accordingly.
Check out our technical documentation here to learn how you can set up and use the Symantec Web Security Service App for Sumo Logic.
May 12, 2023 (Traces)
Precise Percentiles Aggregations on APM Dashboards
We're excited to introduce an improved approach to calculating and aggregating percentiles on APM dashboards. This new mechanism significantly improves the accuracy of measurements for all APM percentile metrics and is now available in all dashboards.
What's New?
- All APM metrics on dashboards now use the recently released Metrics Histograms.
- The Service List panel replaces the existing timeseries table in the Application Details panel and is now included in out-of-the-box dashboards for APM views. This change leverages the new and useful visualization for Services List released earlier.
- The top bar selector for latency type has been renamed to
latency_type, which now automatically drives all latency percentile metrics in all panels that support pct metrics.
May 12, 2023 (Apps)
Zero Networks Segment - C2C
We're excited to announce the release of our new cloud-to-cloud source for Zero Networks Segment. This source ingests audit logs and network activities via Zero Networks Segment API to provide comprehensive network security by implementing zero-trust principles. Learn more.
May 12, 2023 (Collection)
Zoom Source for Hosted Collectors
We're excited to announce the release of our new Zoom source for hosted collectors. This source provides an endpoint for receiving webhook events that help you to monitor:
- Meeting events
- Webinar events
- Recording events
- Zoom Room events
- User events
- Account events
For more information, check out our technical documentation here.
May 12, 2023 (Collection)
Google BigQuery - C2C
We're excited to announce the release of our new cloud-to-cloud source for Google BigQuery, this source collects the results of a query via BigQuery API. Learn more.
May 11, 2023 (Traces)
Enhanced Trace Query Visualizations
We've enhanced the Trace Query Visualizations screen by adding five new aggregation charts alongside the existing Trace duration breakdown chart. These charts provide more insights into the behavior and performance of your application. Aggregating traces allows you to quickly identify anomalies and unexpected behaviors, resulting in a shorter Time-to-Resolution (TTR) and a higher Return on Investment (ROI). The new aggregate charts are available as time-series or histogram and cover the following three metrics:
- Trace duration
- Error count
- Span count
The new aggregate charts are:
- Trace duration as timeseries
- Trace duration as histogram
- Error count as timeseries
- Error count as histogram
- Span count as timeseries
- Span count as histogram
To access the new charts, simply navigate to the Traces screen and select a subset of comparable traces (such as the same transaction type). Then, click on Show Chart. You can use the dropdown menus to choose from the duration/errors/spans (per trace) and timeseries/histogram options. With these choices, you'll now have a total of six charts to help you better understand the profile of your traces. Learn more.
May 4, 2023 (Manage Account)
Audit Logs for Connections
We're excited to announce that we offer audit logs for connections. Now whenever someone manages a webhook connection, you can check the audit event index to learn about the change. For more information, see Audit Event Index.
April 28, 2023 (Reliability Management)
Update to SLO Monitors
We've added a new feature to this release that allows you to configure multiple burn rate trigger conditions within an SLO monitor. This enhancement provides the ability to receive alerts for both short-term and long-term issues. With the short window burn rate, you can quickly detect any problems affecting the SLO monitor, while the long window burn rate ensures that significant impacts over a longer time period are identified.
April 28, 2023 (Dashboards)
Sankey Charts, Box Plot Charts, and Connection Maps
We're excited to announce the release of several new features in the Dashboards (New):
- Sankey Chart. Our new Sankey diagram feature, which you can find under the Categorical panel type, is built using the
fromstateandtostatefields in your query. The Sankey diagram helps you understand the flow of the log events within a distributed system. The width of an arrow or stripe in the Sankey diagram shows the proportion of a quantity. - Connection Map. Our new Connection Map feature, which you can find under the Map panel type, provides visibility into the geographic origins of threats and their target points. By hovering over each line, you can find the threat name, latitude/longitude details of threat origin, and latitude/longitude details of threat target point.
- Box Plot Charts. Our new Box Plot Charts feature, which you can find under the Time Series and Categorical panel type, graphically depicts groups of data using quartiles and is built by including
_min,_pct_25,_pct_50,_pct_75, and_maxin your query.
April 28, 2023 (Apps)
Asana App
We're excited to announce the release of the new Asana app for Sumo Logic. This app leverages Sumo Logic's Cloud-to-Cloud Asana source to provide real-time monitoring and security insight for your Asana account. Here are some of the key features that this app offers:
- Customizable searches. Build custom searches to examine particular Asana data elements, allowing you to go deeper into the data and find insights that are pertinent to your company's needs.
- Integration with other sources. Combine with other Sumo Logic apps to gain a more holistic view of the data.
Check out our technical documentation here to learn how you can set up and use the Asana App for Sumo Logic.
April 28, 2023 (Apps)
Proofpoint on Demand app
We're excited to announce the release of the new Proofpoint on Demand app for Sumo Logic. This app leverages Sumo Logic's Cloud-to-Cloud Proofpoint on Demand source to provide an improved security posture by analyzing message logs. Here are some of the key features that this app offers:
- Email security monitoring. Monitor message traffic to detect and prevent spam, phishing, and other email-borne threats.
- Compliance monitoring. Monitor email communications for compliance with internal policies and external regulations such as Data Loss Prevention (DLP), Domain-based Message Authentication, Reporting and Conformance (DMARC), and other relevant regulations.
- Incident investigation. Quickly investigate potential security incidents by searching and analyzing email security and compliance data. This includes identifying the source of a security threat and the extent of its impact.
- User behavior monitoring. Monitor behavior related to email communication to identify potential insider threats or unauthorized access.
For more information, check out our technical documentation here.
April 25, 2023 (Observability)
AWS Observability 2.6.0 Release
We're excited to announce the release of AWS Observability 2.6.0. Here are some of the features the new version offers:
- Support for Amazon SQS. Added out-of-the-box dashboards and predefined monitors to provide important information about queue and message statistics, including 4 new dashboards.
- AWS Lambda dashboards. Updated to include Lambda Telemetry API metrics for improved observability.
- Entity Inspector KPIs. New KPIs were added to help users gain better visibility into their entities.
- Out-of-the-box monitors. Added evaluation delay for improved accuracy and deviation detection.
- AWS Observability Lambda functions. Updated to use the latest available Node.js runtime environment.
For more information on updating the AWS Observability to the latest version, see Update AWS Observability Stack.
April 21, 2023 (Apps)
Druva App
We're excited to announce the release of the new Druva App for Sumo Logic. This app leverages Sumo Logic's Cloud-to-Cloud Druva source to provide real-time monitoring and security insight for your Druva account. Here are some of the key features that this app offers:
- Critical event alerts. Get notified of potential security incidents with real-time alerts for user activities, device and app usage, and backup and restore events.
- Granular visibility. Gain detailed insights into user activity, alerts, and backup status to help you quickly detect and respond to security threats.
- Seamless integration. Easily integrate with your existing Druva account and Sumo Logic environment for a streamlined security operations workflow.
Check out our technical documentation here to learn how you can set up and use the Druva App for Sumo Logic.
April 19, 2023 (Collection)
Rapid7 - C2C
We're happy to announce the availability of the Rapid7 Cloud-to-Cloud hosted collector source, which allows you to collect assets and vulnerabilities data from Rapid7 InsightVM. Learn more.
April 18, 2023 (Apps)
Akamai DataStream App
New - We're happy to announce the new Sumo Logic App for Akamai DataStream, which allows you to monitor and analyze your Akamai Edge server performance and request-handling pipeline.
This app helps to identify issues that may be impacting your users' experience. This app is tailored to work with Akamai DataStream 2 generated logs, which include valuable information about each request, such as the request path, status code, and response time. Learn more.
April 13, 2023 (Collection)
Cato, Druva, Citrix, and DocuSign C2C Sources
We've released several new Cloud-to-Cloud hosted collector sources.
New - Cato Networks source ingests security and audit events from Cato API.
New - Citrix Cloud source securely fetches System Log data from the Citrix Cloud System Log API.
New - Druva source analyzes and fetches event logs from the Druva inSync API.
New - DocuSign source collects event data from the DocuSign Monitor.
April 13, 2023 (Apps)
New SaaS Apps
We've released several new SaaS apps for Sumo Logic:
New - Airtable monitors and analyzes your organization's Airtable audit logs.
New - Armis provides visibility into Armis alerts and device data, making it easier to monitor and manage your device security.
New - Cisco Umbrella provides analytics and insights into your Cisco Umbrella DNS, Proxy, and Admin activity.
New - Citrix Cloud monitors and analyzes configuration changes and actions that may have impacted your environment and account administrators.
New - DocuSign monitors and secures your DocuSign account by providing real-time insights into critical events, alerts, and user activity.
New - Dropbox monitors and analyzes Dropbox usage data for your organization, offering insight into user activity, file access, sharing, and collaboration.
New - KnowBe4 monitors and analyzes KnowBe4 Phishing Security logs.
New - Microsoft Graph Identity Protection provides organizations with advanced security monitors and analytics capabilities for their Microsoft Graph Identity Protection data.
New - Miro provides visibility into Miro audit logs to ensure the security and compliance of your Miro environment.
New - SentinelOne monitors and analyzes data from your SentinelOne Threats and Agents logs.
April 7, 2023 (Traces)
Remote Application Service Detection
Update - We've improved our logic for detecting remote application services.
Even in the most demanding conditions - incomplete or broken traces, intermittent traffic gaps, and other challenges - remote services are detected correctly.
This functionality prevents the creation of remote services for missing spans if there are intermittent instrumentation or collection issues.
April 7, 2023 (Search)
Automatic Log Level Detection - Beta
New - We're excited to announce automatic log level detection for Log Search queries, helping you to quickly identify anomalies without having to search through large volume of logs to find high severity issues.
With this update, you can now visualize and filter log-level distribution in both your Histogram results and Messages table. This allows you to view messages of specific log level(s) in the same view. Learn more.
This feature is in Beta. To participate, contact your Sumo Logic account executive or our Support Team.
April 5, 2023 (Dashboards)
Scheduled Reports
New - Our new Scheduled Report feature enables you to receive an email copy of a dashboard periodically in either PDF or PNG format, allowing you to get insight into the dashboard without logging into the Sumo Logic platform.
March 2, 2023 (Dashboards)
Dashboards (Classic) Deprecation
Beta - To prepare for Dashboards (Classic) deprecation in late 2023, we've released a tool to assist you with migrating from Dashboards (Classic) to Dashboards (New). You can access this tool directly from a Classic dashboard page by clicking on the Migrate to new dashboards link at the top of the page.
For more information, including the current limitations of the tool, see Migrate Dashboards. Start planning and migrating your Classic dashboards now. You can learn more from our Community page.
February 24, 2023 (Search)
Search Query Editor Enhancements
Update - We've enhanced the query editor so that it's now more customizable, making it easier for you to work with long queries and larger results. With this update, you can now adjust the size of the search query editor, allowing for better visibility into long queries. This will be especially helpful for those of you who have found it difficult to review long queries in their entirety due to the fixed editor size. Additionally, you can reduce the size of the editor while examining larger results, making it easier to navigate through your data.
February 17, 2023 (Reliability Management)
SLO Lookup Tables
New - We've released SLO Lookup Tables, which allow you to view all SLO metadata in your environment. Data is managed and refreshed automatically on our end. To use, you can enlist the contents of the lookup table, which reside under a fixed path (sumo://content/slos) or join the results of your SLO precomputed data (from _view = sumologic_slo_output) with metadata contained in the lookup table. Learn more.
February 15, 2023 (Reliability Management)
Log Search from SLO Dashboards
New - You can now launch a Log Search session directly from an SLO dashboard panel, giving you the ability to drill down further into your SLO data. You can also add Log Search results to any other Sumo Logic dashboard, allowing you to correlate SLO performance data with other categories of data. Learn more.
February 13, 2023 (Real User Monitoring)
RUM Dashboard Enhancements
New - Real User Monitoring (RUM) dashboards now have additional explore level and capabilities that allow you to filter by deployment environment. To leverage this, you'll need to add the deployment.environment tag and value that corresponds to your development environment (like us-west-1, prod, dev) as a custom attribute to your RUM script.
To learn more, see RUM Dashboards and Configuring RUM Data Collection.
February 13, 2023 (Reliability Management)
SLO and SLI Metrics Query Enhancements
New - We have added support for multiple metrics queries for the threshold-based definition for the Query field in the SLI definition. You can use it to generate derived time series using arithmetic operations with the help of joins.
Multiple metrics queries can be defined from scratch on the SLO editor and the metrics page and imported to the SLO editor via the Create an SLO menu option.
February 6, 2023 (Metrics)
Metrics Monitors Enhancements
Update - We've enhanced the alerting logic for Metrics Monitors to ensure more accurate alerts. For monitors that alert when all data points are above a given threshold at all times within, we've added a customizable parameter for the minimum number of required data points within an alerting window. And, for any existing monitor, the default setting is 2, which means that two data points are required within an alerting window to generate an alert. Learn more.
January 30, 2023 (Reliability Management)
Service-Level Objective (SLO) Monitoring
New - Critical Monitors that alert you to customer-critical service interruptions and other reliability measurements are great candidates to convert to Service-Level Objectives (SLOs). We've made this easy: you can now create SLOs directly from your Monitors in just a couple of clicks. The thresholds you set in your Monitor will carry over automatically to your new SLO definition, saving you time and effort. Learn more.
January 27, 2023 (Search)
Frequent and Infrequent Data Tier Bug Fix
Update - We've fixed a bug that caused inconsistent results for queries run on the Frequent and Infrequent data tiers due to inconsistent handling of whitespace characters within quoted phrases. With the fix, query results are now consistent across all data tiers.
For more information, see Normalization of Phrase Queries.
January 24, 2023 (Manage Account)
Reuse Password After Policy Update
Update - We have updated the Reuse Password After password policy. Previously, you could prevent Sumo Logic users from reusing up to 10 previously used passwords. Now, you can prevent users from reusing up to 12 previously used passwords. For more information, see Set the Password Policy.
January 19, 2023 (Traces)
Tracing Services List
New - Our new tracing Services List view provides a high-level summary of your service health insights and important KPIs in one compact table, allowing you to spot potential issues in your application infrastructure. Learn more.
January 17, 2023 (Metrics)
predict Metrics Operator
New - We’re released a new metrics operator: predict. The predict operator takes as input a single time series metric to predict future values. Predicting metrics such as CPU usage or memory consumption is useful for resource and capacity planning. For more information, see predict Metrics Operator.
January 17, 2023 (Alerts)
Customizable Webhook Alert Recovery Payload
New - We've rolled out the ability to customize your alert resolution notifications. So when setting up Sumo Logic webhook connections, you can now design and test both your alert and recovery JSON payloads.
This customizable alert recovery payload functionality is currently supported for Slack, Microsoft Teams, AWS Lambda, Azure Functions, generic webhook, PagerDuty, OpsGenie, and ServiceNow. Learn more.
We're doing a slow rollout for this feature. By Thursday, Jan 19, all customers will have access.
January 9, 2023 (Metrics)
Metrics Operators and Charts Enhancements
We've released two metrics updates.
Update - Expanded support for thresholds in metrics charts. We've expanded support for setting Warning and Critical threshold values for metrics query results in charts. Now, you can define threshold metrics values in the Chart view for Time Series panels, and for these chart types for Categorical panels: Line, Area, Bar, Column, and Table. For more information, see Set Warning and Critical Thresholds.
Update - Unified where and filter metrics operators. We have merged the functionality of the filter metrics operator into the where operator. Previously you could use the filter operator to filter out time series, and the where operator to filter out data points within a time series. Now, the updated where operator supports filtering by time series and by data point. For more information, see where Metrics Operator.
The filter operator is still supported, but will be deprecated in the future.
January 5, 2023 (Search)
Search Query Editor Enhancements
Update - We have enhanced our Query Editor functionality to help you create a better search experience and reduce errors when writing queries. This feature matches any open quotes, open brackets (curly, square, or parenthesis brackets), and completes the quotes automatically.