Threat Detection and Investigation
To use Cloud Infrastructure Security for threat detection and investigation, you can use pre-built apps, or build your own dashboards.
About threat detection and investigation
Threat detection and investigation refers to identifying and exploring threats or security-related events within an asset, application, or network as quickly and effectively as possible.
Threat detection identifies threats within cloud-based, hybrid, and on-premises infrastructure and applications before they cause major issues for a business. The sooner security teams uncover a security-related event, the quicker they can investigate and mitigate it.
Threat investigation analyzes a threat or potential threat to glean more information about it. When a threat is detected, SecOps teams use behavioral, forensic, and log data to investigate and uncover as much information as possible. From there, teams can respond appropriately to the threat and plan for system improvements to reduce risk in the future.
Advanced security analytics solutions like Cloud Infrastructure Security provide organizations with a one-stop shop to monitor and secure applications and infrastructure. Our cloud-native SaaS platform makes it easy for your security and DevSecOps teams to observe and investigate security threats within your cloud infrastructure.
Best practices guide for implementing threat detection and investigation
Following are the basic steps involved in implementing a threat detection and investigation process.
Step 1: Collect and aggregate all security data into a single, unified location
Aggregate your structured and unstructured data into a single repository to save time, money, and resources. Data lakes combine secure storage with domain-agnostic analytics for more effective threat detection and investigation.
Step 2: Use integrations to discover trends or potential threats
Increase the velocity and accuracy of threat detection with integrations to applications that provide insight to threats. Cloud Infrastructure Security offers numerous out-of-the-box integrations with queries for custom searching and monitoring.
Step 3: Configure robust alerting policies to notify SecOps teams when changes or outliers occur
The quicker your team can get to work, the quicker investigation and mitigation can happen. With Sumo Logic Monitors, teams can track and build alerts that fit their unique requirements, instead of getting hit with alerts that are too vague or numerous. You can create fine-grained conditions under which alerts trigger, letting you customize them to reduce noise.
Step 4: Perform root cause analysis to investigate the threat fully
Attacks may persist without further investigation and patches, so it’s critical to find and patch any vulnerabilities as soon as possible. Sumo Logic provides broad-reaching search capabilities so teams can perform extensive threat investigations quickly.
Pre-built apps for threat detection and investigation
Install the following apps to get dashboards, queries, and alerting for security monitoring and threat investigation.
- Cloud Infrastructure Security for AWS. App that provides visibility into your AWS environment to give you insights into active threats, security control failures, and suspicious activity.
- Security Analytics. App for alert analysis and Entity risk assessment.
- Security and threat detection. Apps for security products, such as firewall tools, endpoint protection applications, and security automation and orchestration programs. For ex ample, the Threat Intel Quick Analysis app comes preloaded with queries and dashboards that leverage CrowdStrike’s threat intelligence database.
- Cloud security monitoring and analytics. Apps that provide security insights for data sources such as Windows, Linux, AWS CloudTrail, AWS VPC Flows, and Palo Alto Networks Firewalls.
- Global Intelligence Service. Apps that provide real-time security intelligence for detection, prioritization, investigation, and workflow.
Build a dashboard for threat detection and investigation
While the pre-built apps can meet many of your needs, you can also build your own dashboards. In this section, we show you how to build an example dashboard for threat detection and investigation.
The steps in this section describe how to query AWS CloudTrail logs to monitor security data. You can search AWS CloudTrail logs to extract the user, event, and IP addresses as metadata. Because they're in JSON format, you'll use the parse json operator. This way, you can use the extracted values later to monitor user activity. (To perform the steps in the section, you must first have set up collection of CloudTrail logs.) AWS CloudTrail logs contain information about requests for resources in your account, such as:
- who made the request
- the services used
- the actions performed
- parameters for the action
After you build the dashboard to find and monitor security events, we'll show you how to enhance the dashboard to do the following threat investigations:
- Detect brute force attempts by monitoring AWS CloudTrail data for a high number of failed login attempts within a period of time. Brute force attacks are when a hacker tries many different passwords to attempt to gain access. These attacks are a common cause of security breaches on governments, businesses, organizations, and private individuals.
- Detect land speed violations by using geo lookup location data and combining it with timestamps and the Haversine formula. Land speed violations, also known as impossible travel, are a type of suspicious activity where a user logs in to an account in two different locations within a short period of time. If there are two logins to the same account on opposite sides of the globe in the same hour, at least one of those logins was probably illegitimate.
- Look up user information with CrowdStrike to see if any of the IP addresses you have logged are known threats or have been tied to malicious activity.
Step 1: Monitor user activity with a dashboard
We are going to create a dashboard to look at our security activity in several different ways. In this step you will query CloudTrail logs to create a Top 10 User Activity list, turn it into a bar chart, and add it to your dashboard.
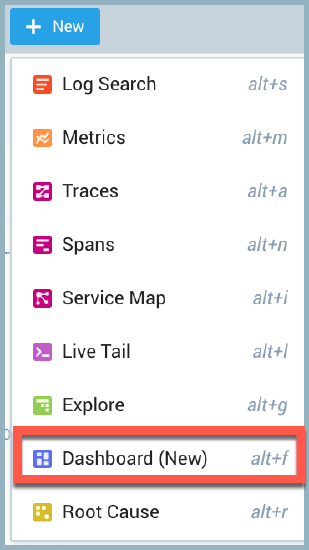
- From the Sumo Logic interface, click on the + New button and select the Dashboard (New) option.
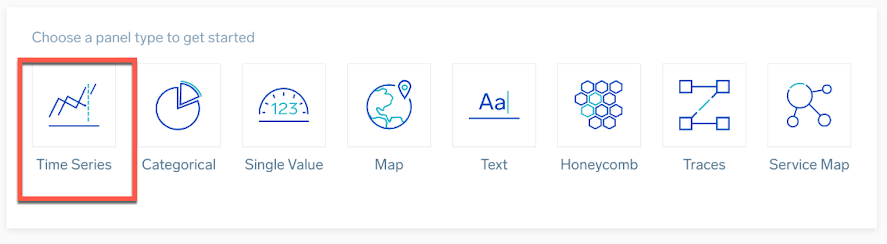
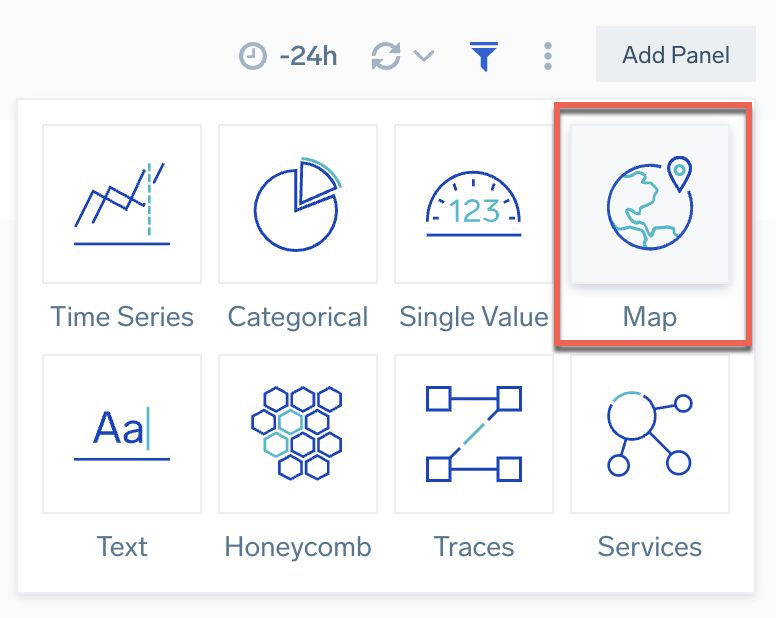
- Select a Time Series panel.
- Create a CloudTrail query to identify bad actors.
- Copy or type the following query to the query window. (In the query, replace
Labs/AWS/CloudTrailwith a valid source category for AWS CloudTrail logs in your environment.)
_sourceCategory=Labs/AWS/CloudTrail
| json field=_raw "userIdentity.userName" as actor
| json field=_raw "eventType" as event_type
| json field=_raw "sourceIPAddress" as src_ip
| json field=_raw "eventName" as event_name
| count by actor,event_type,event_name
| top 10 actor by event_type,_count
| transpose row actor column event_type
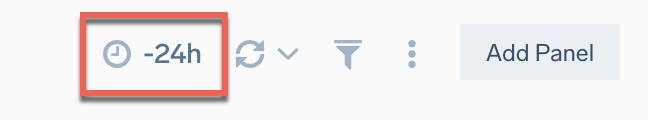
Notice how this query searches AWS CloudTrail logs to extract the user, event, IP addresses, and event names as metadata using a parse json command, so you can use the extracted values to monitor user activity.- In the upper right, change the time frame for the query to be for the last 24 hours.
- Press Enter or click the magnifying glass icon to run the search.
- Copy or type the following query to the query window. (In the query, replace
- In the Panel Settings area, change the chart type to Bar.
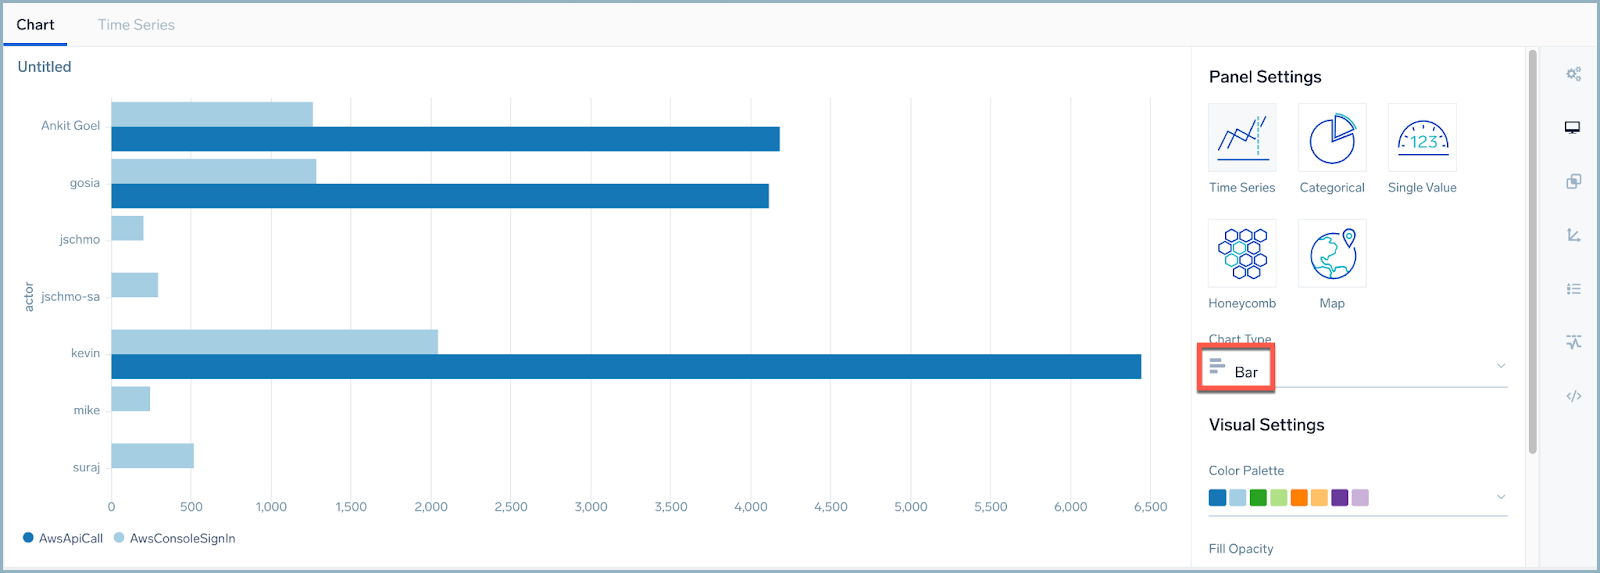
- In the upper left corner of your bar chart, change the panel title to Top 10 User Activity.
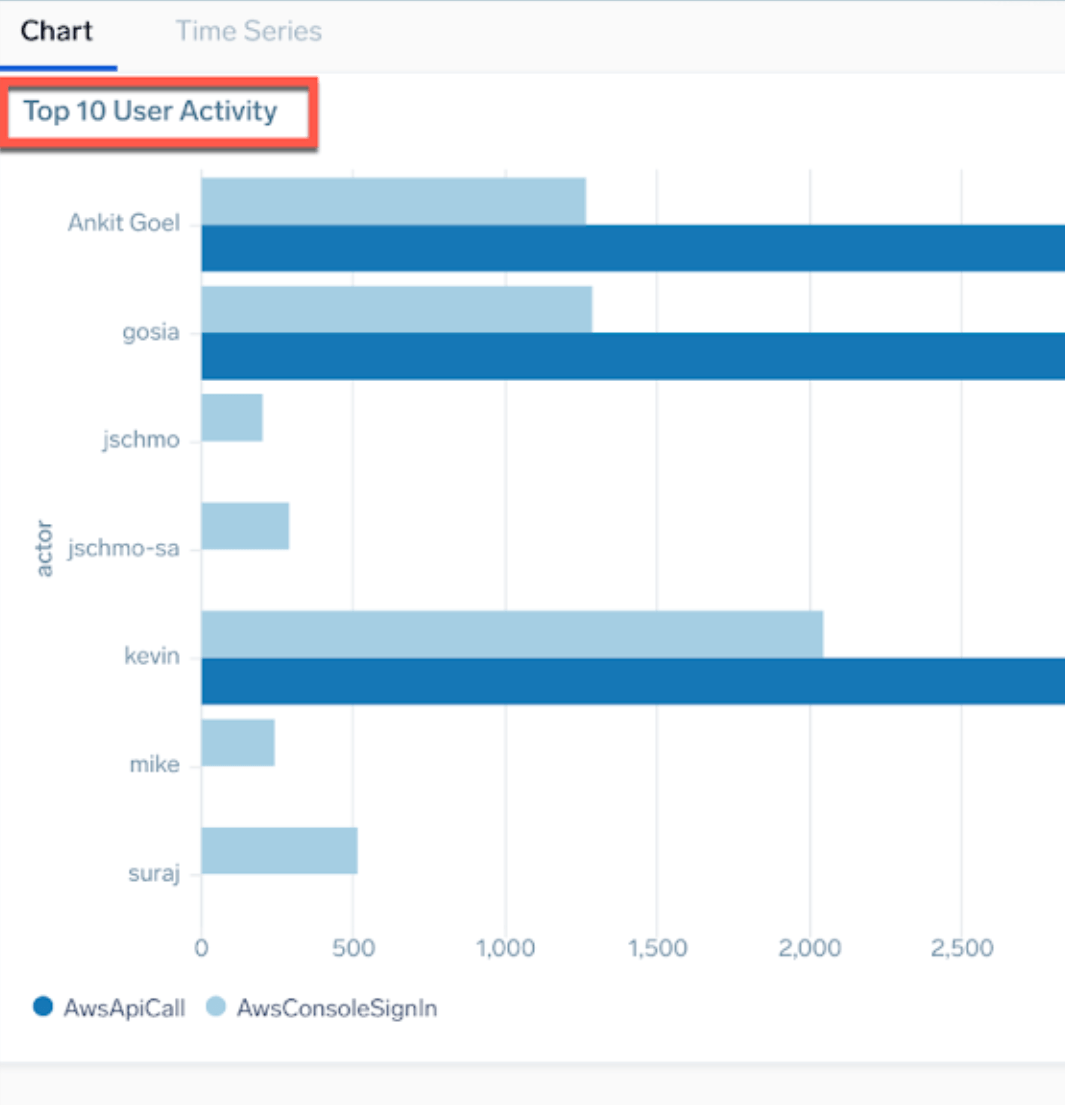
- Click the Add to Dashboard button in the top right corner. The dashboard displays the panel you created.
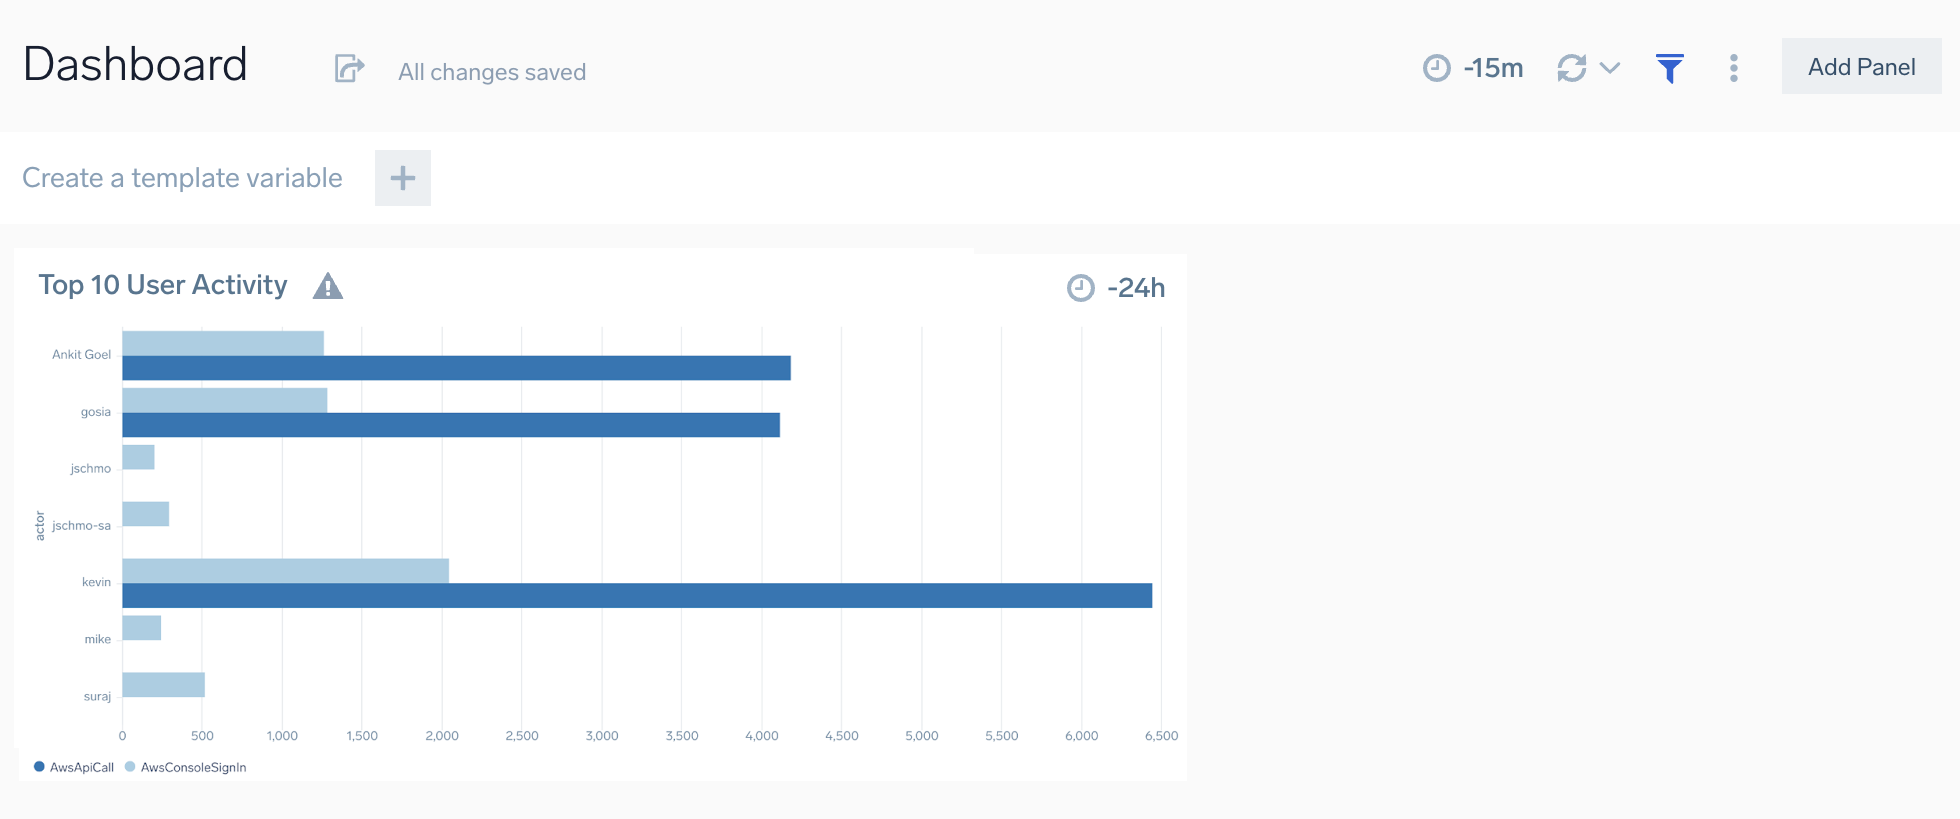
Step 2: Create dashboard template variables
You can add more flexibility to your queries and dashboard outputs by using template variables.
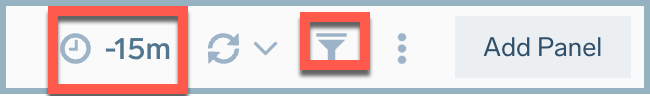
- In the upper right corner of the dashboard, change the time range to 24 hours.
- Click on the filter icon to display the template variable bar.
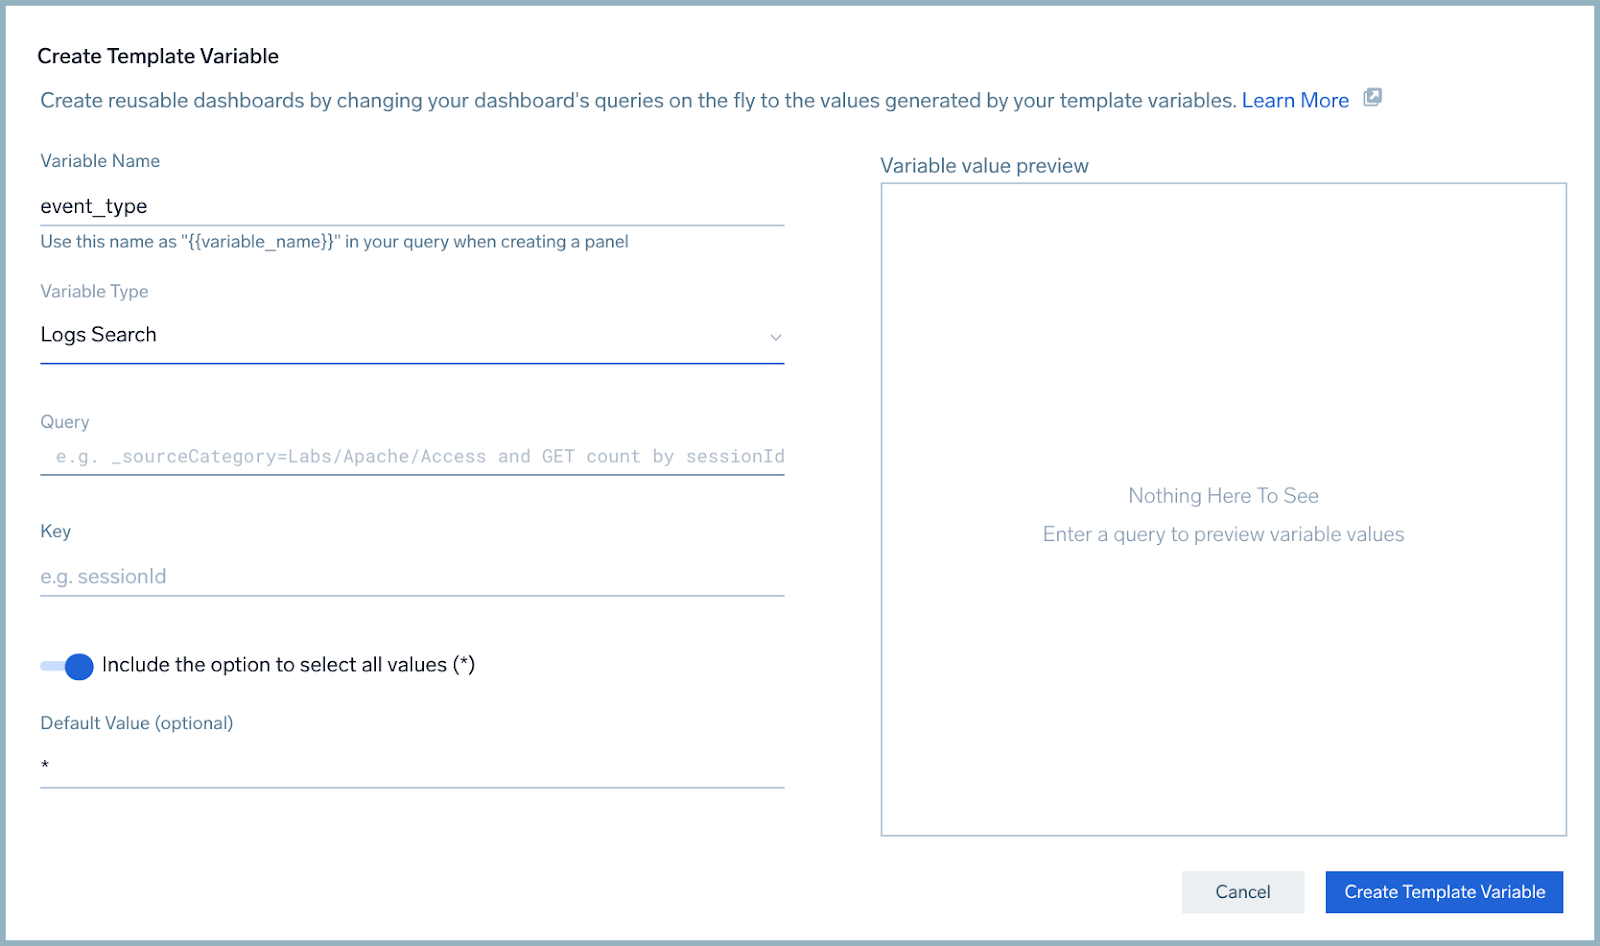
- In the template variable bar, select Create a Template Variable.
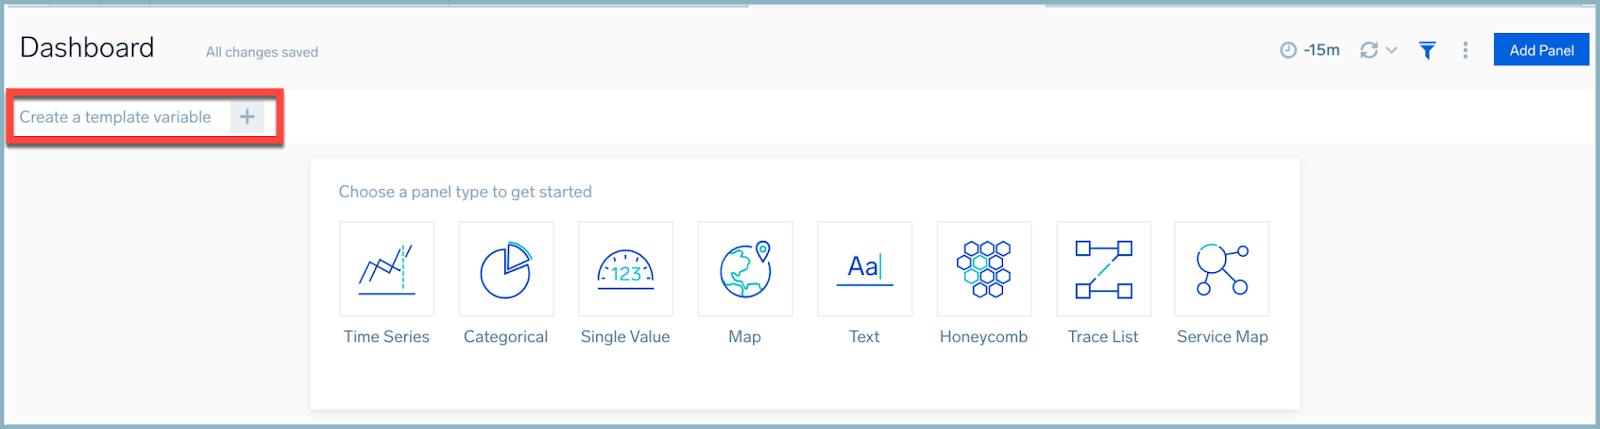
- In this panel for the Variable Name enter event_type and for the Variable Type, select Logs Search.
- For the query paste the following. (In the query, replace
Labs/AWS/CloudTrailwith a valid source category for AWS CloudTrail logs in your environment.)_sourceCategory=Labs/AWS/CloudTrail
| json field=_raw "eventType" as event_type
| count by event_type
| fields - _count - Under the Key field, select event_type. Notice that the right side of the panel populates with the values created by the query.
- Make sure the Include the option to select all values (*) selector is active.
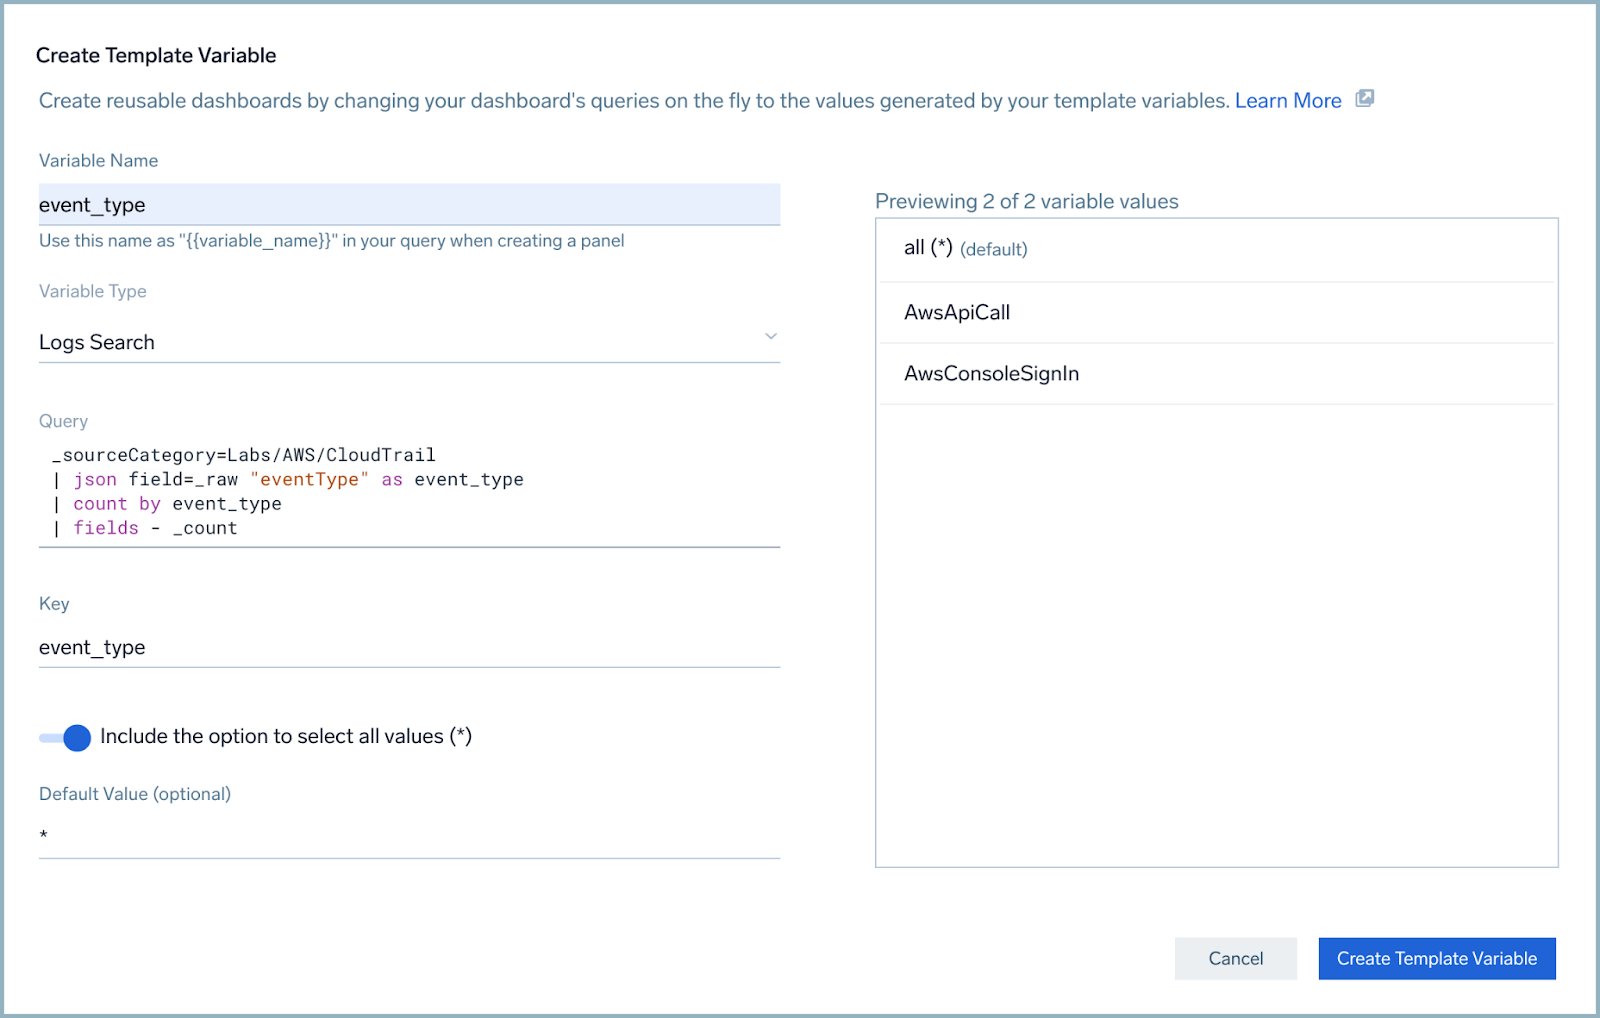
- Click the Create Template Variable on the lower right. A variable selector called event_type is now visible on the dashboard bar.
- Create another variable called actor. Use the following to create the elements that are needed for this template variable.
- Variable Name: actor
- Variable Type: Logs Search
- Query (replace
Labs/AWS/CloudTrailwith a valid source category for AWS CloudTrail logs in your environment):_sourceCategory=Labs/AWS/CloudTrail
| json field=_raw "userIdentity.sessionContext.sessionIssuer.userName" as actor
| count by actor
| fields - _count - Key: actor
- Include the option to select all values (*): Yes
- Your results look like something like this.
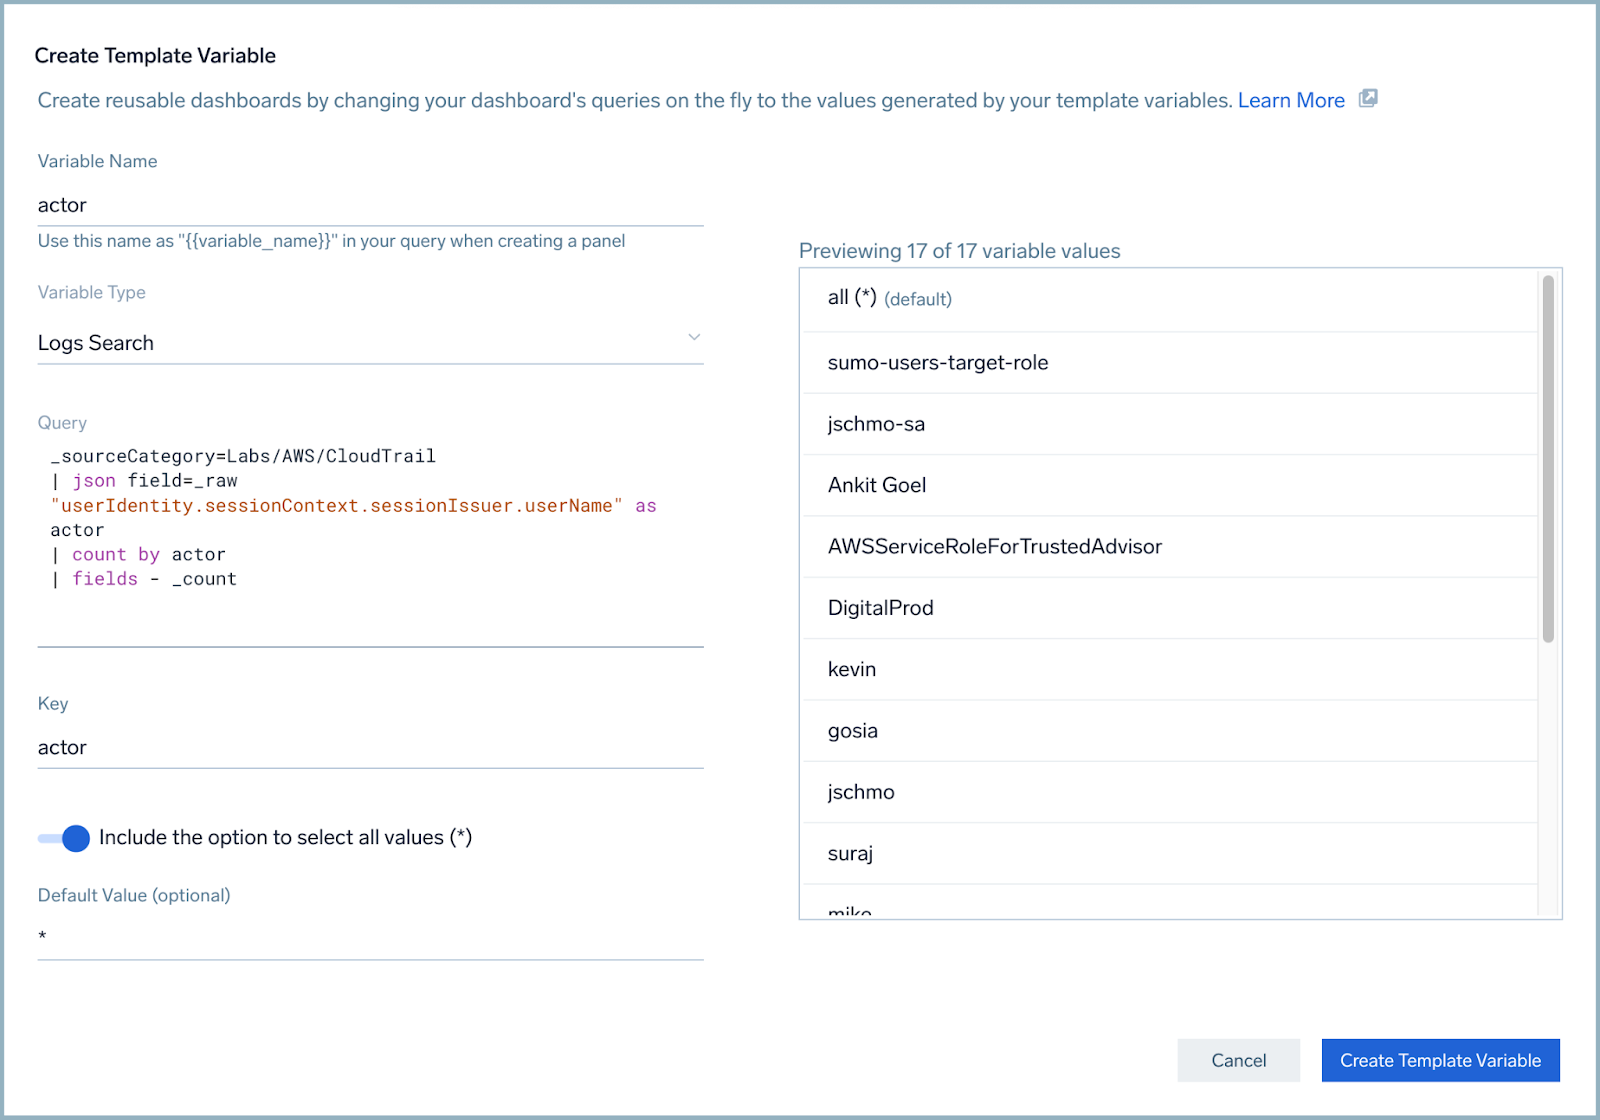
- Click the Create Template Variable button.
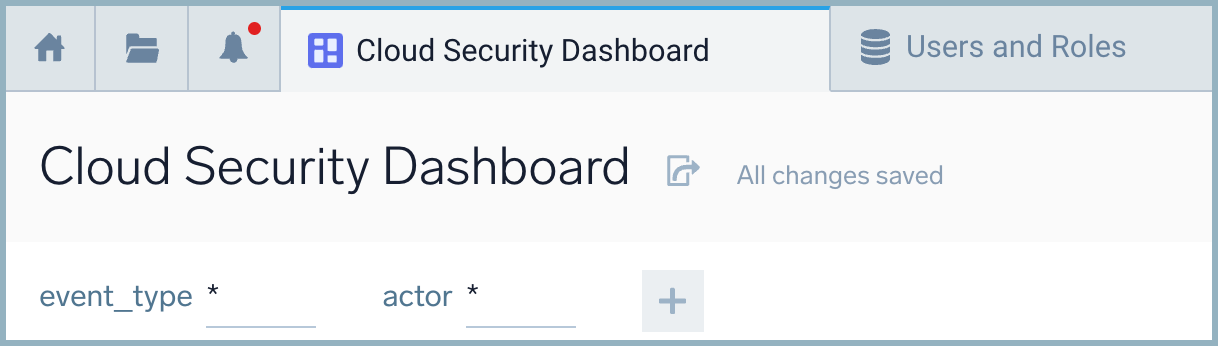
- In the upper left of the dashboard, rename your dashboard to Cloud Security Dashboard.
We now want to modify our query to take advantage of the variables we have created. This will require us to add a "where" clause and reference the parameter by its name. - Click on the three vertical dots in the upper right corner of the Top 10 User Activity panel.
- Select the Edit option so you can modify your query.
- We want to filter by event_type in our panel, but allow the dashboard viewer options to pick the event type. Add a new line to the query by pressing Shift + Enter and type or copy the following code:
Your query should now look something like this:
| where event_type matches "{{event_type}}"
| where actor matches "{{actor}}"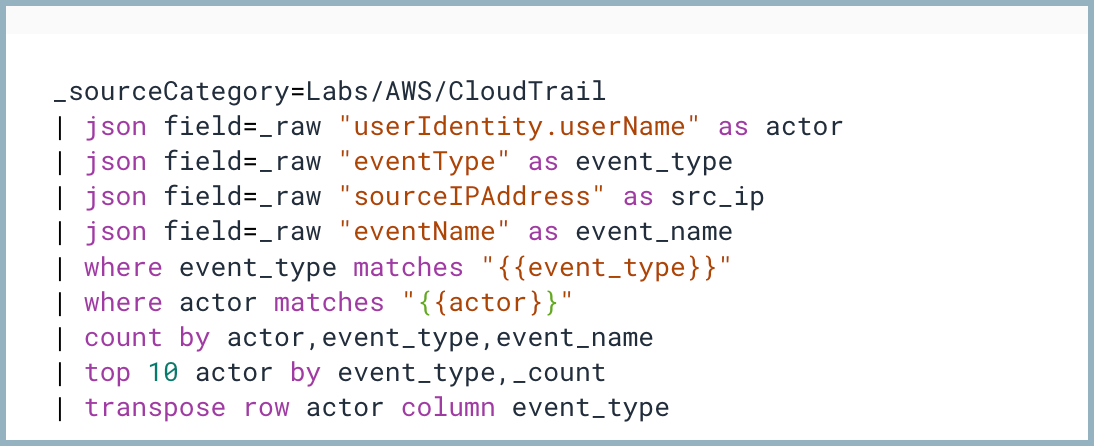
- Click the Update Dashboard button.
You can test these changes by selecting different event_types and actors from the template fields in the dashboard bar. As you select different values you will see the dashboard panel change automatically. Select the * option as a variable to see all options. When you are done testing, ensure both event_type and actor template variables are set to * before continuing.
Step 3: Monitor geolocation of console logins
The lookup operator maps data to other meaningful data stored in Sumo Logic.
To see where your users are logging in from across the world, you can use geo lookups. You can create maps with geo lookups, which can help you visualize and quickly identify where users are logging in from. You can then use this information to ensure all logins are from expected locations, and detect potential login threats.
For example, if you expect all your users to be located in Europe, but you are getting a large number of logins from South America, this might be worth investigating. There could be potential hackers in the unexpected location, or it could be a sign that an advertising campaign was accidentally deployed in the wrong region. In this step, we'll create a map that monitors where users are logging in from.
As another example, let's say one of your employees logged in from both Canada and Australia, on the same day only two hours apart. You know this employee lives in Toronto and travels frequently. So, the Canadian login is expected. Normally, the Australian login would be expected too, since this employee travels so often. However, since it occurred only two hours after a Toronto login, you conclude it's malicious activity. This type of suspicious activity is called a landspeed violation. We'll show you how to query for them.
We want to see where our users are logging in from around the globe. So, in this step, we are going to create a query to get the IP address and use the Lookup function to get the latitude and longitude of where that IP address is located.
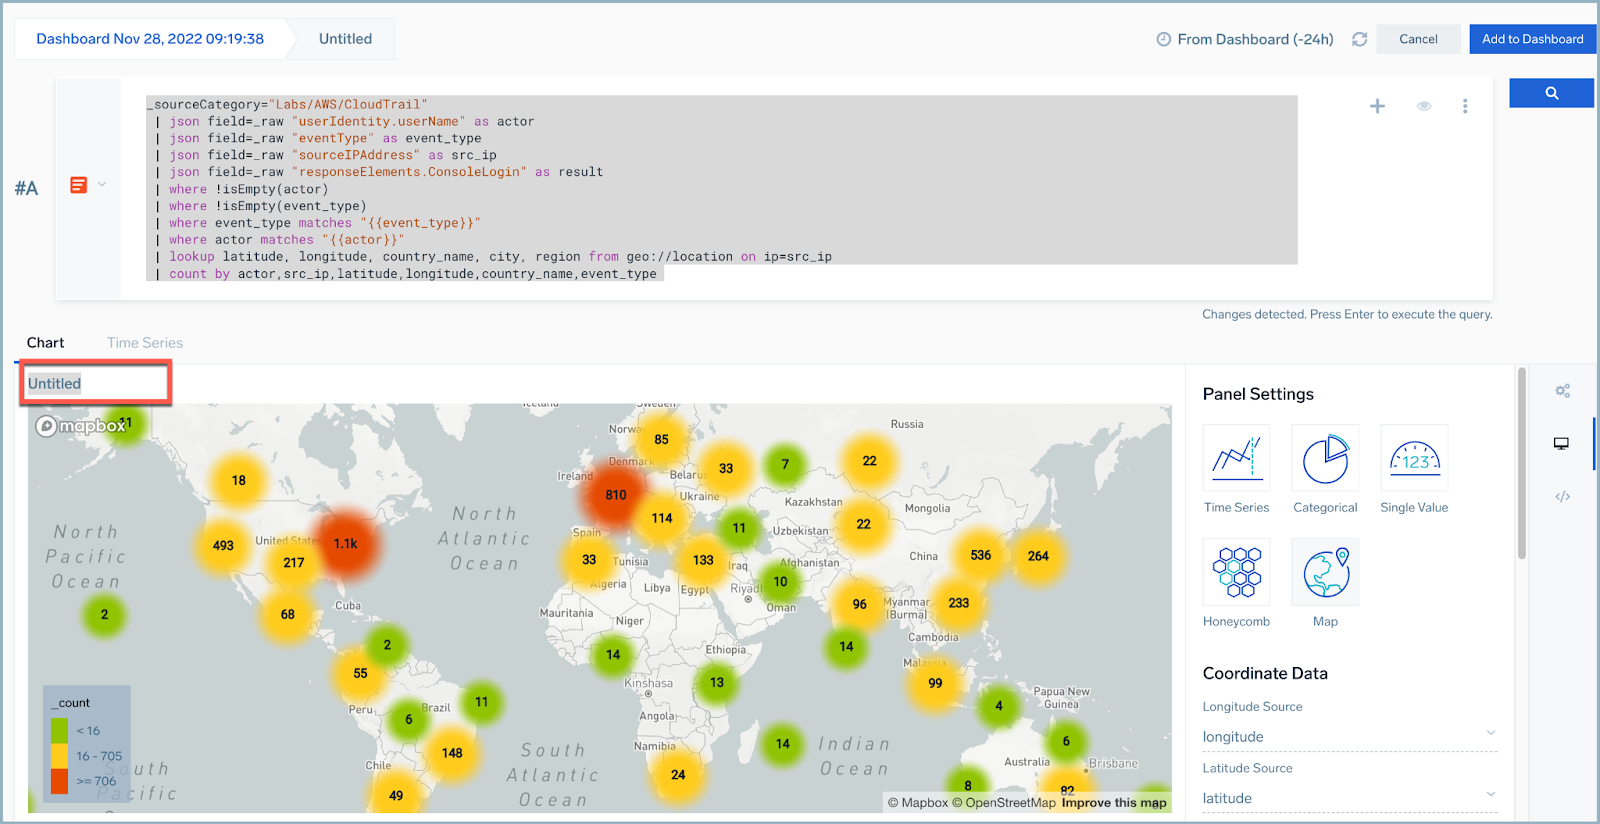
- Click Add Panel and then Map.
- Copy or type this code to the query window. (Replace
Labs/AWS/CloudTrailwith a valid source category for AWS CloudTrail logs in your environment.)_sourceCategory=Labs/AWS/CloudTrail
| json field=_raw "userIdentity.userName" as actor
| json field=_raw "eventType" as event_type
| json field=_raw "sourceIPAddress" as src_ip
| json field=_raw "responseElements.ConsoleLogin" as result
| where !isEmpty(actor)
| where !isEmpty(event_type)
| where event_type matches "{{event_type}}"
| where actor matches "{{actor}}"
| lookup latitude, longitude, country_name, city, region from geo://location on ip=src_ip
| count by actor,src_ip,latitude,longitude,country_name,event_type - Click the magnifying glass icon to perform a search. If results do not display, select a longer time frame.
- Name the panel Geo Location of Console Logins.
- Click the Add to Dashboard button.
note
You can change the values of the dashboard template variables you created in the earlier step, and see the effect on your dashboard panels.
Step 4: Monitor failed login attempts
Now we want to see if users are failing to log in, which either might be an indication of users forgetting their passwords, or someone else trying to log in using stolen user credentials.
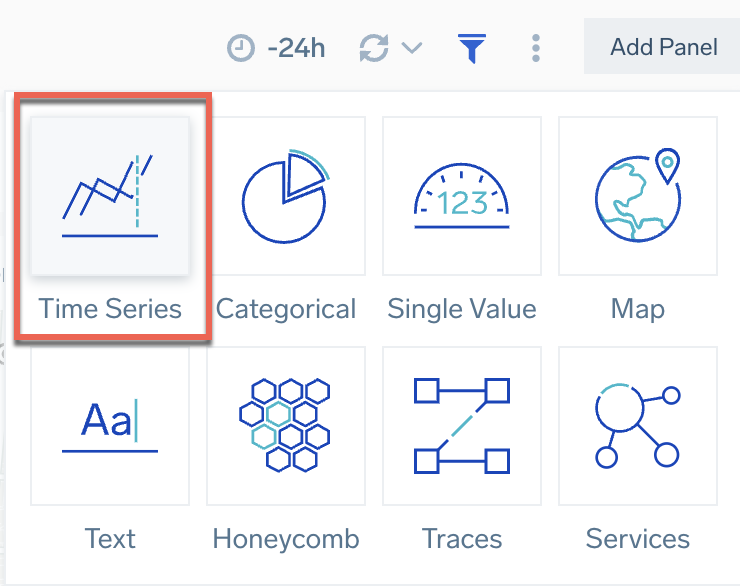
- Click Add Panel and then Time Series.
- Copy or type this code to the query window. (Replace
Labs/AWS/CloudTrailwith a valid source category for AWS CloudTrail logs in your environment.)_sourceCategory=Labs/AWS/CloudTrail
| json field=_raw "userIdentity.userName" as actor
| json field=_raw "eventType" as event_type
| json field=_raw "sourceIPAddress" as src_ip
| json field=_raw "responseElements.ConsoleLogin" as result
| json field=_raw "eventName" as event_name
| where actor matches "{{actor}}"
| where !isEmpty(actor)
| where !isEmpty(event_type)
| where result = "Failure"
| where event_type = "AwsConsoleSignIn"
| timeslice 1h
| count by _timeslice,actor,event_type,event_name,result
| top 10 actor by _timeslice,event_type,result,_count - Click the magnifying glass icon to perform a search. If results do not display, select a longer time frame.
- Under Chart Type, select Table.
- Rename this panel Top 10 Number of Failed Login Attempts.
- Click the Add to Dashboard button.
Your dashboard should now look something like this: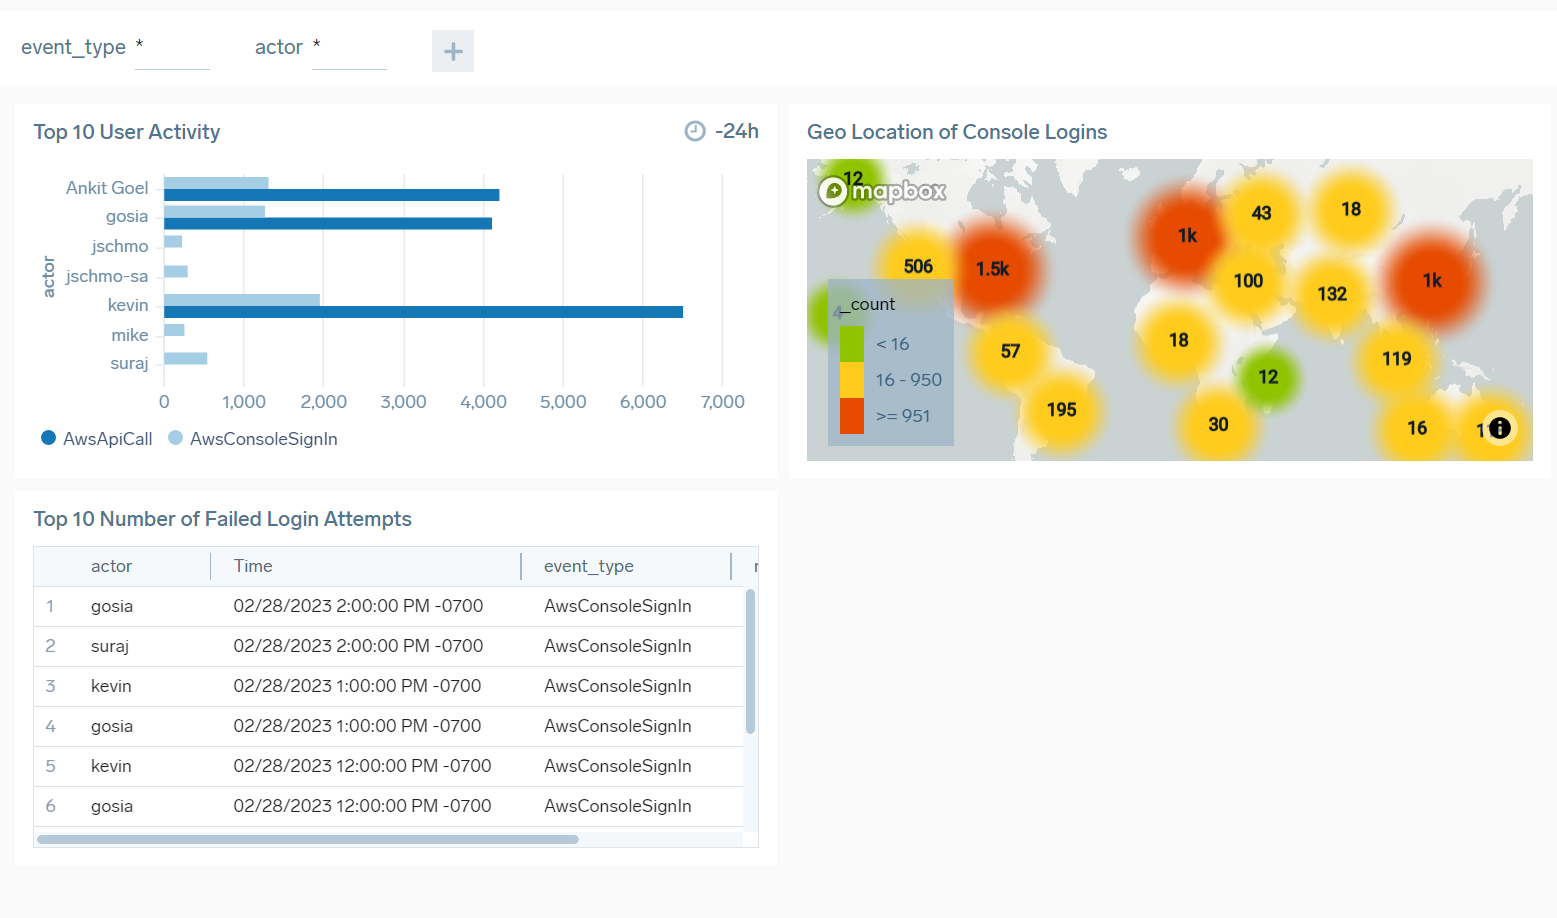
Step 5: Detect brute force attacks
In the previous steps, we showed you how to build a dashboard to detect and monitor security data. In the following steps, we'll enhance the dashboard to perform threat investigation.
In this step, we'll show you how to detect brute force attacks. Brute force attacks are generally noted by a user failing to login a number of times, and then logging in successfully. Let's write a query to look for this and display the results.
- Click Add Panel and Time Series.
- Type or paste the following code into the query window. (Replace
Labs/AWS/CloudTrailwith a valid source category for AWS CloudTrail logs in your environment.)_sourceCategory=Labs/AWS/CloudTrail
| json field=_raw "userIdentity.userName" as actor
| json field=_raw "eventType" as event_type
| json field=_raw "sourceIPAddress" as src_ip
| json field=_raw "responseElements.ConsoleLogin" as result
| json field=_raw "eventName" as event_name
| where event_type matches "{{event_type}}"
| where actor matches "{{actor}}"
| timeslice 1h
| if(result = "Success",1,0) as success_count
| if(result = "Failure",1,0) as failure_count |sum(success_count) as Success, sum(failure_count) as Failure by _timeslice,actor,event_type
| where Failure>0
| Failure/Success*100 as Failure_percent
| order by Failure_percent desc
| format("%.2f", Failure_percent) as Failure_percent - Click the magnifying glass icon to perform a search. If results do not display, select a longer time frame. (It's possible there have been no brute force attacks in the selected time frame, in which case no results will display.)
- Under Chart Type, select Table.
- Rename this panel Account Compromise Detection From Brute Force Attack.
- Click the Add to Dashboard button.
If there have been brute force attacks during the queried time frame, your the new panel might look like this: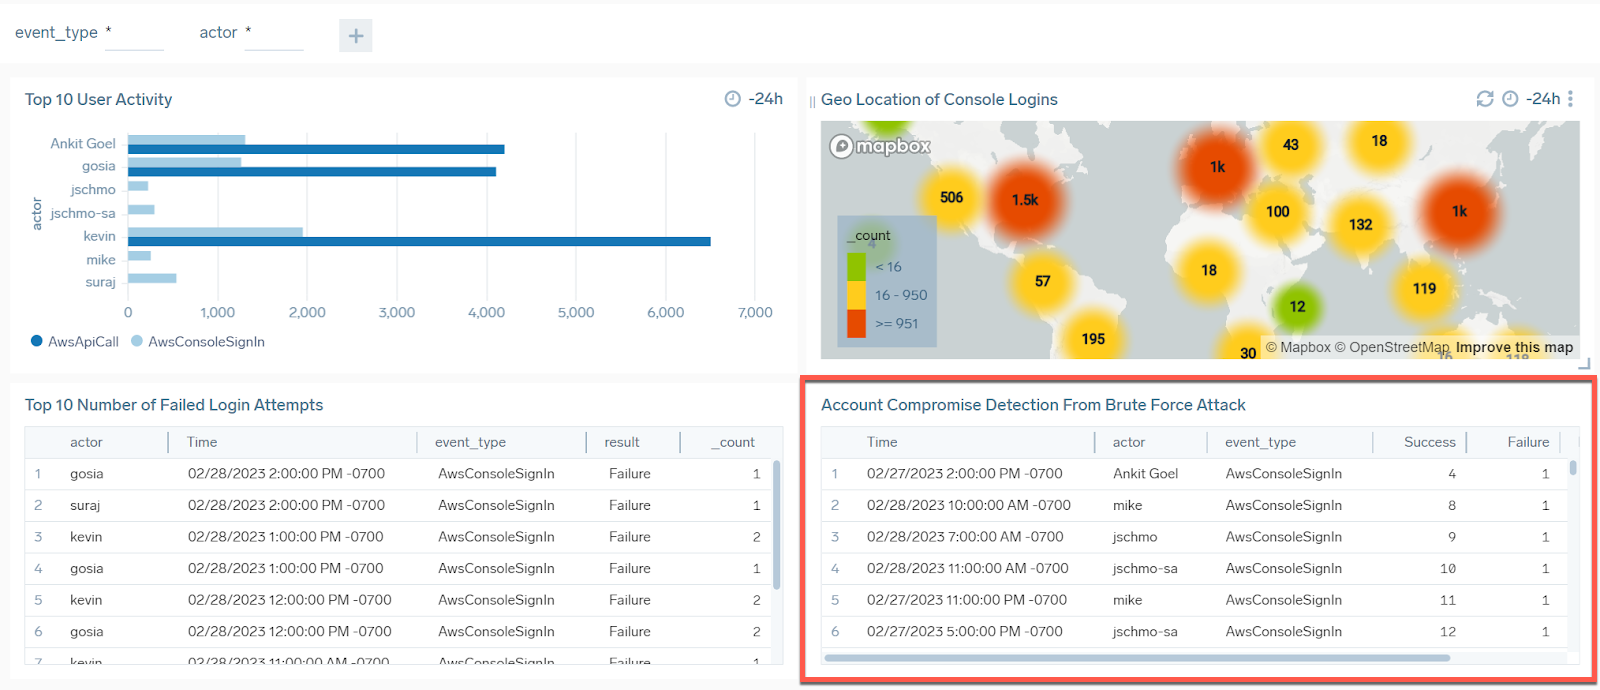
Step 6: Detect landspeed violations
A "landspeed violation" occurs when a user logs in from an IP address and then logs in a short time later from a different IP address where the location is a significant distance from the first location. An example would be if someone logged in from New York City USA, and then 4 hours later logged in using the same IP address from Amsterdam in the Netherlands. It’s impossible to get from New York City to Amsterdam in 4 hours, thus it is an example of a landspeed violation that could indicate stolen or compromised credentials.
- Click Add Panel and Time Series.
- Type or paste the following code into the query window. (Replace
Labs/AWS/CloudTrailwith a valid source category for AWS CloudTrail logs in your environment.)The query does the following:_sourceCategory=Labs/AWS/CloudTrail
| json "userIdentity.userName","sourceIPAddress" as user, ip nodrop
| where user matches "{{actor}}"
| where isPublicIP(ip)
| min(_messagetime) AS login_time BY user, ip
| sort BY user, +login_time
| ipv4ToNumber(ip) AS ip_decimal
| backshift ip_decimal BY user
| backshift login_time AS previous_login
| where !(isNull(_backshift))
| toInt(floor(_backshift/pow(256,3))) AS octet1 | toInt(floor((_backshift-octet1*pow(256,3))/pow(256,2))) AS octet2 | toInt(floor((_backshift-(octet1*pow(256,3)+octet2*pow(256,2)))/256)) AS octet3 | toInt(_backshift-(octet1*pow(256,3)+octet2*pow(256,2)+octet3*256)) AS octet4
| concat(octet1,".",octet2,".",octet3,".",octet4) AS previous_ip
| lookup latitude AS lat1, longitude AS long1, country_name AS country_name1 FROM geo://location ON ip
| lookup latitude AS lat2, longitude AS long2, country_name AS country_name2 FROM geo://location ON ip=previous_ip
| where !(isNull(lat1))
| where !(isNull(long1))
| where !(isNull(lat2))
| where !(isNull(long2))
| haversine(lat1, long1, lat2, long2) AS distance_kms
| (login_time - previous_login)/3600000 AS login_time_delta_hrs
| distance_kms/login_time_delta_hrs AS apparent_velocity_kph
| where apparent_velocity_kph > 0
| 500 AS suspicious_speed
| where apparent_velocity_kph > suspicious_speed
| concat(ip,", ",previous_ip) AS ip_addresses
| if(country_name1 <> country_name2,concat(country_name1,",",country_name2),country_name1) AS countries
| fields user, ip_addresses, countries, distance_kms,login_time_delta_hrs,apparent_velocity_kph
| where !isNull(user)
| where apparent_velocity_kph != "Infinity"
| sort by apparent_velocity_kph- Converts the IP address to a decimal and moves through the users' IP addresses getting both the last login time and the previous login time.
- Converts the decimal IP address back to an IPv4 address.
- Looks up the country information for each IP address and filters out any NULL values.
- Uses the Haversine formula to calculate the kilometers in distance between the two locations.
- Calculates the time difference between the latest and previous logins, and then calculates, based on the distance, how fast that user must have been traveling in order to have personally logged in at both locations and times.
- Adds the speed threshold above which the calculated speed would be considered "suspicious" or "unrealistic" (we use 500 km/hr in this case).
- Clean up the results and format for better presentation on the dashboard.
- Click the magnifying glass icon to perform a search. If results do not display, select a longer time frame. (It's possible there have been no landspeed violations in the selected time frame, in which case no results will display.)
- Under Chart Type, select Table.
- Rename this panel Landspeed Violation.
- Click the Add to Dashboard button.
Step 7: Look up user information with CrowdStrike
We need a way to see if any of the IP addresses we have logged are known threats or have been tied to malicious activity. Sumo Logic has a partnership with CrowdStrike, which allows us to look up IP addresses, email addresses, URLs, and other entities to see if they are known by CrowdStrike.
- Click Add Panel and Time Series.
- Type or paste the following code into the query window. (Replace
Labs/AWS/CloudTrailwith a valid source category for AWS CloudTrail logs in your environment.)_sourceCategory=Labs/AWS/CloudTrail
| parse regex "(?<ip_address>\b\d{1,3}\.\d{1,3}\.\d{1,3}\.\d{1,3})" multi
| where ip_address != "0.0.0.0" and ip_address != "127.0.0.1"
| lookup type, actor, raw, threatlevel as malicious_confidence from sumo://threat/cs on threat=ip_address
| where type="ip_address" and !isNull(malicious_confidence)
| if (isEmpty(actor), "Unassigned", actor) as Actor
| parse field=raw "\"ip_address_types\":[\"*\"]" as ip_address_types nodrop
| parse field=raw "\"kill_chains\":[\"*\"]" as kill_chains nodrop
| timeslice 1m
| count _timeslice, ip_address, malicious_confidence, actor, kill_chains, ip_address_types, _sourceCategory, _source
| fields - ip_address,malicious_confidence,actor,kill_chains,ip_address_types,_sourceCategory,_source | count by _timeslice
| outlier _count window=5,threshold=3,consecutive=1,direction=+- - Click the magnifying glass icon to perform a search. If results do not display, select a longer time frame. (It's possible there have been no landspeed violations in the selected time frame, in which case no results will display.)
- Under Chart Type, select Line Chart.
- Rename this panel CrowdStrike Data.
- Click the Add to Dashboard button.
Now that you've created a dashboard, you can share it or export it. Exporting and importing dashboards lets you use dashboards created in one org or account on another org or account.