Filter and Shape Your Trace Data at Output
You may ask yourself, "What if I do not want to send all my trace data to Sumo Logic?". With our OpenTelemetry collector, you can define custom rules to filter and extract data based on your selection.
Our OpenTelemetry collector is uniquely capable of shaping trace data at output. You can define rules in a cascading fashion, assign different volume pool sizes to each rule, and give them different priorities.
Most of the following configuration rules are based on whole trace inspection (end-to-end trace duration) and the decision of whether to send a trace or not, is also based on all or none spans for the trace. Therefore it is important that a single collector working with that capability enabled always sees a complete trace.
Output-level filtering ensures you will always have valuable, useful, and cost-optimized data for backend analysis. Most users want to filter tracing data to help with scaling, privacy, or cost optimization for large environments.
For best results, perform filtering on a central instance of Aggregating OpenTelemetry Collector (see the following diagram), as it gives possibilities to act on whole trace, rather than individual span level.
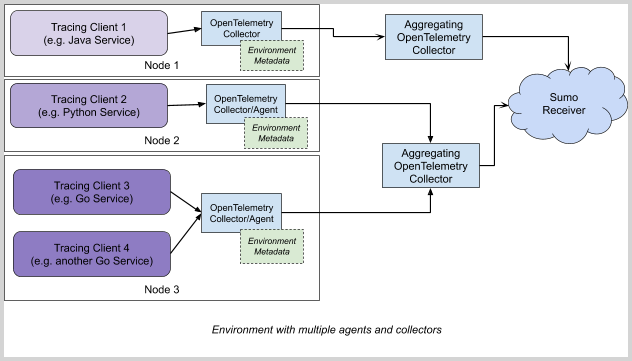
The aggregating collector can receive data from local collectors/agents or directly from the tracing client.
Prerequisites
An installed and running OpenTelemetry Collector version v0.38.1-sumo or higher. For details, see either:
- Tracing collection for Kubernetes environments (with sumologic-kubernetes-collection v2.2.1 or higher)
- Tracing collection for other environments
Configuring filters and traffic-shaping rules
Modify the configuration for the Aggregating OpenTelemetry Collector to enable filters and create traffic shaping rules.
To enable the filter, replace your existing cascading_filter: configuration in processors: section of your OT configuration (values.yaml in Kubernetes) with the following snippet provided (after modifying it for your needs) and apply configuration by Helm upgrade (in Kubernetes) and restart.
The cascading filter combines the spans into traces and then applies a three-stage traffic shaping: pattern filtering > probabilistic sampling > tail-based filtering.
You can modify to adjust each of the sections to enable and adjust each of required stages.
Pattern Filtering
Pattern Filtering (trace_reject_filters) filters out traces where at least one span matches the pattern. For example, you can filter health-checks this way. All remaining traffic is passed to next defined logic.
Probabilistic sampling
Probabilistic sampling (probabilistic_filtering_rate) takes the traffic after initial filtering and randomly select complete traces in that way that overall resulting traffic would not exceed defined number of spans per second. All remaining traffic is passed to next defined logic. You should always have some good sample of all traffic included here for good representation of aggregation metrics.
Tail-based filtering
Tail-based filtering (trace_accept_filters) takes traffic remaining after initial filtering/sampling and picks up to defined number spans per second as specified in the parameters from traces that were longer than defined number of seconds or have at least defined number of errors. The rest of the traffic is disregarded, if that's the last stage (as in the default configuration).
Here's an example configuration that:
- Filters all traces where at least one span has
/healthcheckas operation name - Passes 100 spans/sec max of other traffic in random, in a probabilistic manner
- Passes up to 500 spans/sec of traces longer than 3 seconds
- Passes up to 400 spans/sec of traces with 2 or more error spans
- Passes up to 300 spans/sec of traces where at least one span comes from
login-service
processors:
  cascading_filter:
    # 1. Pattern filtering
    # Adjust the filters as needed
    trace_reject_filters:
       - name: filter_out_pattern
         name_pattern: "/healtcheck" # <- set to filter out spans with name matching this pattern
    # 2. Probabilistic sampling
    # Adjust the limit as needed
    probabilistic_filtering_rate: 100 # <- output limit for this rule in spans/sec
    # 3. Tail-based filtering
    # Adjust as needed
    trace_accept_filters:
      # Adjust the duration threshold and limit as needed
      - name: tail-based-duration
        properties:
          min_duration: 3s      # <- traces longer then this will qualify to be sent
        spans_per_second: 500   # <- output limit for this rule
      # Adjust number of errors and limit as needed
      - name: tail-based-errors
        properties:
          min_number_of_errors: 2 # <- traces with at least this number of errors will qualify to be sent
        spans_per_second: 400     # <- output limit for this rule
      # Adjust number of errors and limit as needed
      - name: tail-based-attributes
        attributes:               # <- traces with at least one span or resource
          - key: service.name     #    matching this attribute will qualify to be sent
            values:
              - login-service     # <- pass all traces where at least one span belongs to "login-service" service
        spans_per_second: 300     # <- output limit for this rule
If you are using non-standard configuration template, ensure cascading_filter and batch are present in the list of processors:
# Include the processor in the tracing pipeline as needed
service:
  pipelines:
    traces:
      receivers: ...
      processors: [..., cascading_filter, batch]
      exporters: ...
By default, the cascading filter waits for 30 seconds before making the decision and can hold up to 100000 traces in memory (if available). This parameter can be fine-tuned using decision_wait and num_traces configuration options. More details on the usage are available at the cascadingfilterprocessor page. For examples, see:
- Kubernetes collection (single traces-sampler pod): custom-values-cascading-filter.yaml
- Non-Kubernetes collection: sampler-configuration-template-with-cascading-filter.yaml
Multiple instances of cascading filter
In case of multiple deployments sharing a single configuration map (k8s) or file of the traces-sampler (cascading_filter instances), an environment variable called SUMO_COLLECTOR_INSTANCES or collector_instances option should be used to scale down properly the spans_per_second global and policy limits. SUMO_COLLECTOR_INSTANCES should be a positive integer corresponding to the number of collectors with configured cascading filters, for example, SUMO_COLLECTOR_INSTANCES=5. As a result, configured the spans_per_second limit will be divided by 5 for global and policy limits.
- Kubernetes collection (multiple traces-sampler pods): multiple-cascading-filter-sampler-instances.yaml
- Non-Kubernetes collection: sampler-configuration-multiple-instances-template.yaml
Resource sizing guide
Because trace filtering requires action on the whole trace, collector buffers the incoming data in memory before making the decision. This impacts the resource usage which must be factored when planning the usage of available memory and CPU. For a collector that has cascading filter enabled, we recommend:
- 1 CPU core per each 25,000 spans/sec on the input
- 4 GB RAM per each 10,000 spans/sec on the input
For example, when 50,000 spans per second are anticipated on the collector input, there should be at least 2 CPU cores and 20 GB RAM available. The actual numbers depend on a number of factors:
- size of spans (such as number of attributes, size of span events)
- cascading filter configuration (such as
decision_waitduration)
Measuring the actual number of spans/sec on the input
To verify the actual number of spans on the input, OpenTelemetry Collector own metrics can be used (available under http://<COLLECTOR_HOST>:8888/metrics in Prometheus/OpenMetrics format). Those could be self-scraped or checked manually.
Among the metrics available, there is otelcol_receiver_accepted_spans, which provides the total number of spans that were received by the collector. This value can be observed over time or divided by collector runtime (available in otelcol_process_uptime metric).
Troubleshooting
When enabled, cascading filter emits logs on startup indicating that the rules have been applied. For example:
2021-11-18T19:50:23.451+0100    info    cascadingfilterprocessor@v0.38.0/processor.go:132    Adding trace reject rule    {"kind": "processor", "name": "cascading_filter", "name": "healthcheck-rule"}
2021-11-18T19:50:23.451+0100    info    cascadingfilterprocessor@v0.38.0/processor.go:169    Adding trace accept rule    {"kind": "processor", "name": "cascading_filter", "name": "test1", "spans_per_second": 50}
2021-11-18T19:50:23.451+0100    info    cascadingfilterprocessor@v0.38.0/processor.go:169    Adding trace accept rule    {"kind": "processor", "name": "cascading_filter", "name": "test2", "spans_per_second": 50}
2021-11-18T19:50:23.451+0100    info    cascadingfilterprocessor@v0.38.0/processor.go:185    Setting total spans per second limit    {"kind": "processor", "name": "cascading_filter", "spans_per_second": 100}
2021-11-18T19:50:23.451+0100    info    cascadingfilterprocessor@v0.38.0/processor.go:202    Setting probabilistic filtering rate    {"kind": "processor", "name": "cascading_filter", "probabilistic_filtering_rate": 8}
Traces will not be emitted by a cascading filter until the decision_wait time passes. When a cascading filter is processing data, it emits a number of metrics that describe actions made by it. Some examples are: otelcol_processor_cascading_filter_count_final_decision and otelcol_processor_cascading_filter_count_policy_decision. They are available at the OpenTelemetry Collector metrics endpoint (http://<OPENTELEMETRY_COLLECTOR_ADDRESS>:8888/metrics) or for Kubernetes through collected metrics (Helm chart flag otelcol.metrics.enabled set to true).