Linux - OpenTelemetry Collector
The Sumo Logic app for Linux allows you to monitor the performance and resource utilization of hosts and processes that your mission-critical applications are dependent upon. In addition to that, it allows you to view information about events, logins, and the security status of your Linux system using Linux system logs.
The app consists of predefined searches and dashboards that provide visibility into your environment for real-time or historical analysis. Our dashboards provide insight into CPU, memory, network, file descriptors, page faults, and TCP connectors. This app uses OpenTelemetry, an open-source collector for the collection of both metrics and log data.
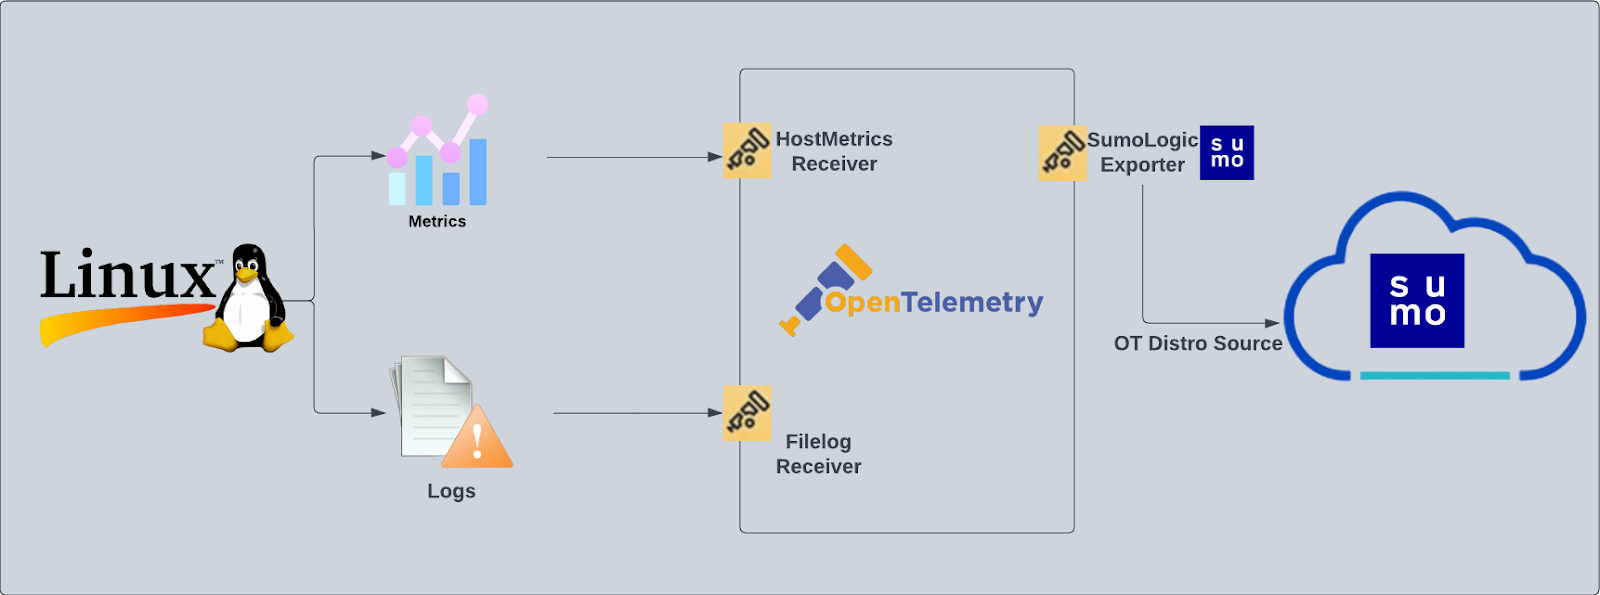
We use the Sumo Logic Distribution for OpenTelemetry Collector to collect Linux metrics and system logs. The OpenTelemetry collector runs on the Linux machine and uses the Host Metric Receiver to obtain Host and process metrics, and the Sumo Logic OpenTelemetry Exporter to send the metrics to Sumo Logic. Linux logs are sent to Sumo Logic through a filelog receiver.
Fields Created in Sumo Logic for Linux
Following are the fields that will be created as part of Linux app install if not already present.
sumo.datasource. Has a fixed value oflinux.deployment.environment. This is a collector level field and is user configured (at the time of collector installation). Through this, the linux host cluster is identified by the environment where it resides. For example:dev,prod, orqa.host.group. This is a collector level field and is user configured (at the time of collector installation). Through this, the linux host cluster is identified.host.name. This is tagged through theresourcedetectionprocessor. It holds the value of the host name where the OTel collector is installed.
Prereqisites
This app is based on the following log files from the Ubuntu Linux machine.
- auth.log
- syslog
- daemon.log
- dpkg.log
- kern.log
- CentOS, Amazon Linux, and Red Hat
- audit/audit.log
- secure
- messages
- yum.log
If you've already configured collection of these log files (for example, during Linux or Linux - PCI app setup), then no additional log file collection is required. If any log files are missing, you can configure the missing file collection in the next step.
For Linux systems with ACL Support, the otelcol install process should have created the ACL grants necessary for the otelcol system user to access default log locations. You can verify the active ACL grants using the getfacl command. Install the ACL in your Linux environment, if not installed.
The required ACL may not be supported for some rare cases, for example, Linux OS Distro, which is officially not supported by Sumo Logic. In this case, you can run the following command to explicitly grant the permissions.
sudo setfacl -R -m d:u:otelcol-sumo:r-x,d:g:otelcol-sumo:r-x,u:otelcol-sumo:r-x,g:otelcol-sumo:r-x <PATH_TO_LOG_FILE>
Run the above command for all the log files in the directory that need to be ingested, which are not residing in the default location.
If Linux ACL Support is not available, traditional Unix-styled user and group permission must be modified. It should be sufficient to add the otelcol system user to the specific group that has access to the log files.
Collection configuration and app installation
You can skip this section if you have already set up the logs collection through Linux PCI or Linux - Cloud Security Monitoring and Analytics app installation. Additional collection is not required as the logs used by this app are already ingested into Sumo Logic.
As part of data collection setup and app installation, you can select the App from App Catalog and click on Install App. Follow the steps below.
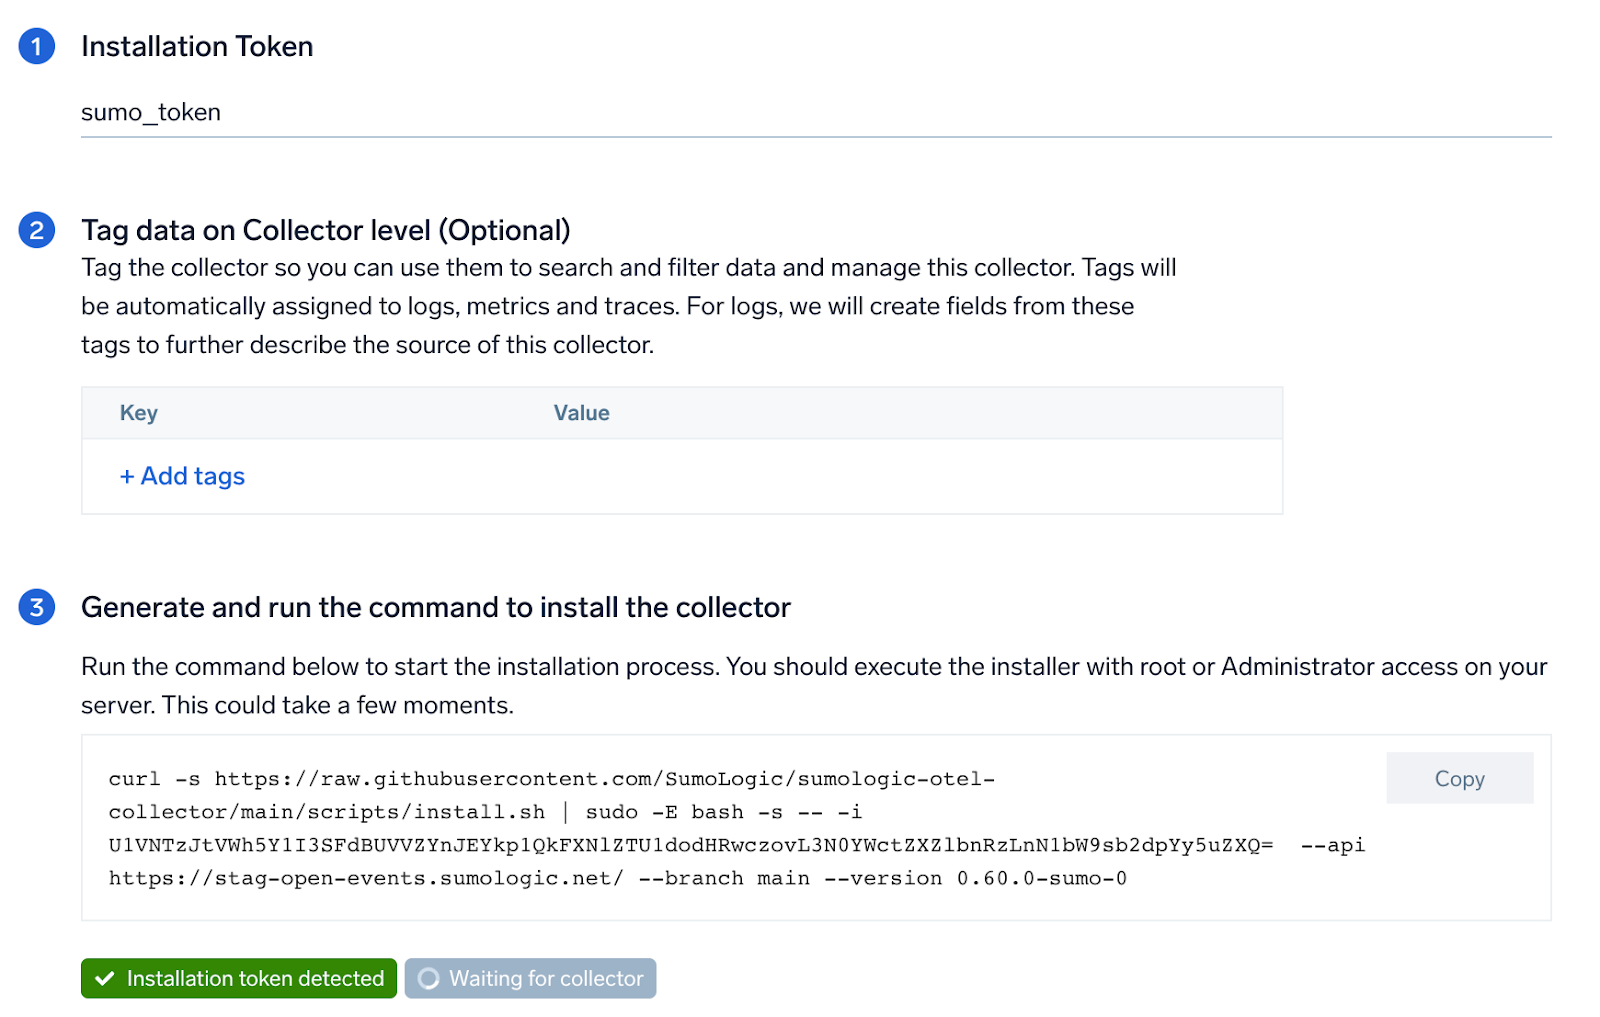
Step 1: Set up Collector
If you want to use an existing OpenTelemetry Collector, you can skip this step by selecting the Use an existing Collector option.
To create a new Collector:
- Select the Add a new Collector option.
- Select the platform where you want to install the Sumo Logic OpenTelemetry Collector.
This will generate a command that you can execute in the machine environment you need to monitor. Once executed, it will install the Sumo Logic OpenTelemetry Collector.
Step 2: Configure integration
In this step, you will configure the yaml file required for Linux Collection. The app requires path for system log file, based on your Linux version used.
Required Logs for Ubuntu
The following logs, located in your Linux machine's /var/log folder, are required for using the Sumo app for Linux with Ubuntu:
auth.logsyslogdaemon.logdpkg.logkern.log
Required Logs for CentOS, Amazon Linux, and Red Hat
The following logs, located in your Linux machine's /var/log folder, are required for using the Sumo app for Linux with CentOS, Amazon Linux, and most Red Hat forks:
audit/audit.logsecureMessagesyum.log
By default, the path for Linux log files required for all the distros are pre-populated in the UI. Not all of the files might be available on your Linux distribution. Optionally, you can remove unwanted file paths from the list. OpenTelemetry collection will still work properly even if not all of the files are present on your system. If in doubt, you can leave the default file paths values.
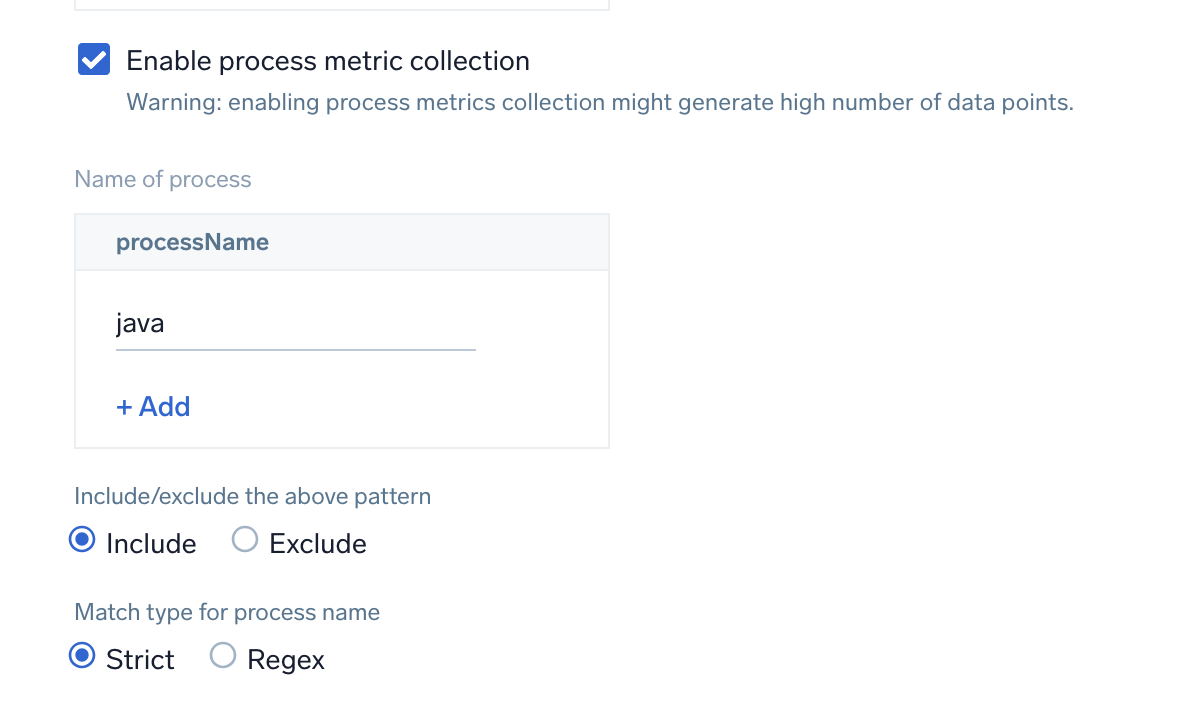
Enable process metric collection (Optional)
By default, the collector will not send process metrics to Sumo Logic. This is because the number of processes running on a host can be very large, which would result in a significant increase in Data Points per Minute (DPM).
Click the Enable process metric collection checkbox to collect process-level metrics.
- Name of process. Add the list of process names.
- Include/Exclude the above pattern. Signifies if you want to exclude or include the metrics for the processes listed previously.
- Match type for process name. Select if the process name given should be considered for a strict match with the host machine processes or if it should be considered as regex when matching.
If you need to edit the process list in the future, you can do this manually in the OTEL config yaml by adding or removing in the names list under process scrapper.
process:
  include:
    names: [ <process name1>, <process name2> ... ]
    match_type: <strict|regexp>
Click on the Download YAML File button to get the yaml file.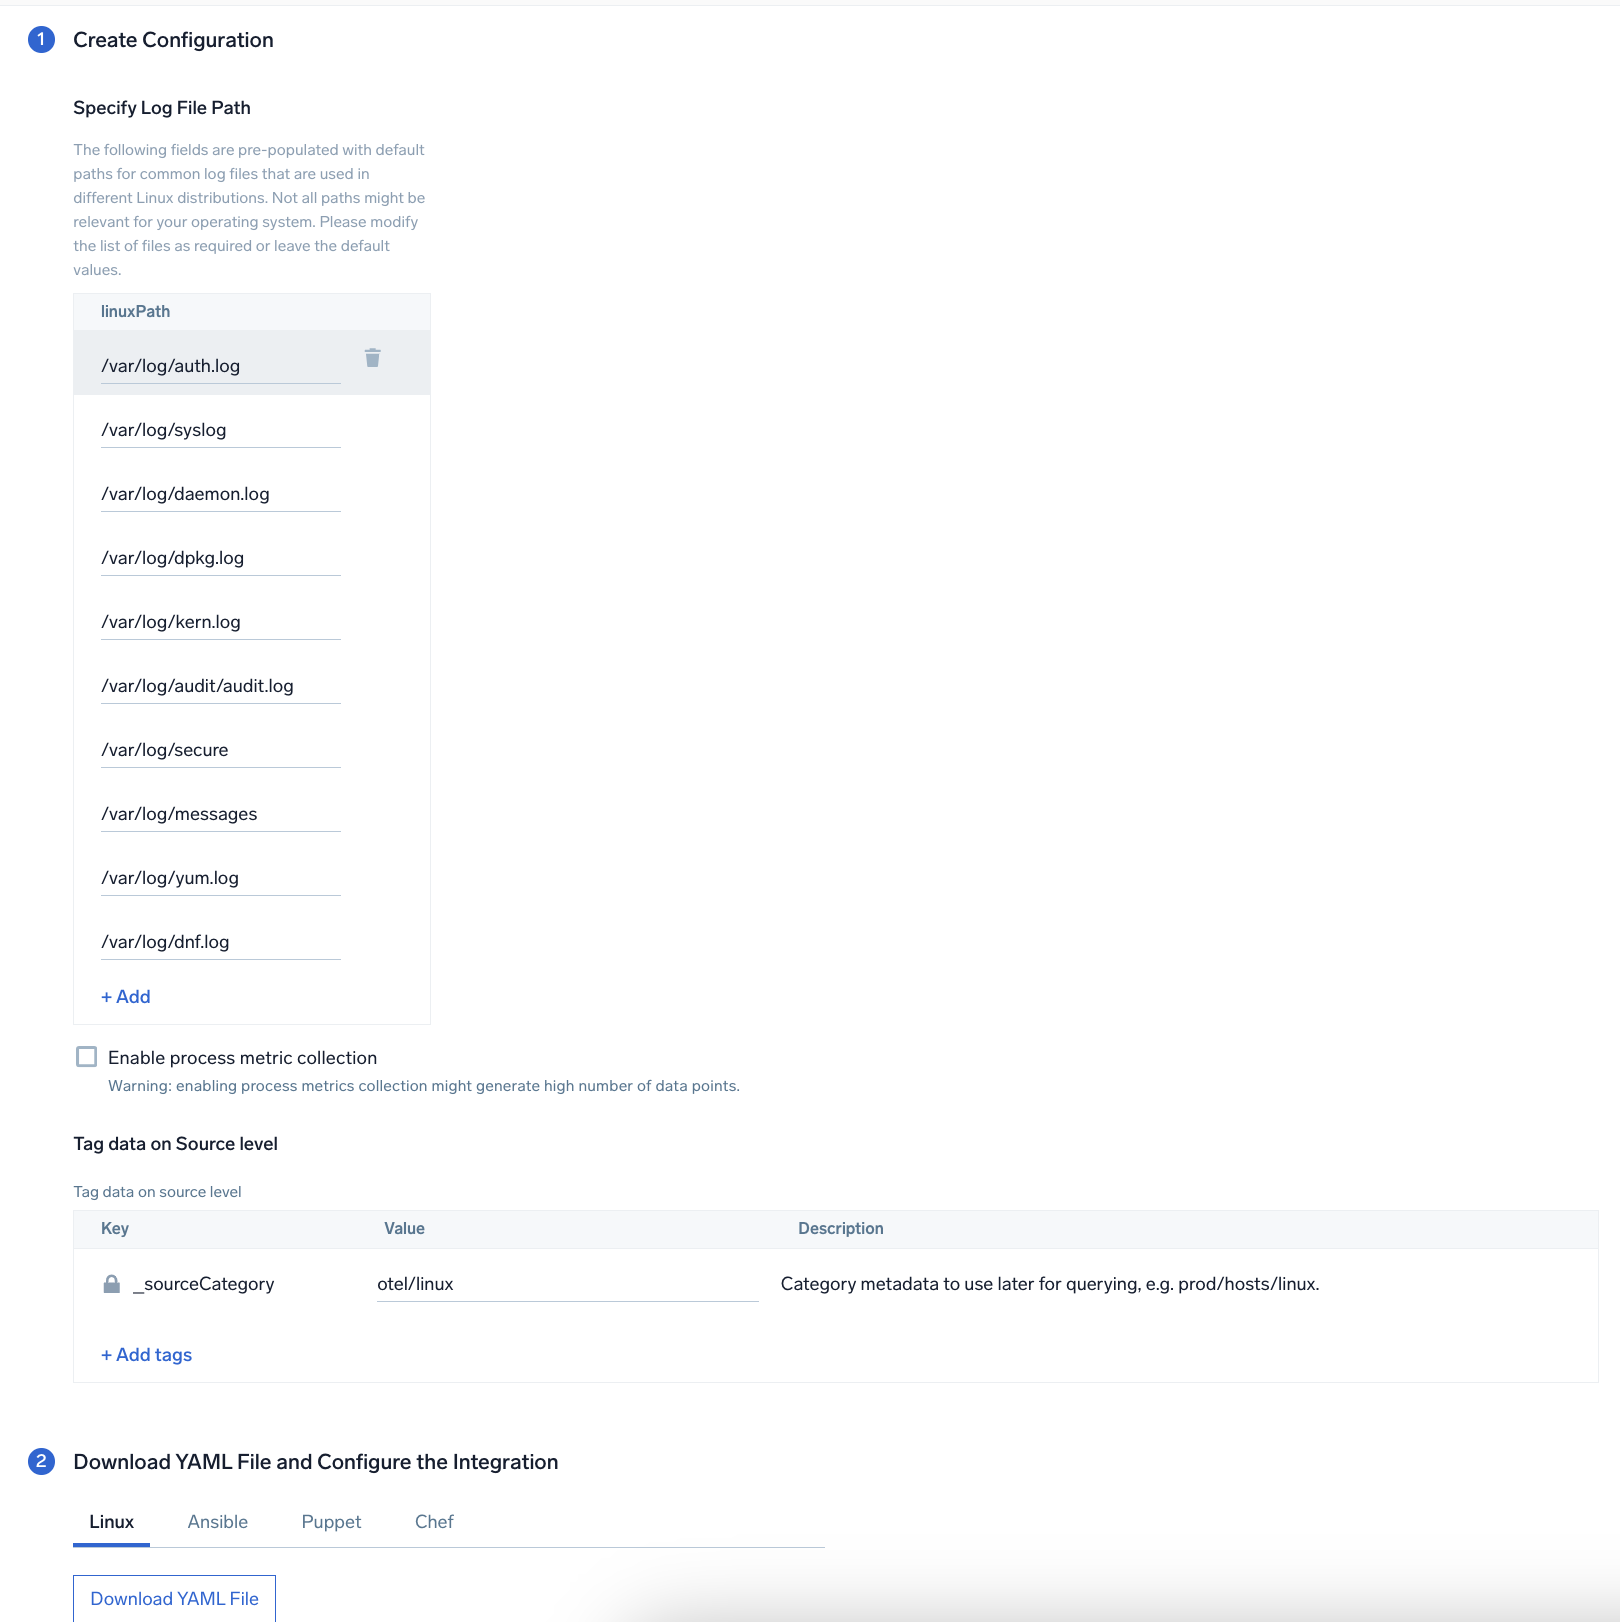
Step 3: Send logs and metrics to Sumo Logic
Once you have downloaded the yaml file as described in the previous step, follow the below steps based on your platform.
- Linux
- Chef
- Ansible
- Puppet
- Copy the yaml file to
/etc/otelcol-sumo/conf.d/folder in the Artifactory instance that needs to be monitored. - Restart the collector using:
sudo systemctl restart otelcol-sumo
- Copy the yaml file into your Chef cookbook files directory
files/<downloaded_yaml_file>. - Use a Chef file resource in a recipe to manage it.
cookbook_file '/etc/otelcol-sumo/conf.d/<downloaded_yaml_file>' do mode 0644 notifies :restart, 'service[otelcol-sumo]', :delayed end - Add the recipe to your collector setup to start collecting the data. Every team typically has their established way of applying the Chef recipe. The resulting Chef recipe should look something like:
cookbook_file '/etc/otelcol-sumo/conf.d/<downloaded_yaml_file>' do
mode 0644
notifies :restart, 'service[otelcol-sumo]', :delayed
end
- Place the file into your Ansible playbook files directory.
- Run the Ansible playbook.
ansible-playbook -i inventory install_sumologic_otel_collector.yaml
-e '{"installation_token": "<YOUR_TOKEN>", "collector_tags": {<YOUR_TAGS>}, "src_config_path": "files/conf.d"}'
- Place the file into your Puppet module files directory
modules/install_otel_collector/files/<downloaded_yaml>. - Use a Puppet file resource to manage it.
file { '/etc/otelcol-sumo/conf.d/<downloaded_yaml_file>':
    ensure => present,
    source => 'puppet:///modules/install_otel_collector/<downloaded_yaml_file>',
    mode => '0644',
    notify => Service[otelcol-sumo],
} - Apply the Puppet manifest. Every team typically has their established way of applying the Puppet manifest. The resulting Puppet manifest should look something like:
node 'default' {
    class { 'install_otel_collector'
      installation_token => '<YOUR_TOKEN>',
      collector_tags => { <YOUR_TAGS> },
    }

    service { 'otelcol-sumo':
      provider => 'systemd',
      ensure => running,
      enable => true,
      require => Class['install_otel_collector'],
    }

    file { '/etc/otelcol-sumo/conf.d/<downloaded_yaml_file>':
      ensure => present,
      source => 'puppet:///modules/install_otel_collector/<downloaded_yaml_file>',
      mode => '0644',
      notify => Service[otelcol-sumo],
    }
  }
After successfully executing the above command, Sumo Logic will start receiving data from your host machine.
Click Next. This will install the app (dashboards and monitors) to your Sumo Logic Org.
Dashboard panels will start to fill automatically. It's important to note that each panel fills with data matching the time range query and received since the panel was created. Results won't immediately be available, but within 20 minutes, you'll see full graphs and maps.
Sample log messages
Dec 13 04:44:00 <1> [zypper++] Summary.cc(readPool):133 I_TsU(27372)Mesa-libGL1-8.0.4-20.4.1.i586(@System)
Sample Metrics
{
	"queryId":"A",
	"_source":"linux-otel-metric",
	"process.executable.name":"apache2",
	"_sourceName":"Http Input",
	"process.command":"/usr/sbin/apache2",
	"host":"ip-172-31-90-39.ec2.internal",
	"os.type":"linux",
	"sumo.datasource":"linux",
	"process.executable.path":"/usr/sbin/apache2",
	"process.command_line":"/usr/sbin/apache2_-k_start",
	"process.owner":"www-data",
	"_sourceCategory":"Labs/linux-otel/metric",
	"_contentType":"Carbon2",
	"metric":"process.memory.physical_usage",
	"_collectorId":"000000000C984E1A",
	"_sourceId":"0000000042E512AE",
	"unit":"By",
	"_collector":"Labs - linux-otel",
	"process.pid":"26967",
	"max":42295296,
	"min":536576,
	"avg":9061120,
	"sum":144977920,
	"latest":8069120,
	"count":16
}
Sample queries
Log query
Logs query from the Total Event Distribution panel.
%"sumo.datasource"=linux
| parse regex "\d+\s+\d+:\d+:\d+\s(?<dest_hostname>\S+)\s(?<process_name>\w*)(?:\[\d+\]|):\s+"
|where dest_hostname matches "{{dest_hostname}}" AND process_name matches "{{process_name}}"
|count as Events by dest_hostname
Metrics query
Metrics query from the CPU Utilization Over Time panel.
sumo.datasource=linux host.name=* metric=system.cpu.utilization state=(user OR system OR wait OR steal OR softirq OR interrupt OR nice) | sum by host.name | outlier
Linux app dashboards
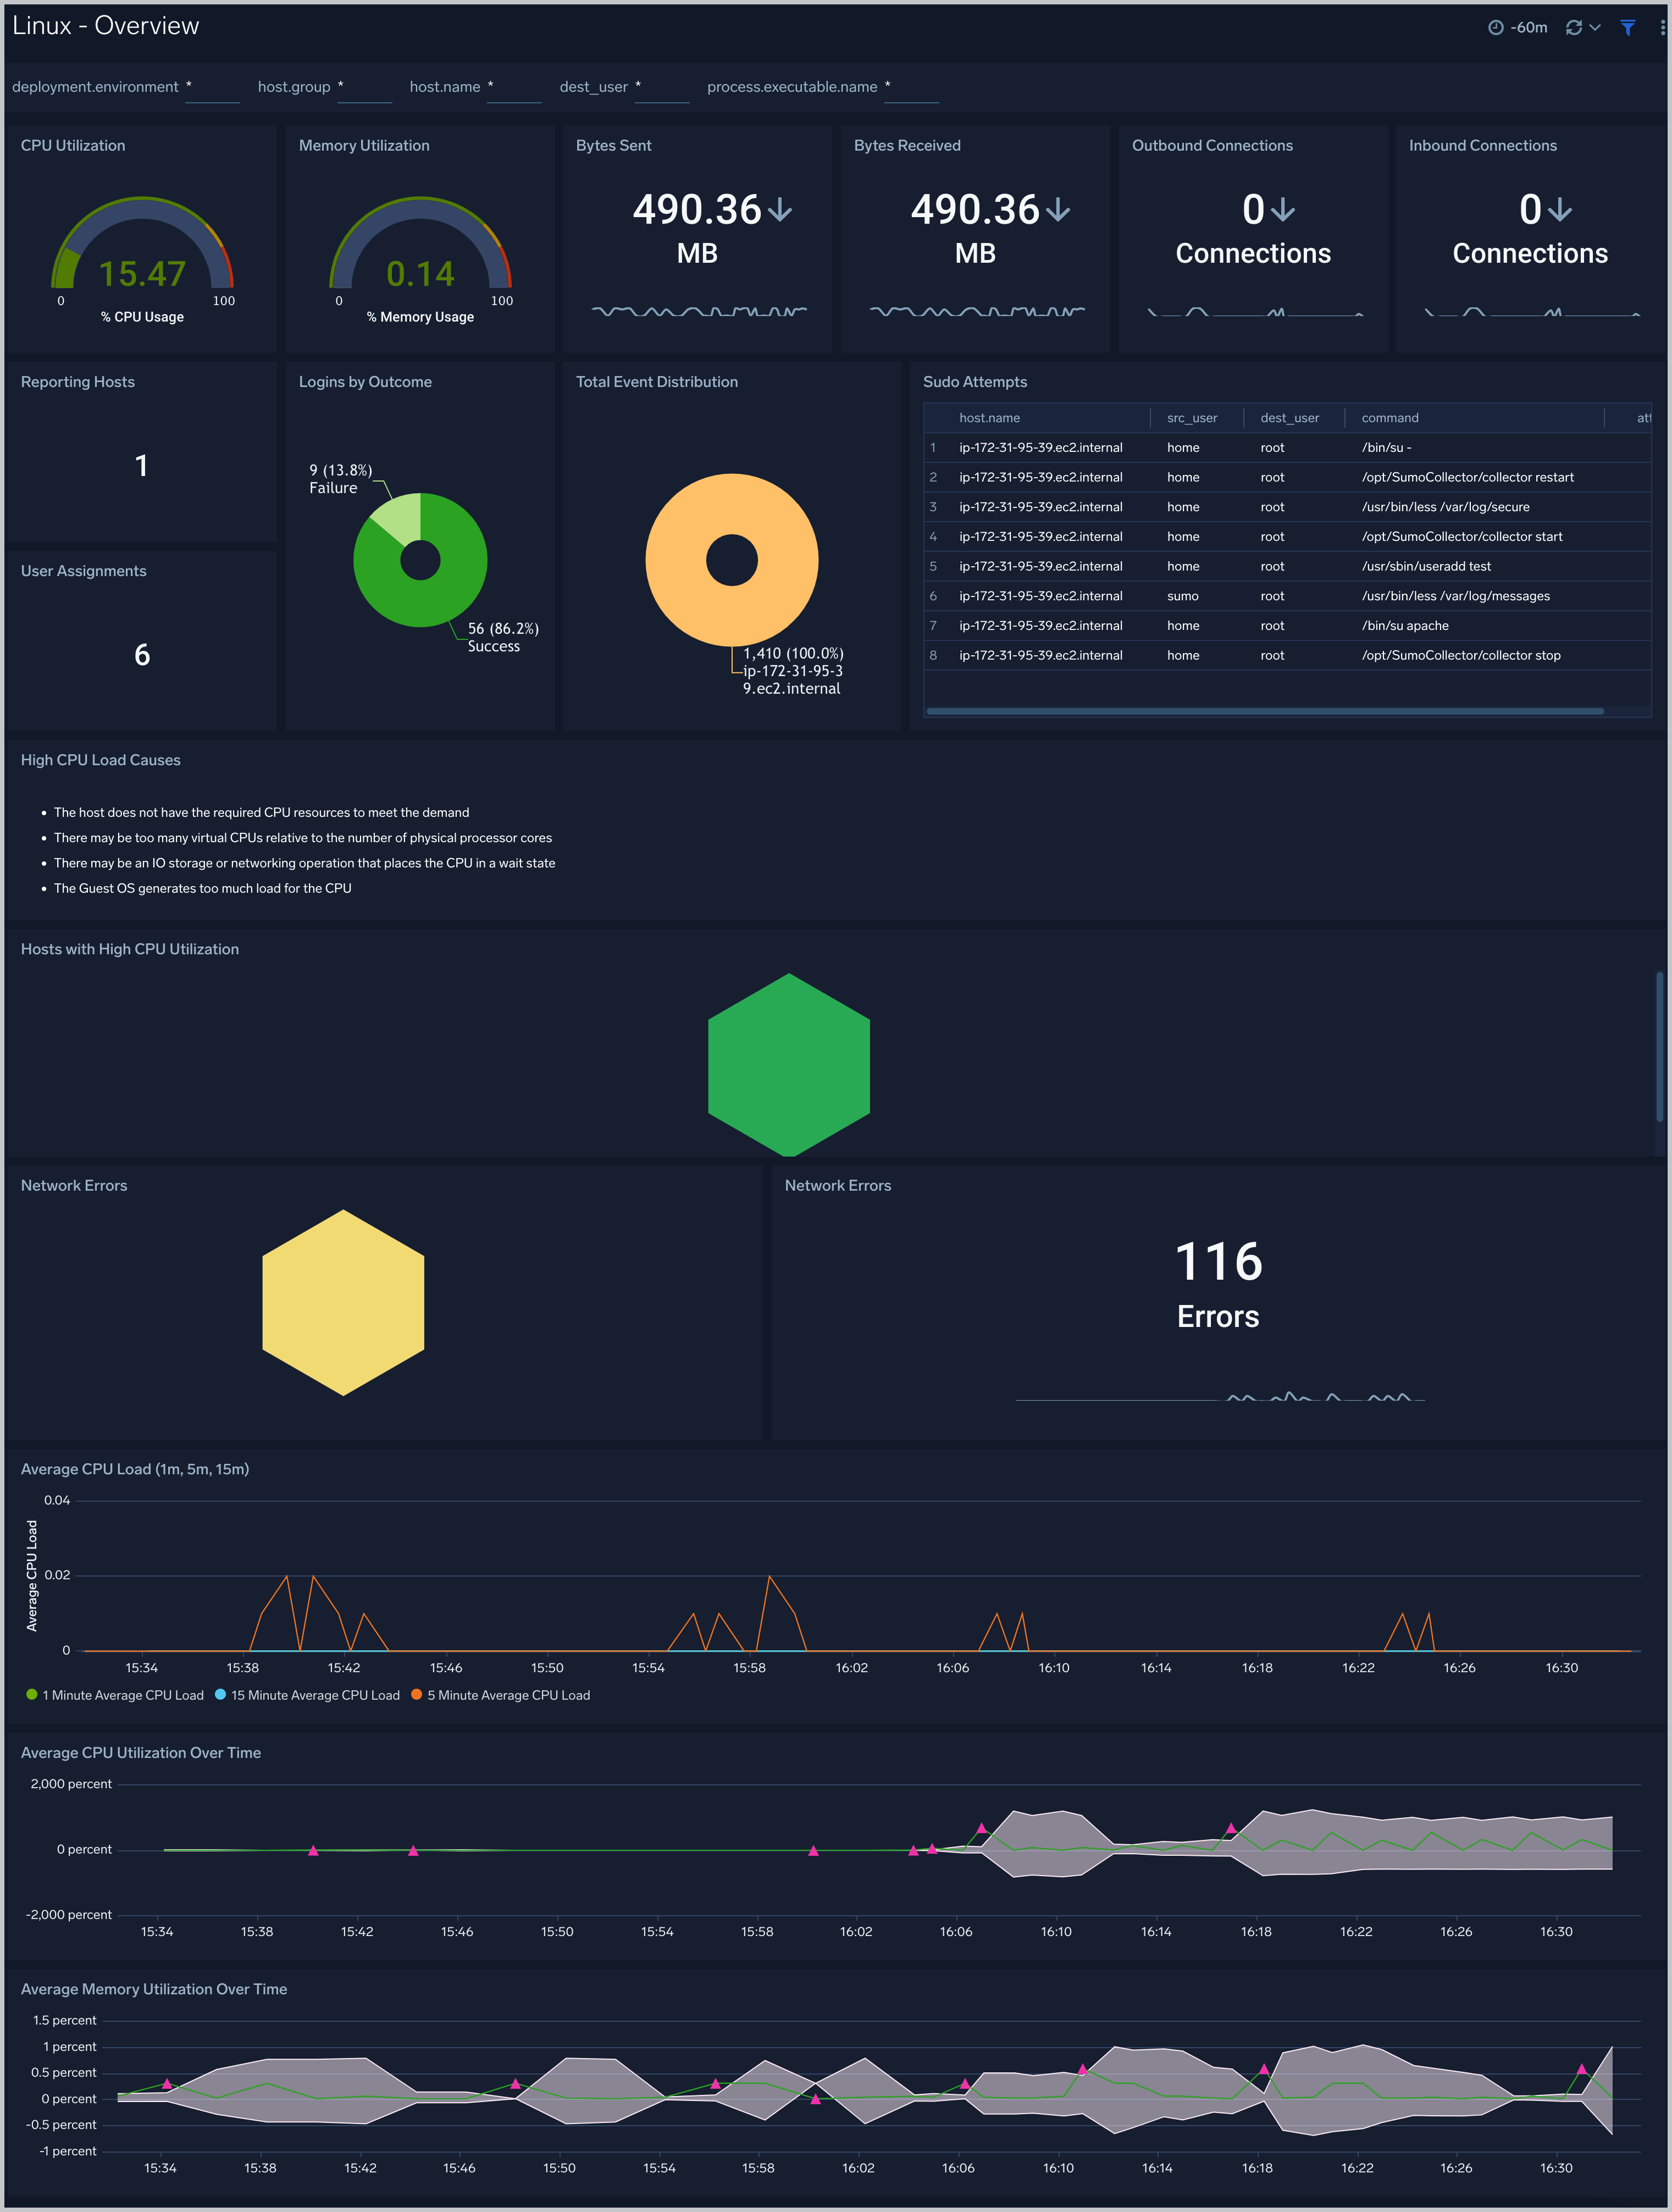
Linux - Overview
The Linux - Overview dashboard provides an overview of Linux activity, including the distribution of system events across hosts, group assignment changes, successful and failed logins, sudo attempts, and the count of reporting hosts. This dashboard also gives you an at-a-glance view of the key metrics like CPU, memory, disk, network, and TCP connections of all your hosts. You can drill down from this dashboard to the Host Metrics - CPU/Disk/Memory/Network/TCP dashboard by using the honeycombs or line charts in all the panels.
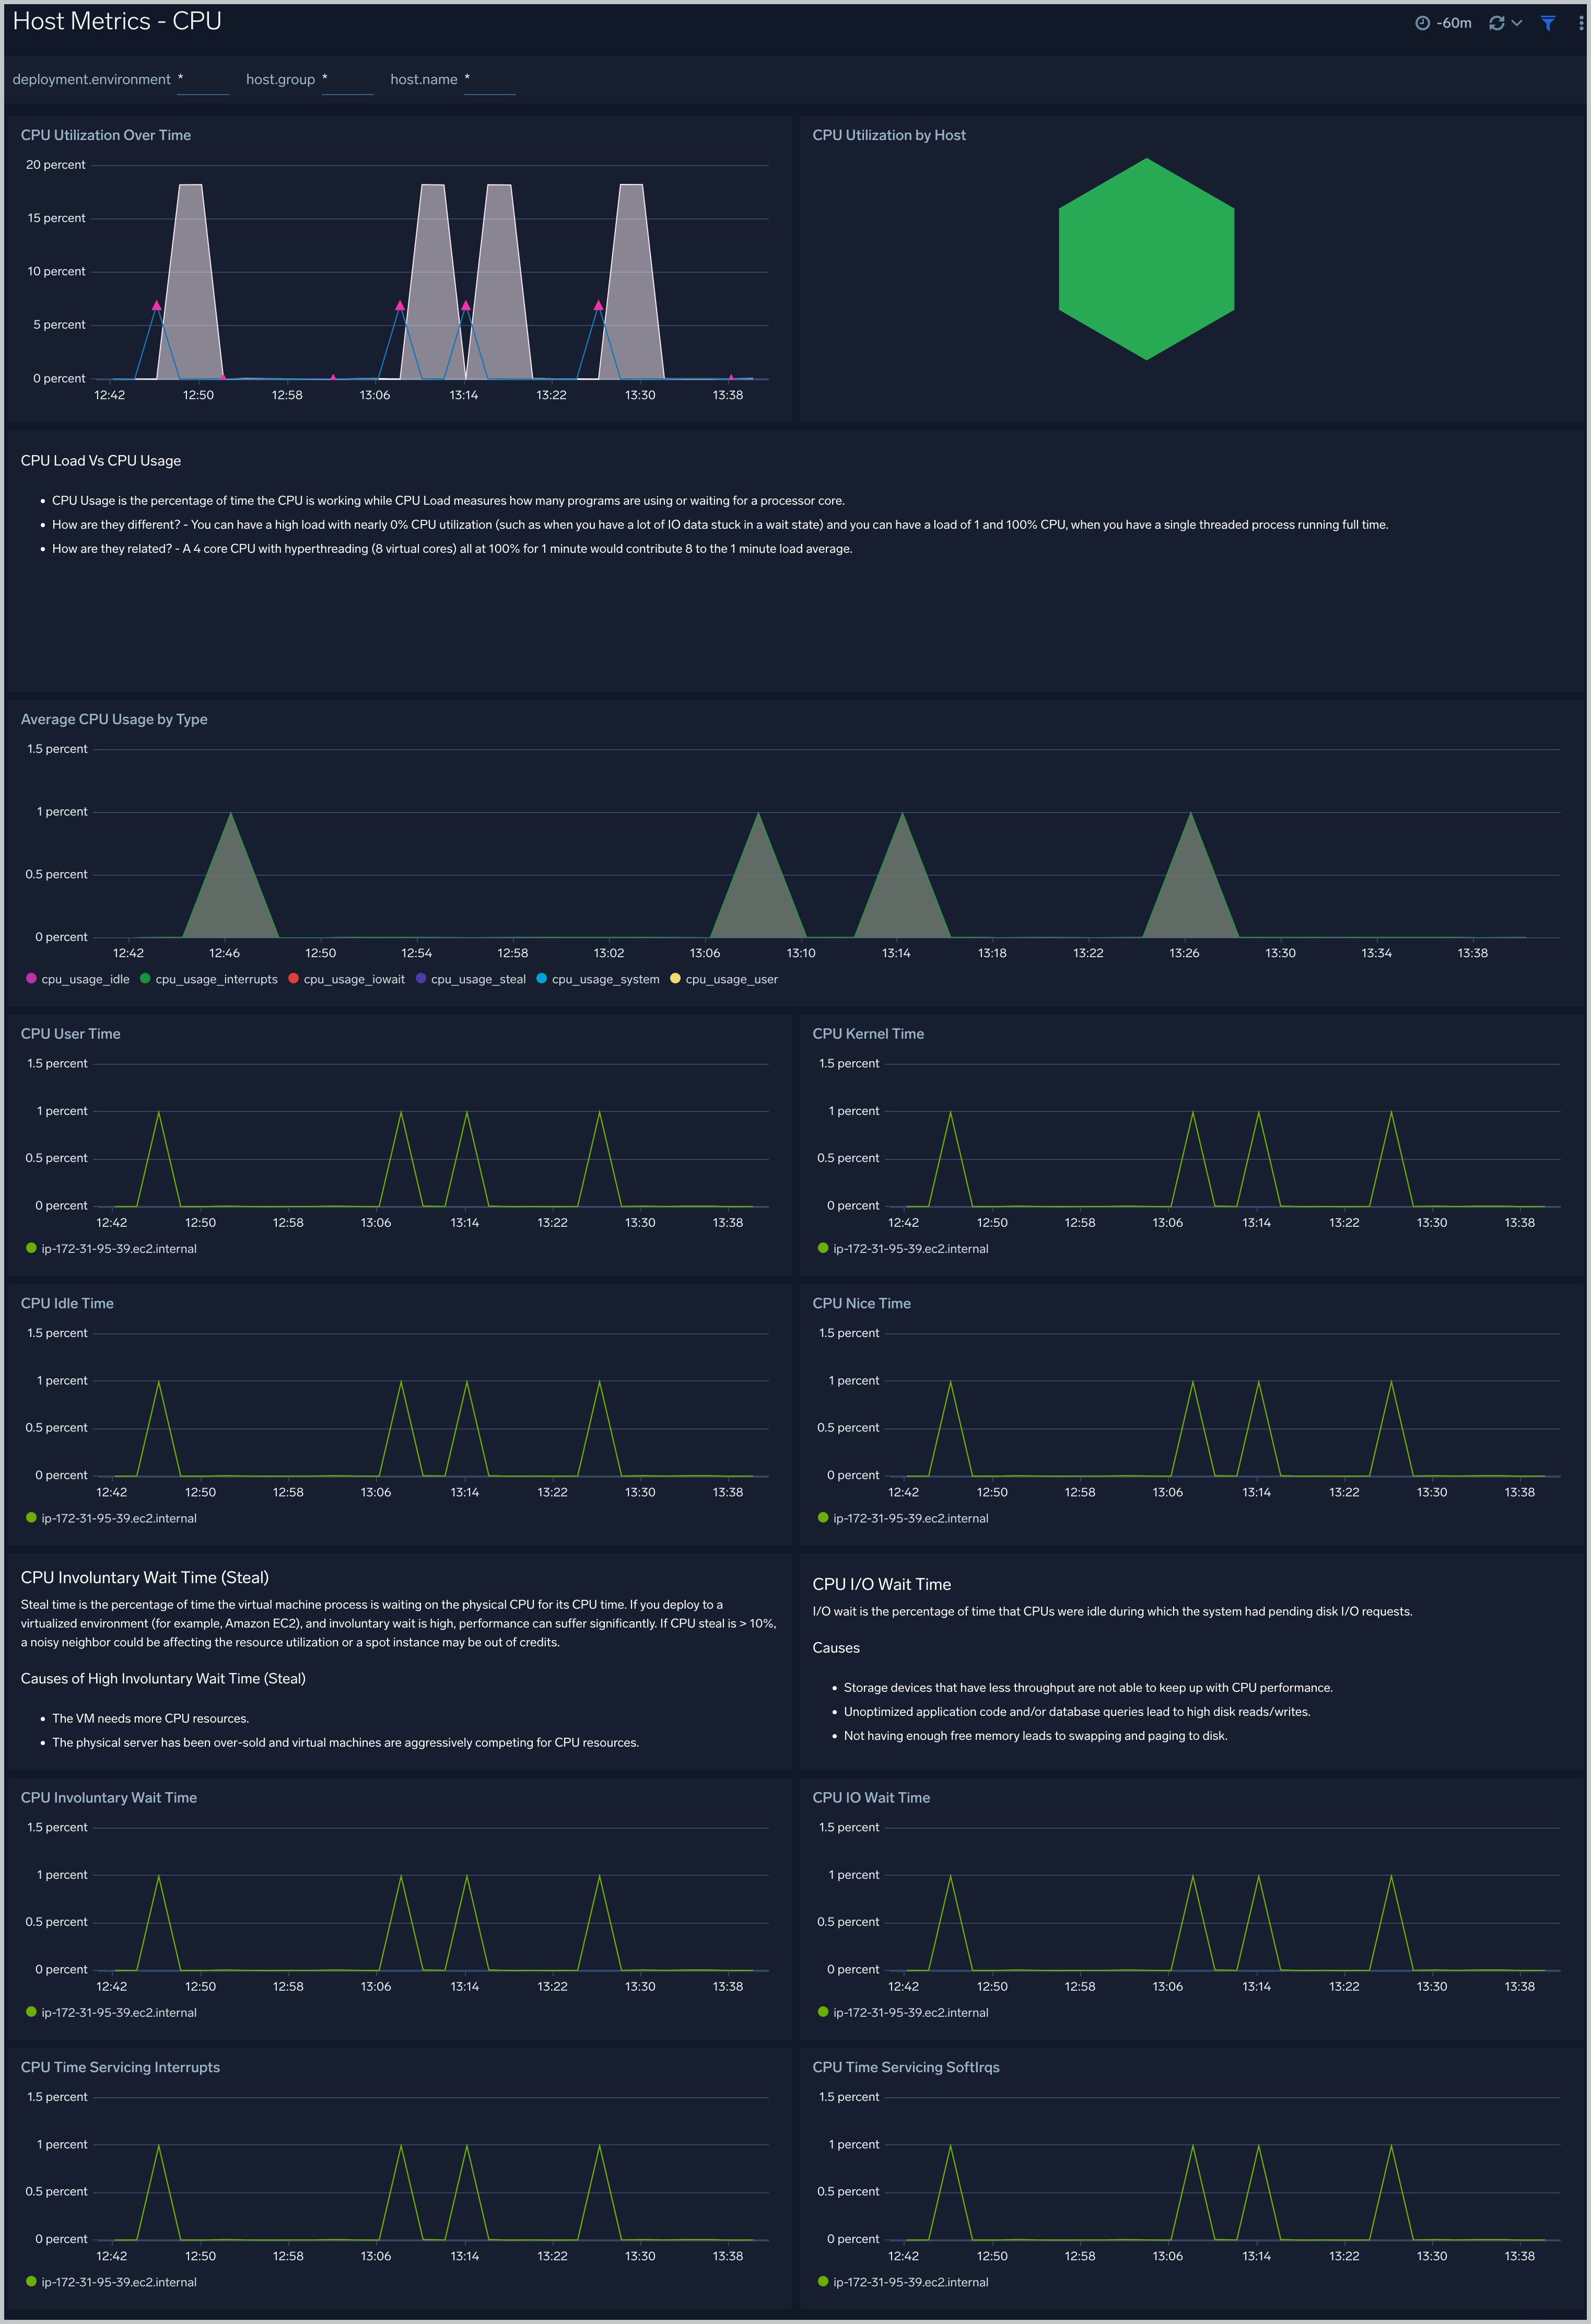
Host Metrics - CPU
The Host Metrics - CPU dashboard provides a detailed analysis based on CPU metrics. You can drill down from this dashboard to the Process Metrics - Details dashboard by using the honeycombs or line charts in all the panels.
Use this dashboard to:
- Identify hosts and processes with high CPU utilization.
- Examine CPU usage by type and identify anomalies over time.
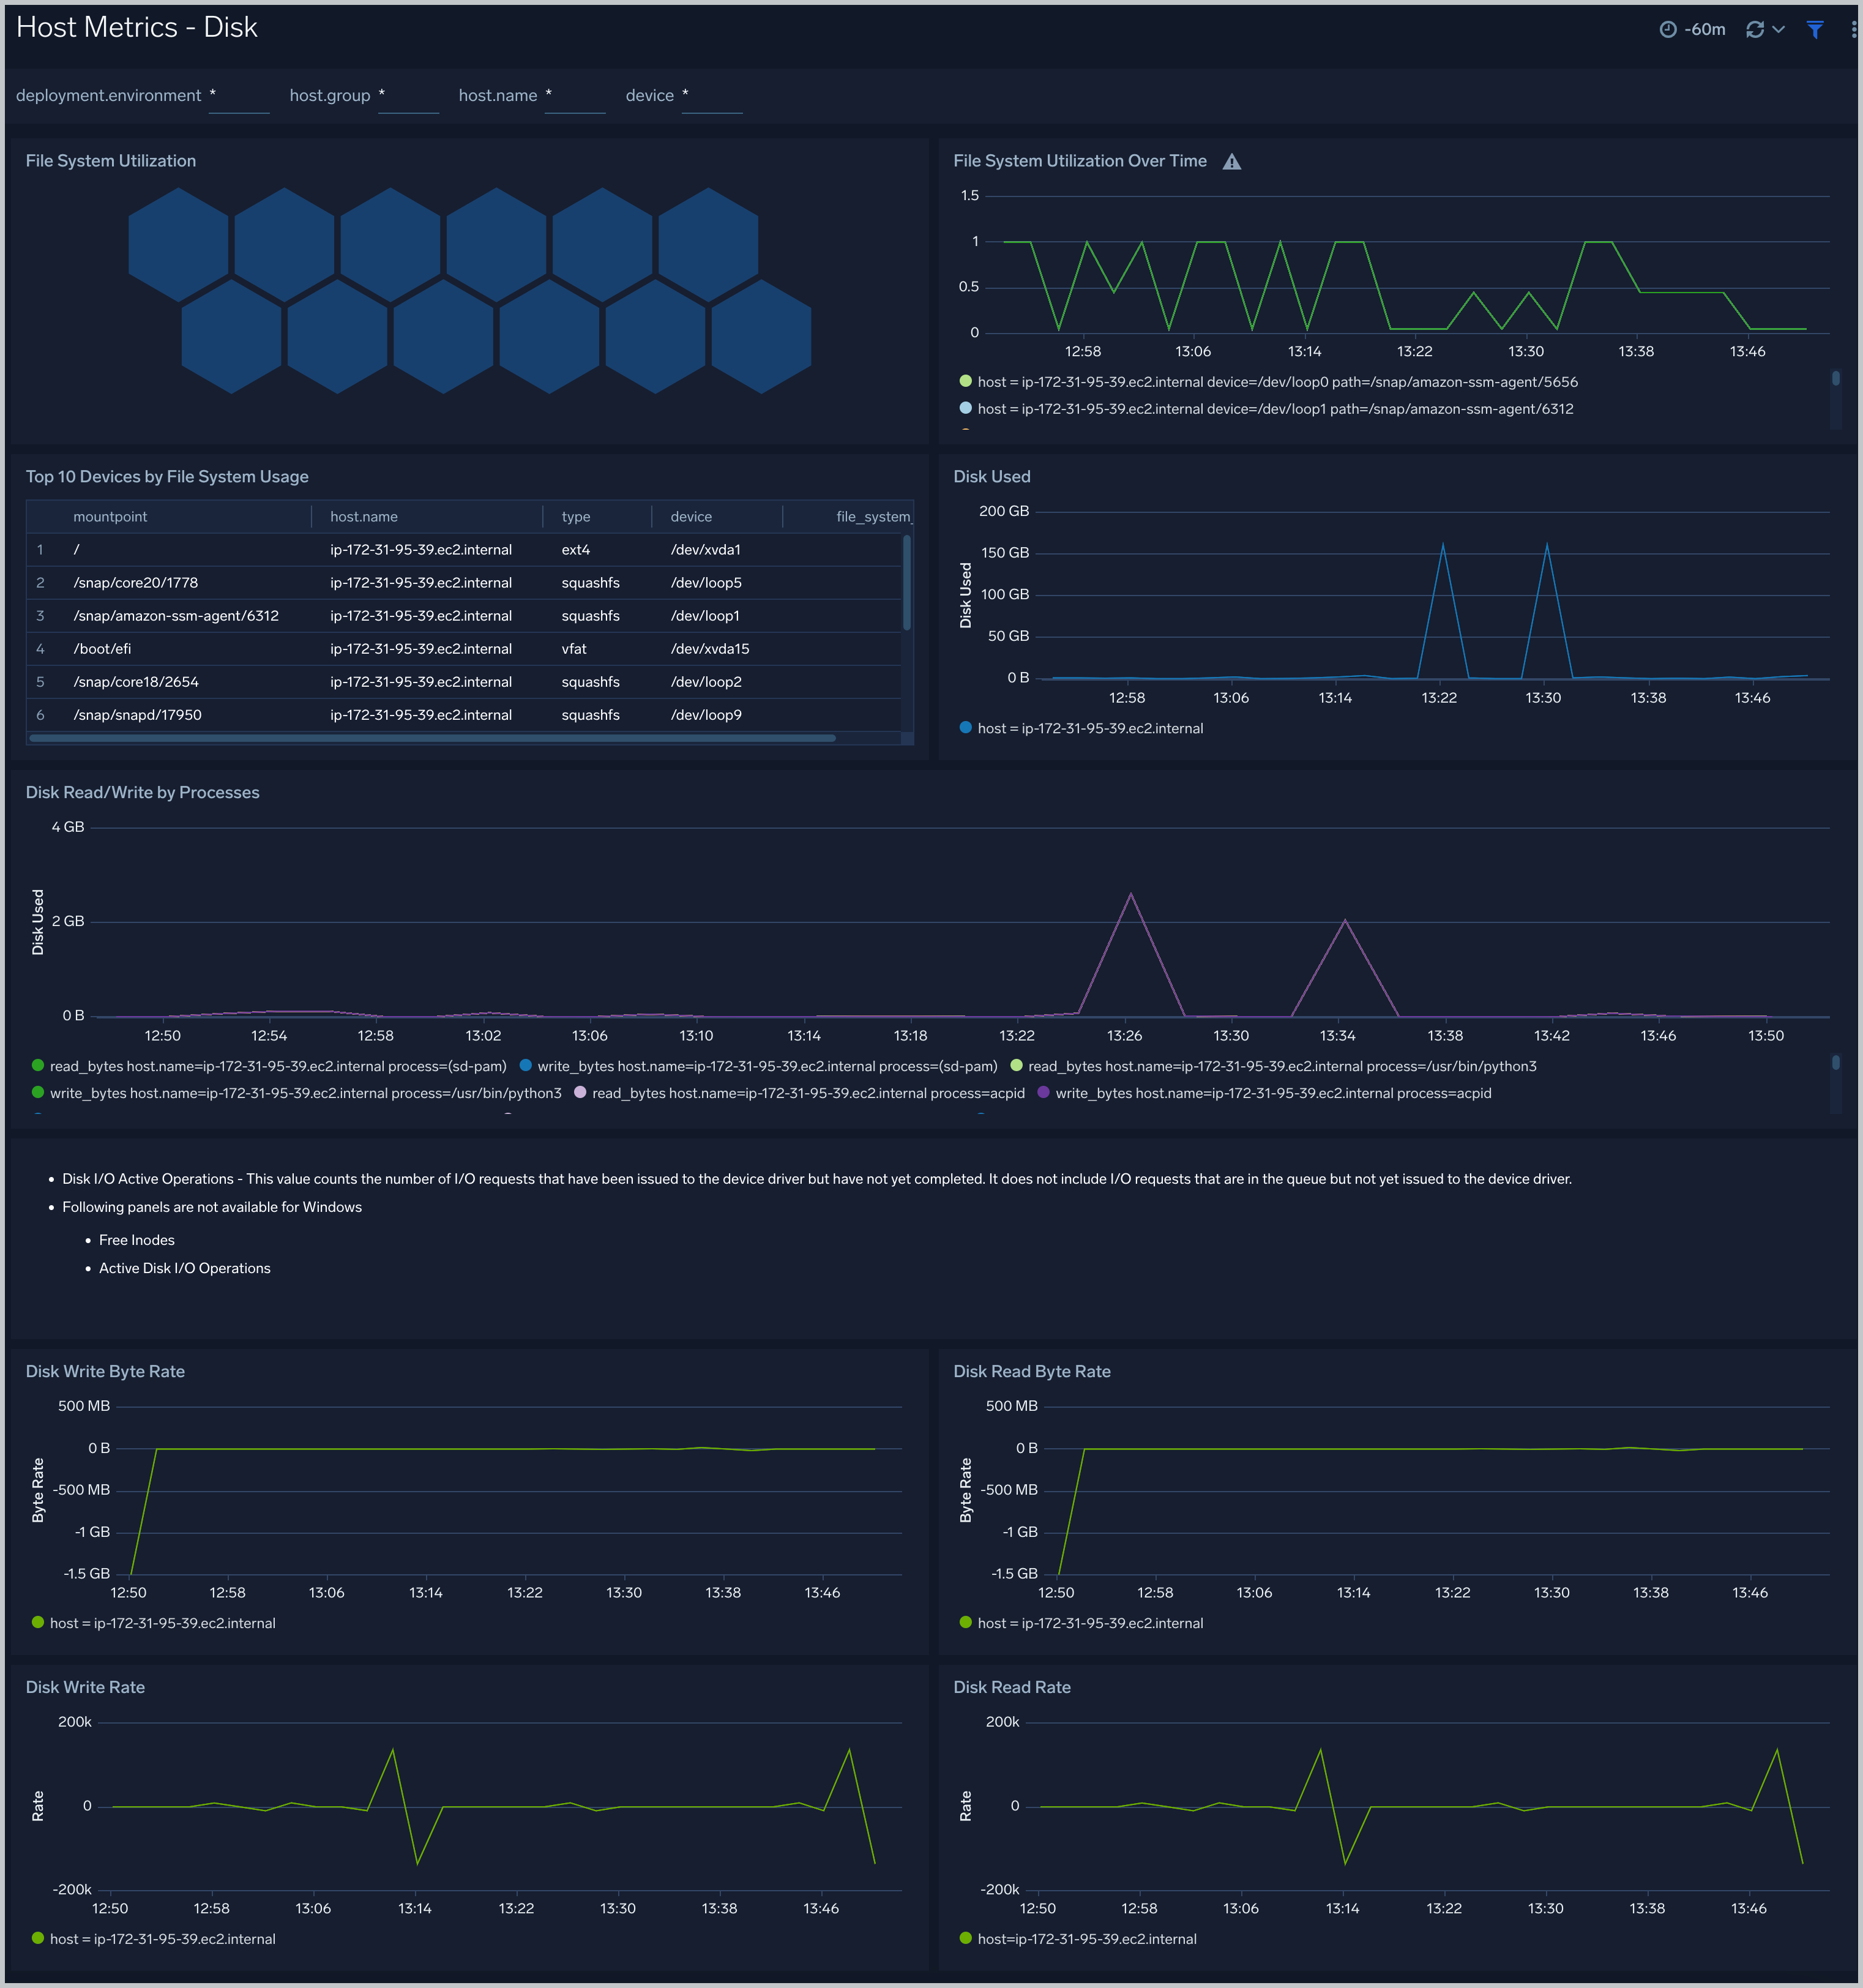
Host Metrics - Disk
The Host Metrics - Disk dashboard provides detailed information about on disk utilization and disk IO operations.You can drill down from this dashboard to the Process Metrics - Details dashboard by using the honeycombs or line charts in all the panels.
Use this dashboard to:
- Identify hosts with high disk utilization and disk IO operations.
- Monitor abnormal spikes in read/write rates.
- Compare disk throughput across storage devices of a host.
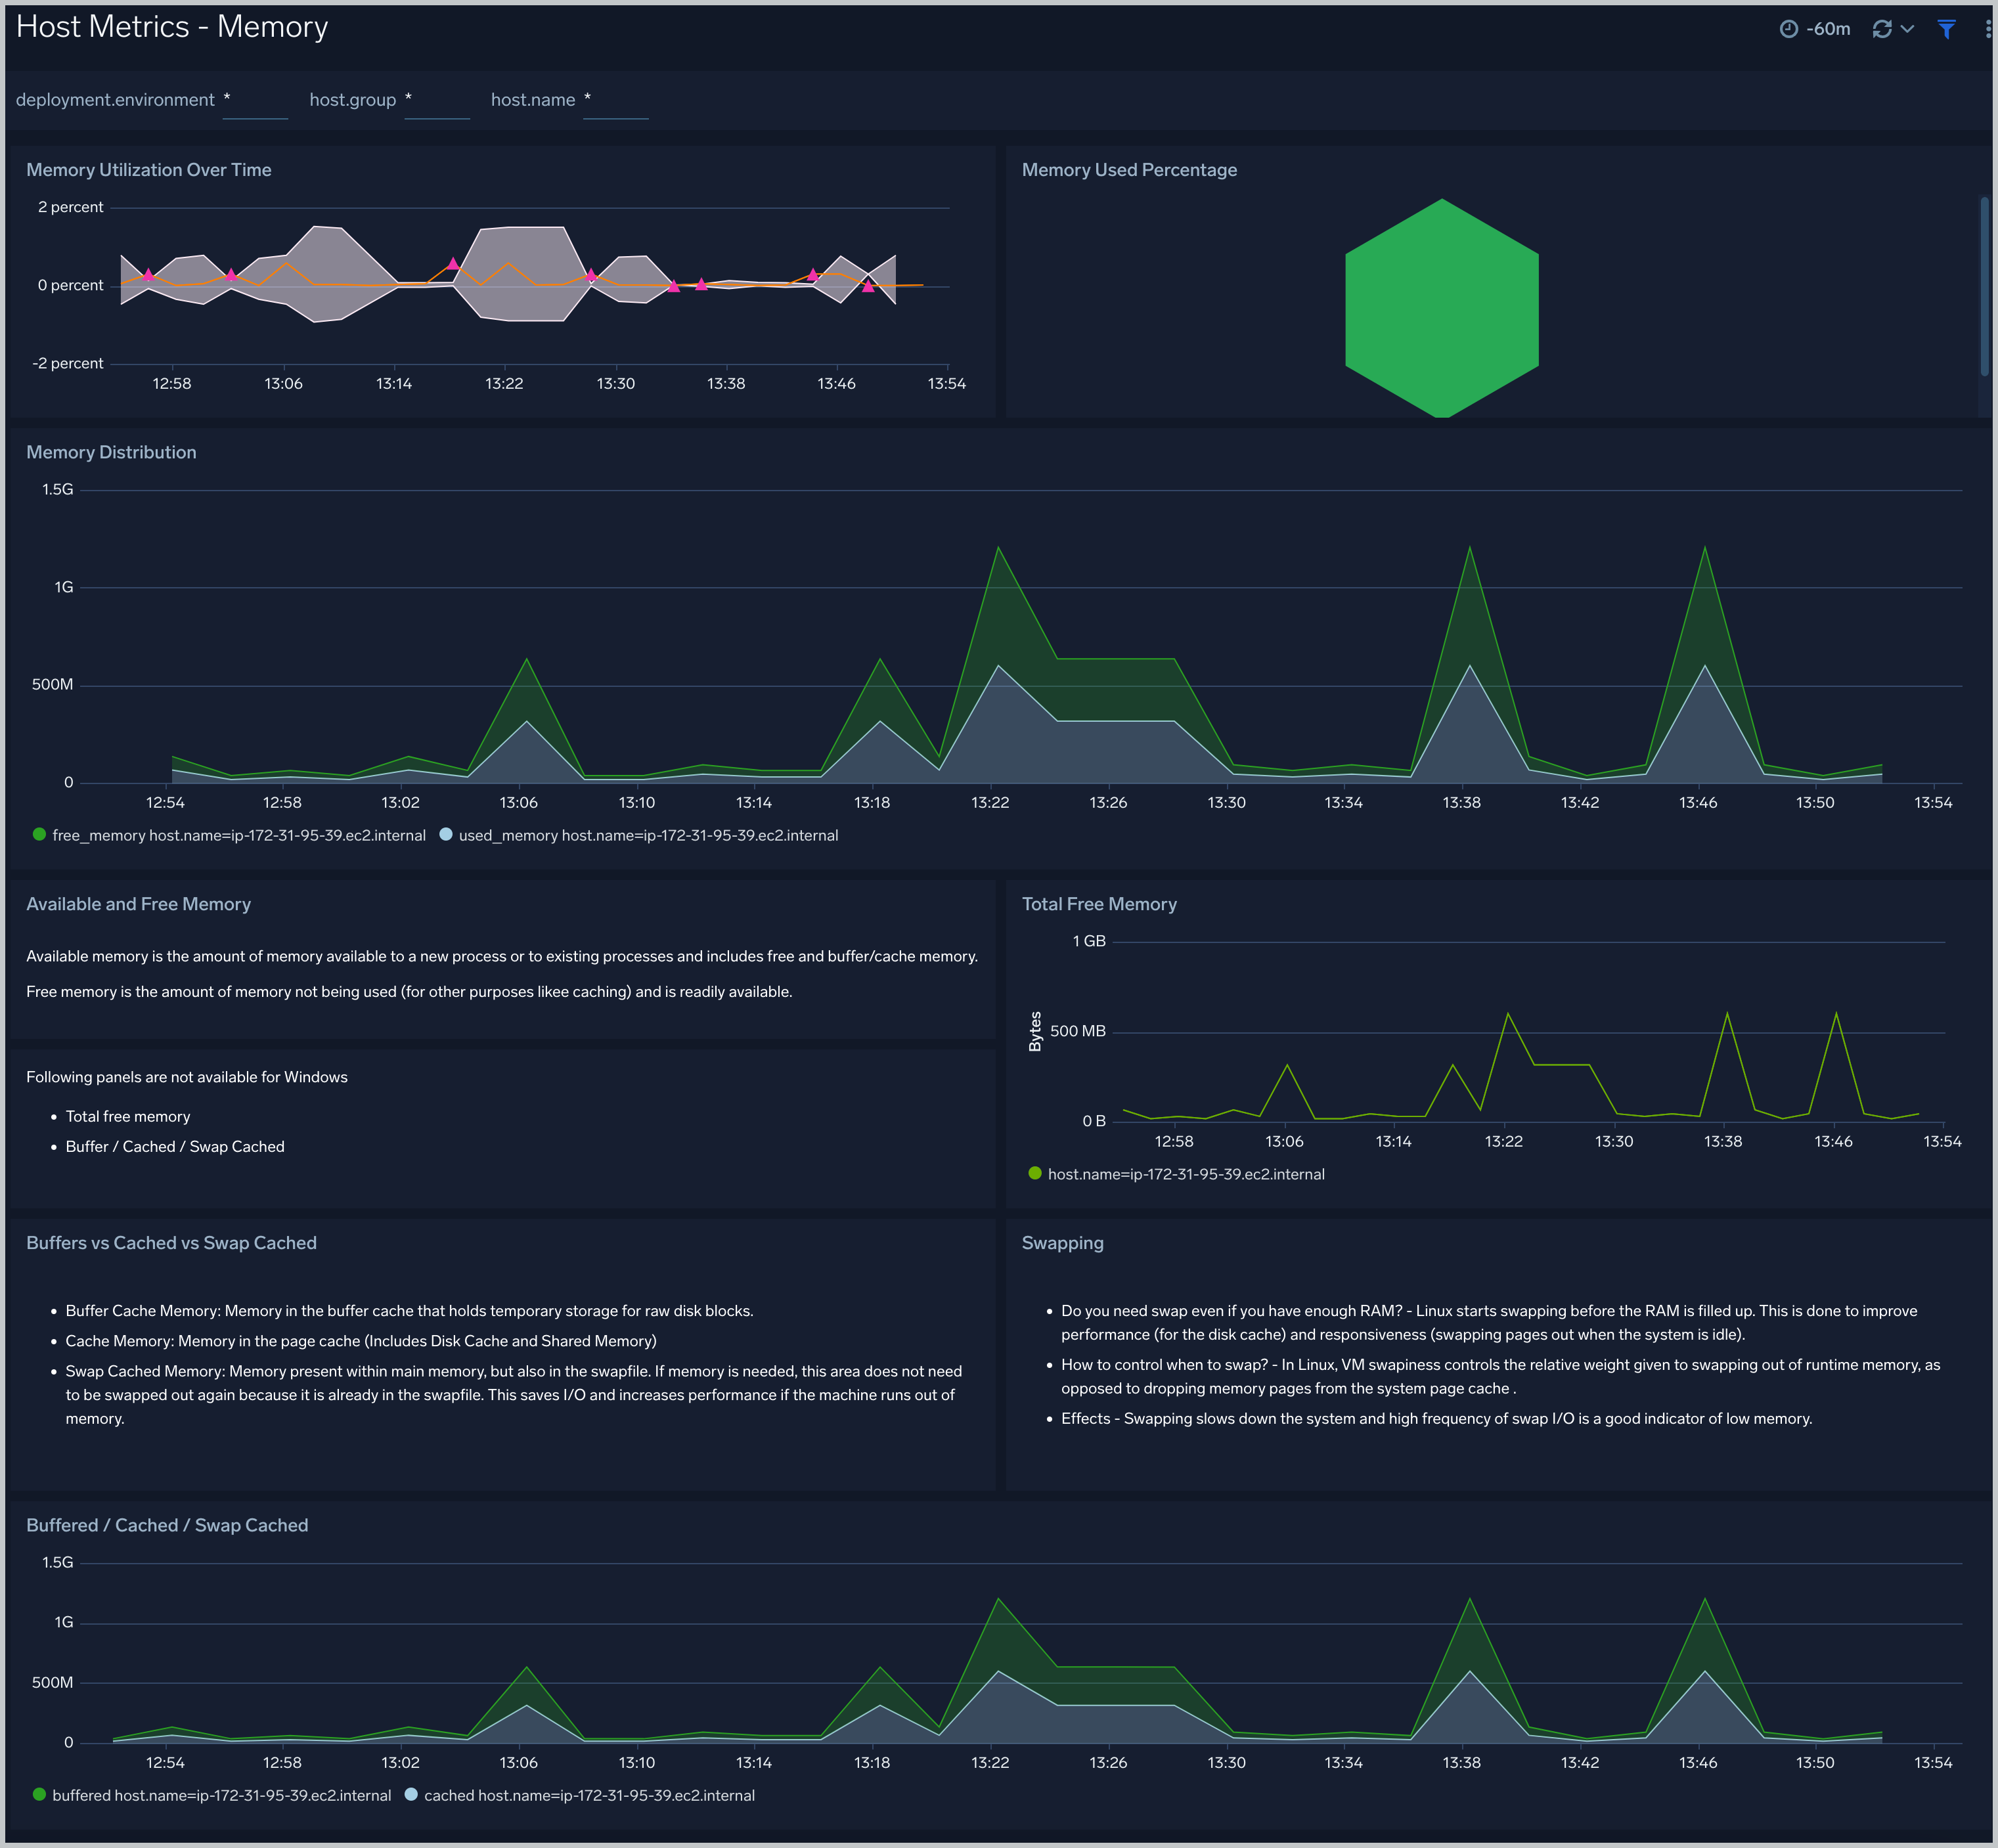
Host Metrics - Memory
The Host Metrics - Memory dashboard provides detailed information on host memory usage, memory distribution, and swap space utilization. You can drill down from this dashboard to the Process Metrics - Details dashboard by using the honeycombs or line charts in all the panels.
Use this dashboard to:
- Identify hosts with high memory utilization.
- Examine memory distribution (free, buffered-cache, used, total) for a given host.
- Monitor abnormal spikes in memory and swap utilization.
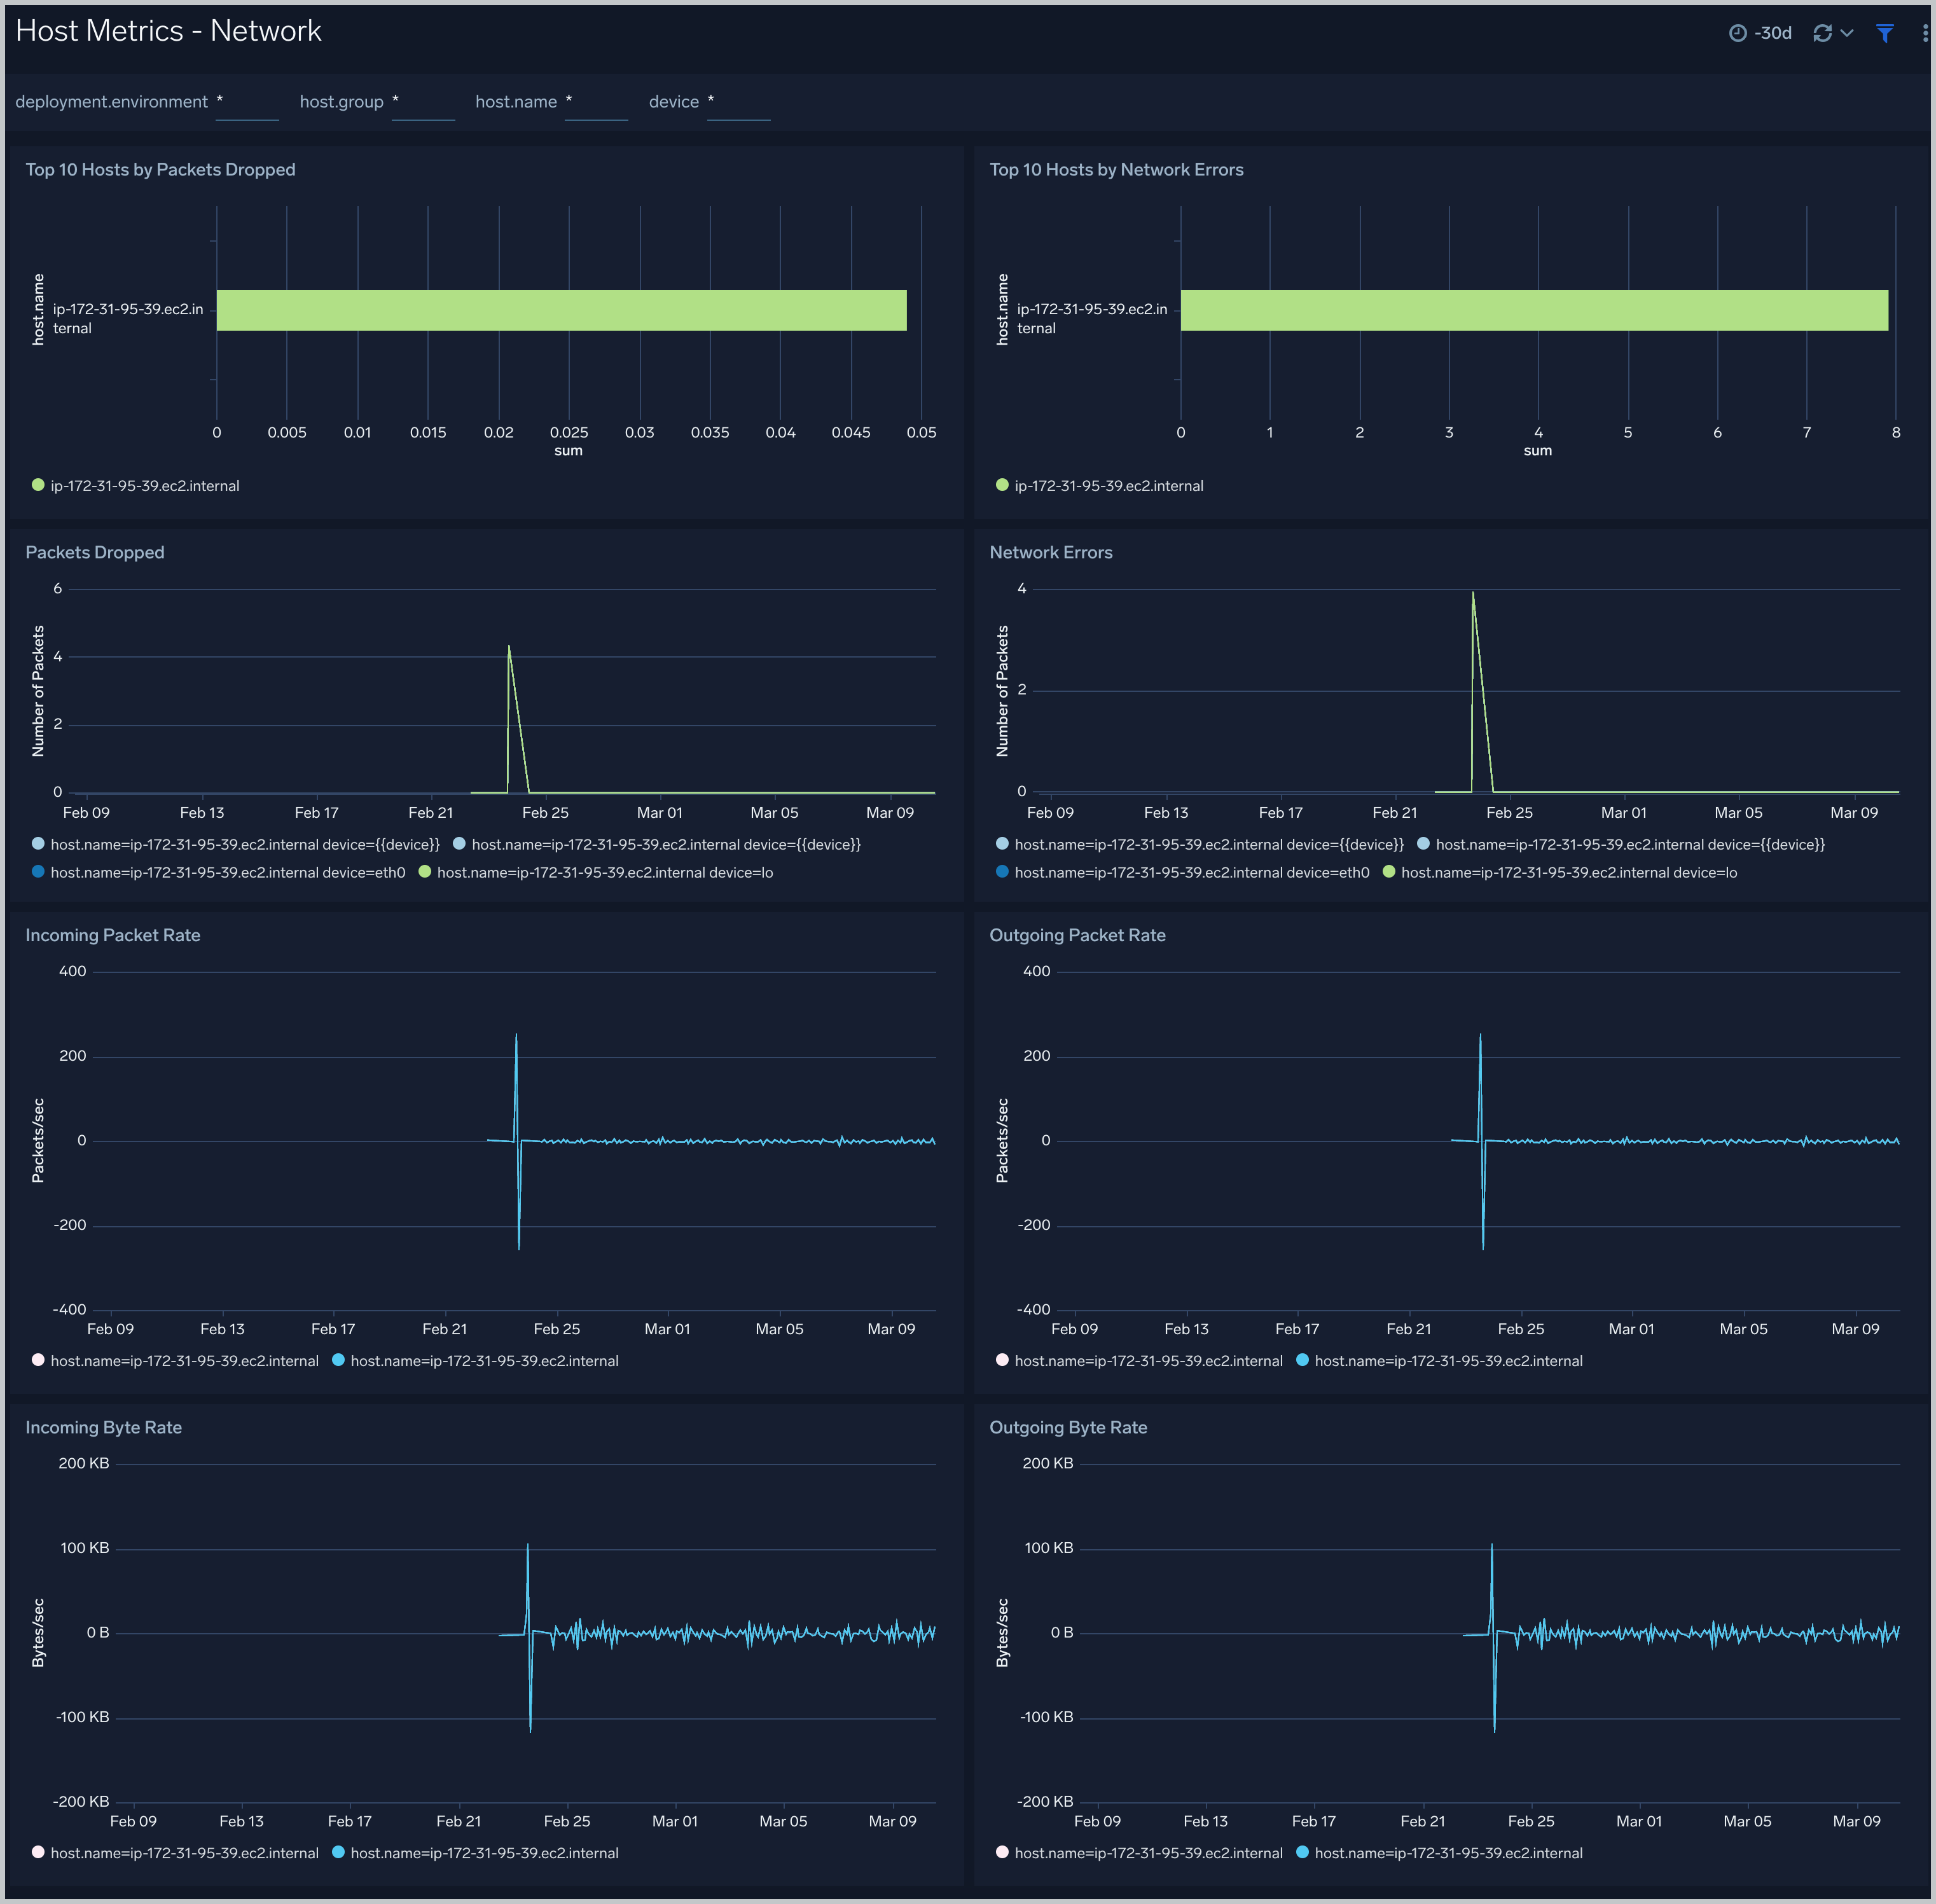
Host Metrics - Network
The Host Metrics - Network dashboard provides detailed information on host network errors, throughput, and packets sent and received.
Use this dashboard to:
- Determine top hosts with network errors and dropped packets.
- Monitor abnormal spikes in incoming/outgoing packets and bytes sent and received.
- Use dashboard filters to compare throughput across the interface of a host.
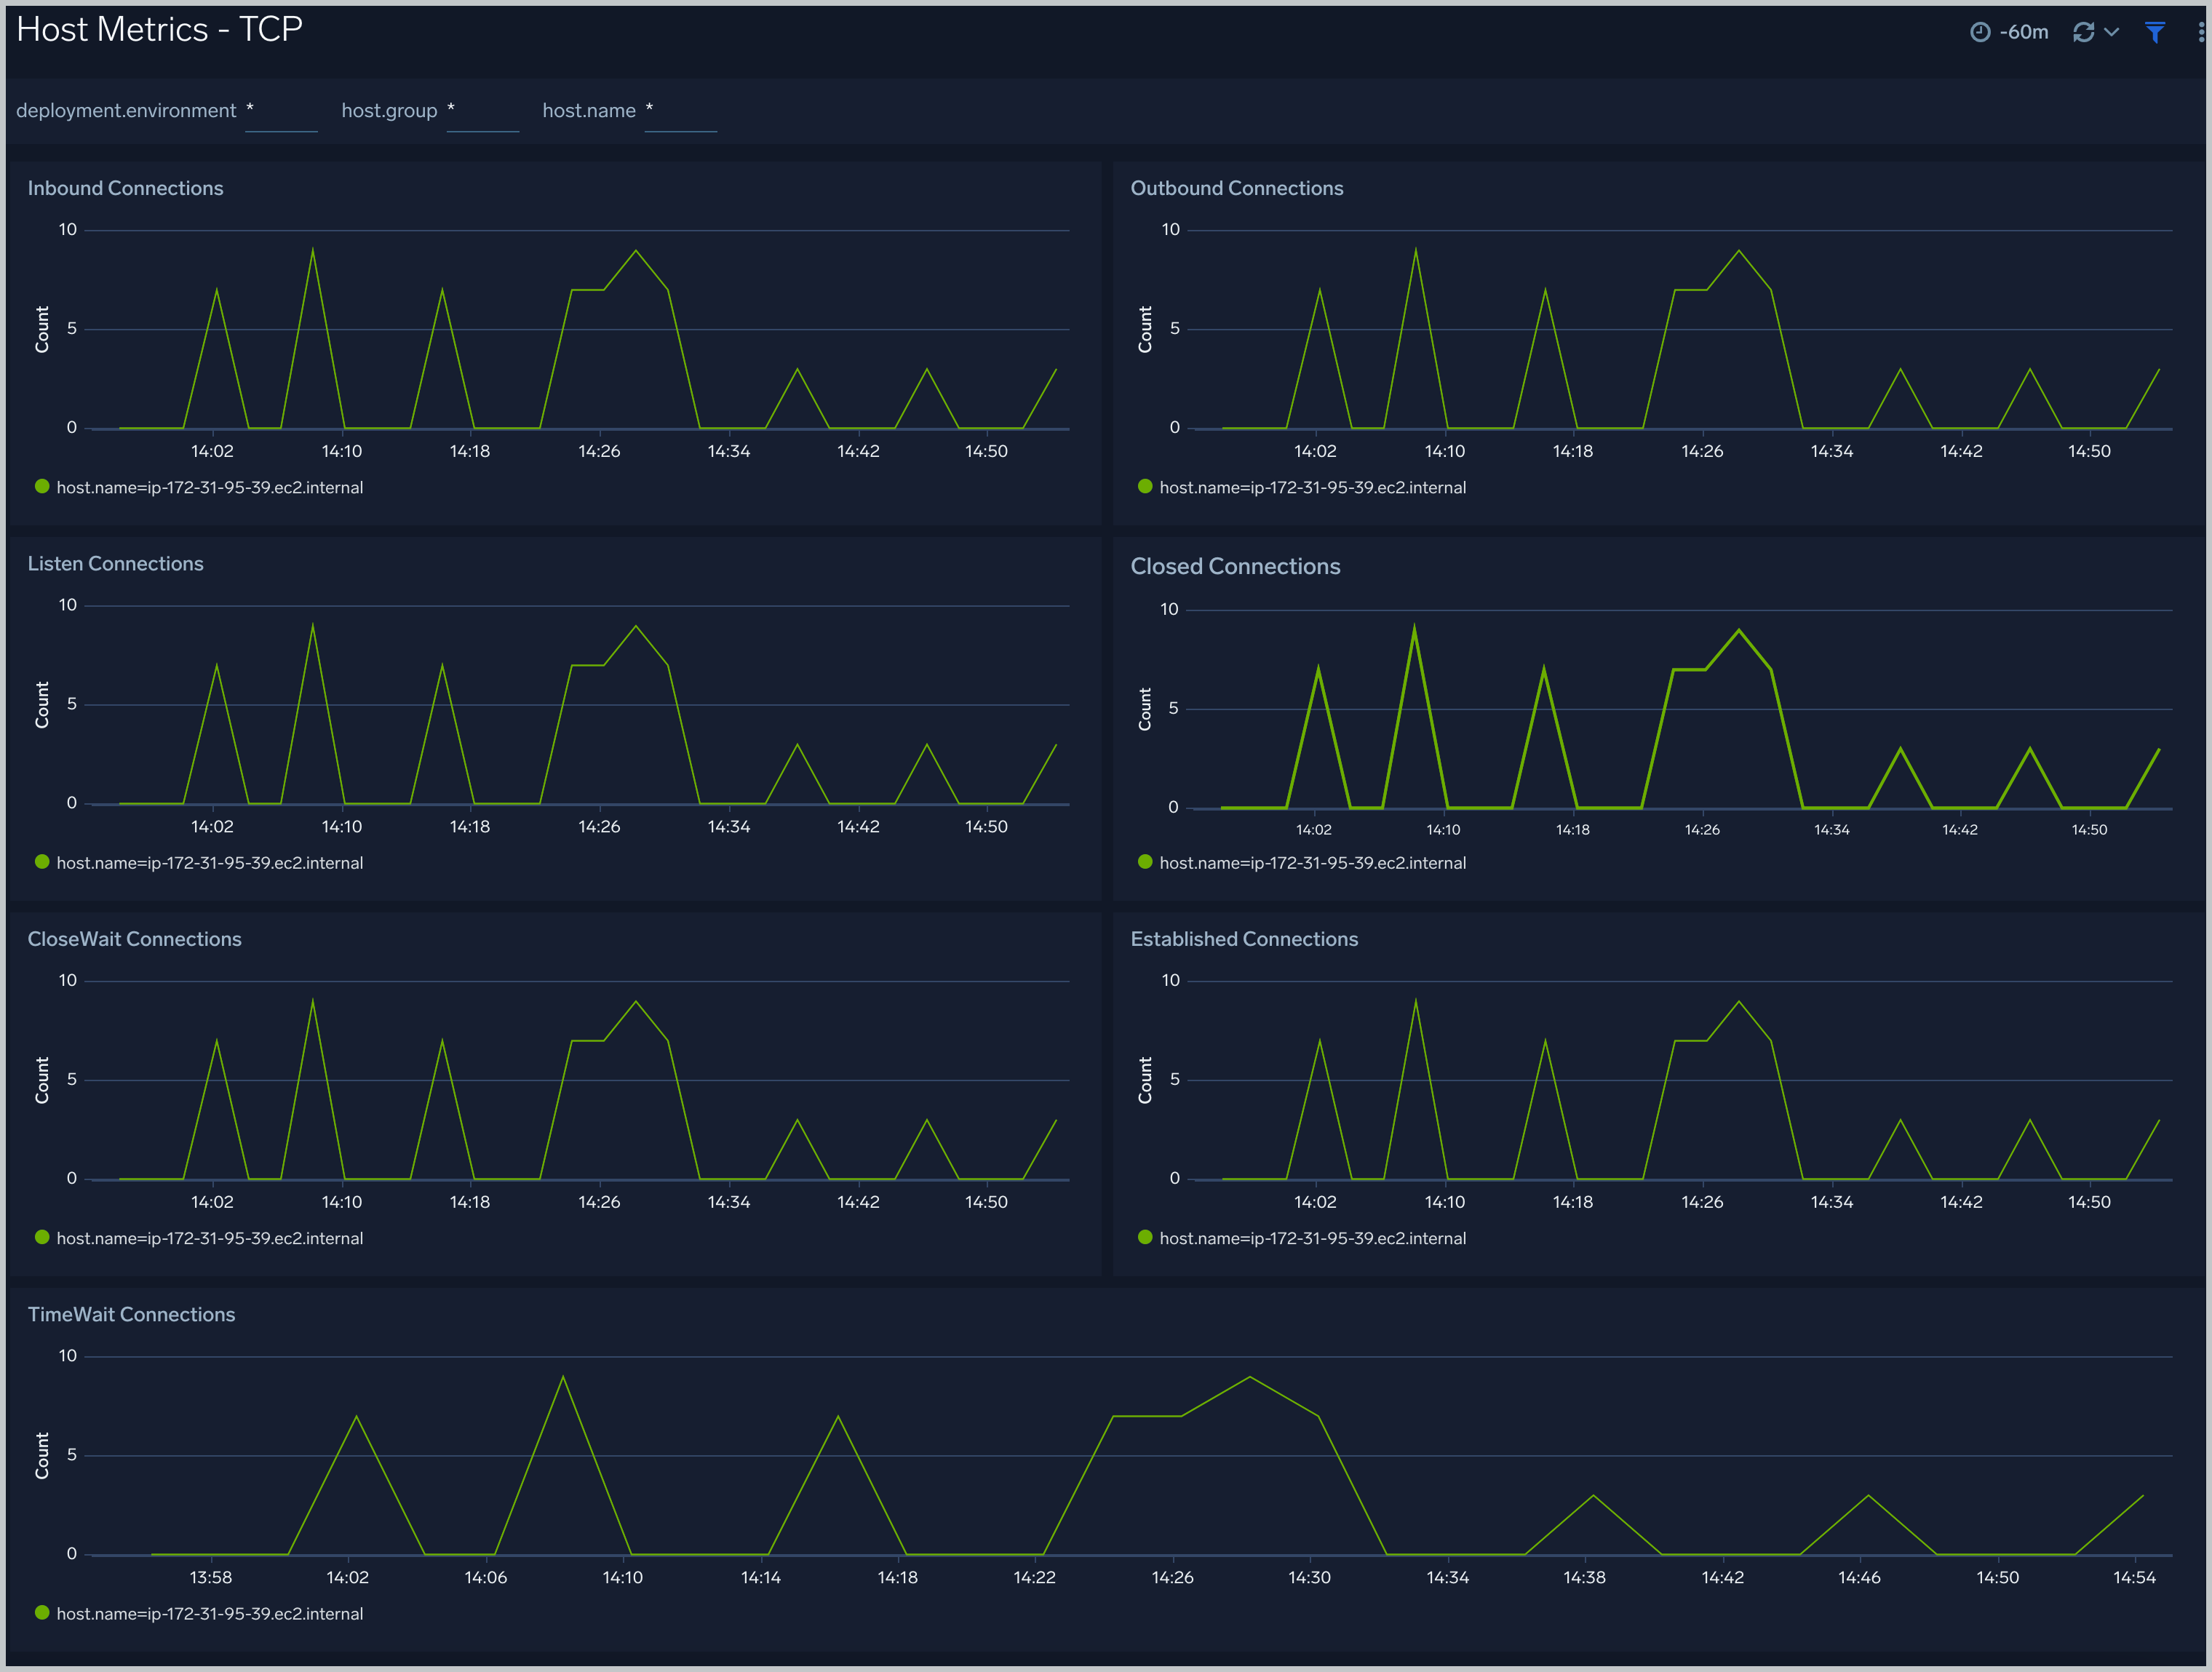
Host Metrics - TCP
The Host Metrics - TCP dashboard provides detailed information around inbound, outbound, open, and established TCP connections.
Use this dashboard to:
- Identify abnormal spikes in inbound, outbound, open, or established connections.
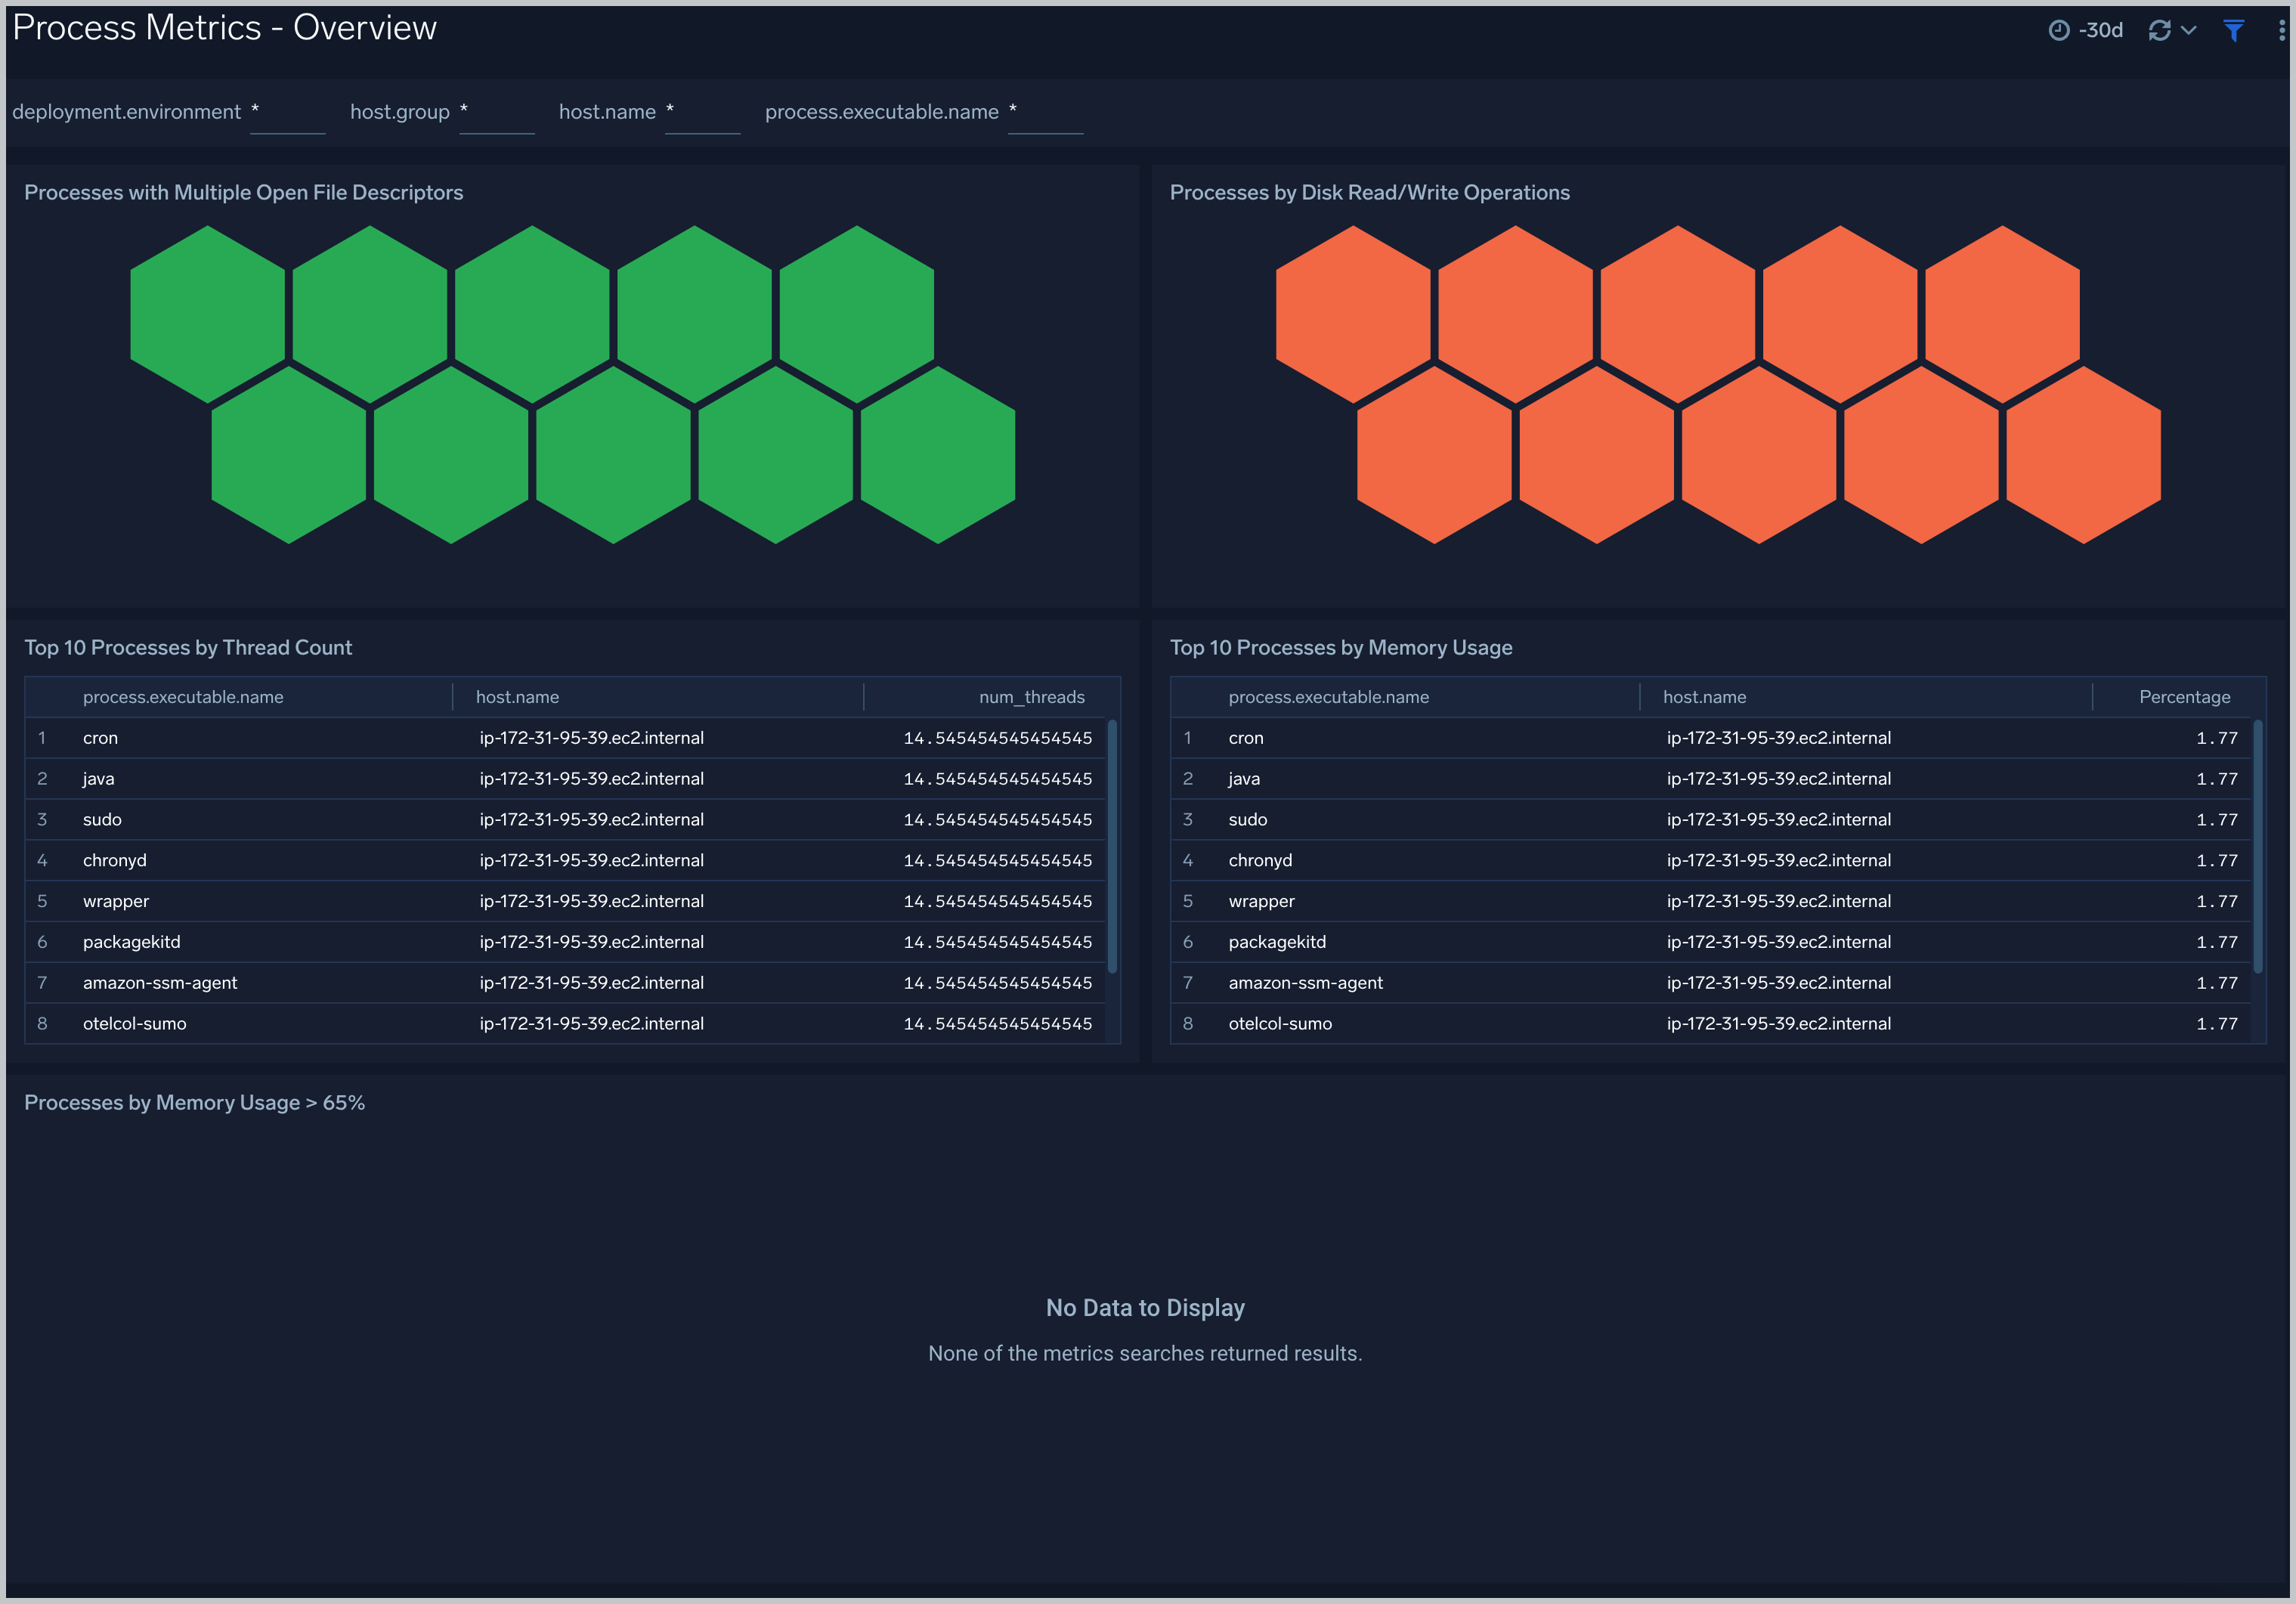
The Process Metrics - Overview
The Process Metrics - Overview dashboard gives you an at-a-glance view of all the processes by open file descriptors, CPU usage, memory usage, disk read/write operations and thread count.
User this dashboard to:
- Process wise distribution of CPU and memory usage.
- Process wise read/write operations.
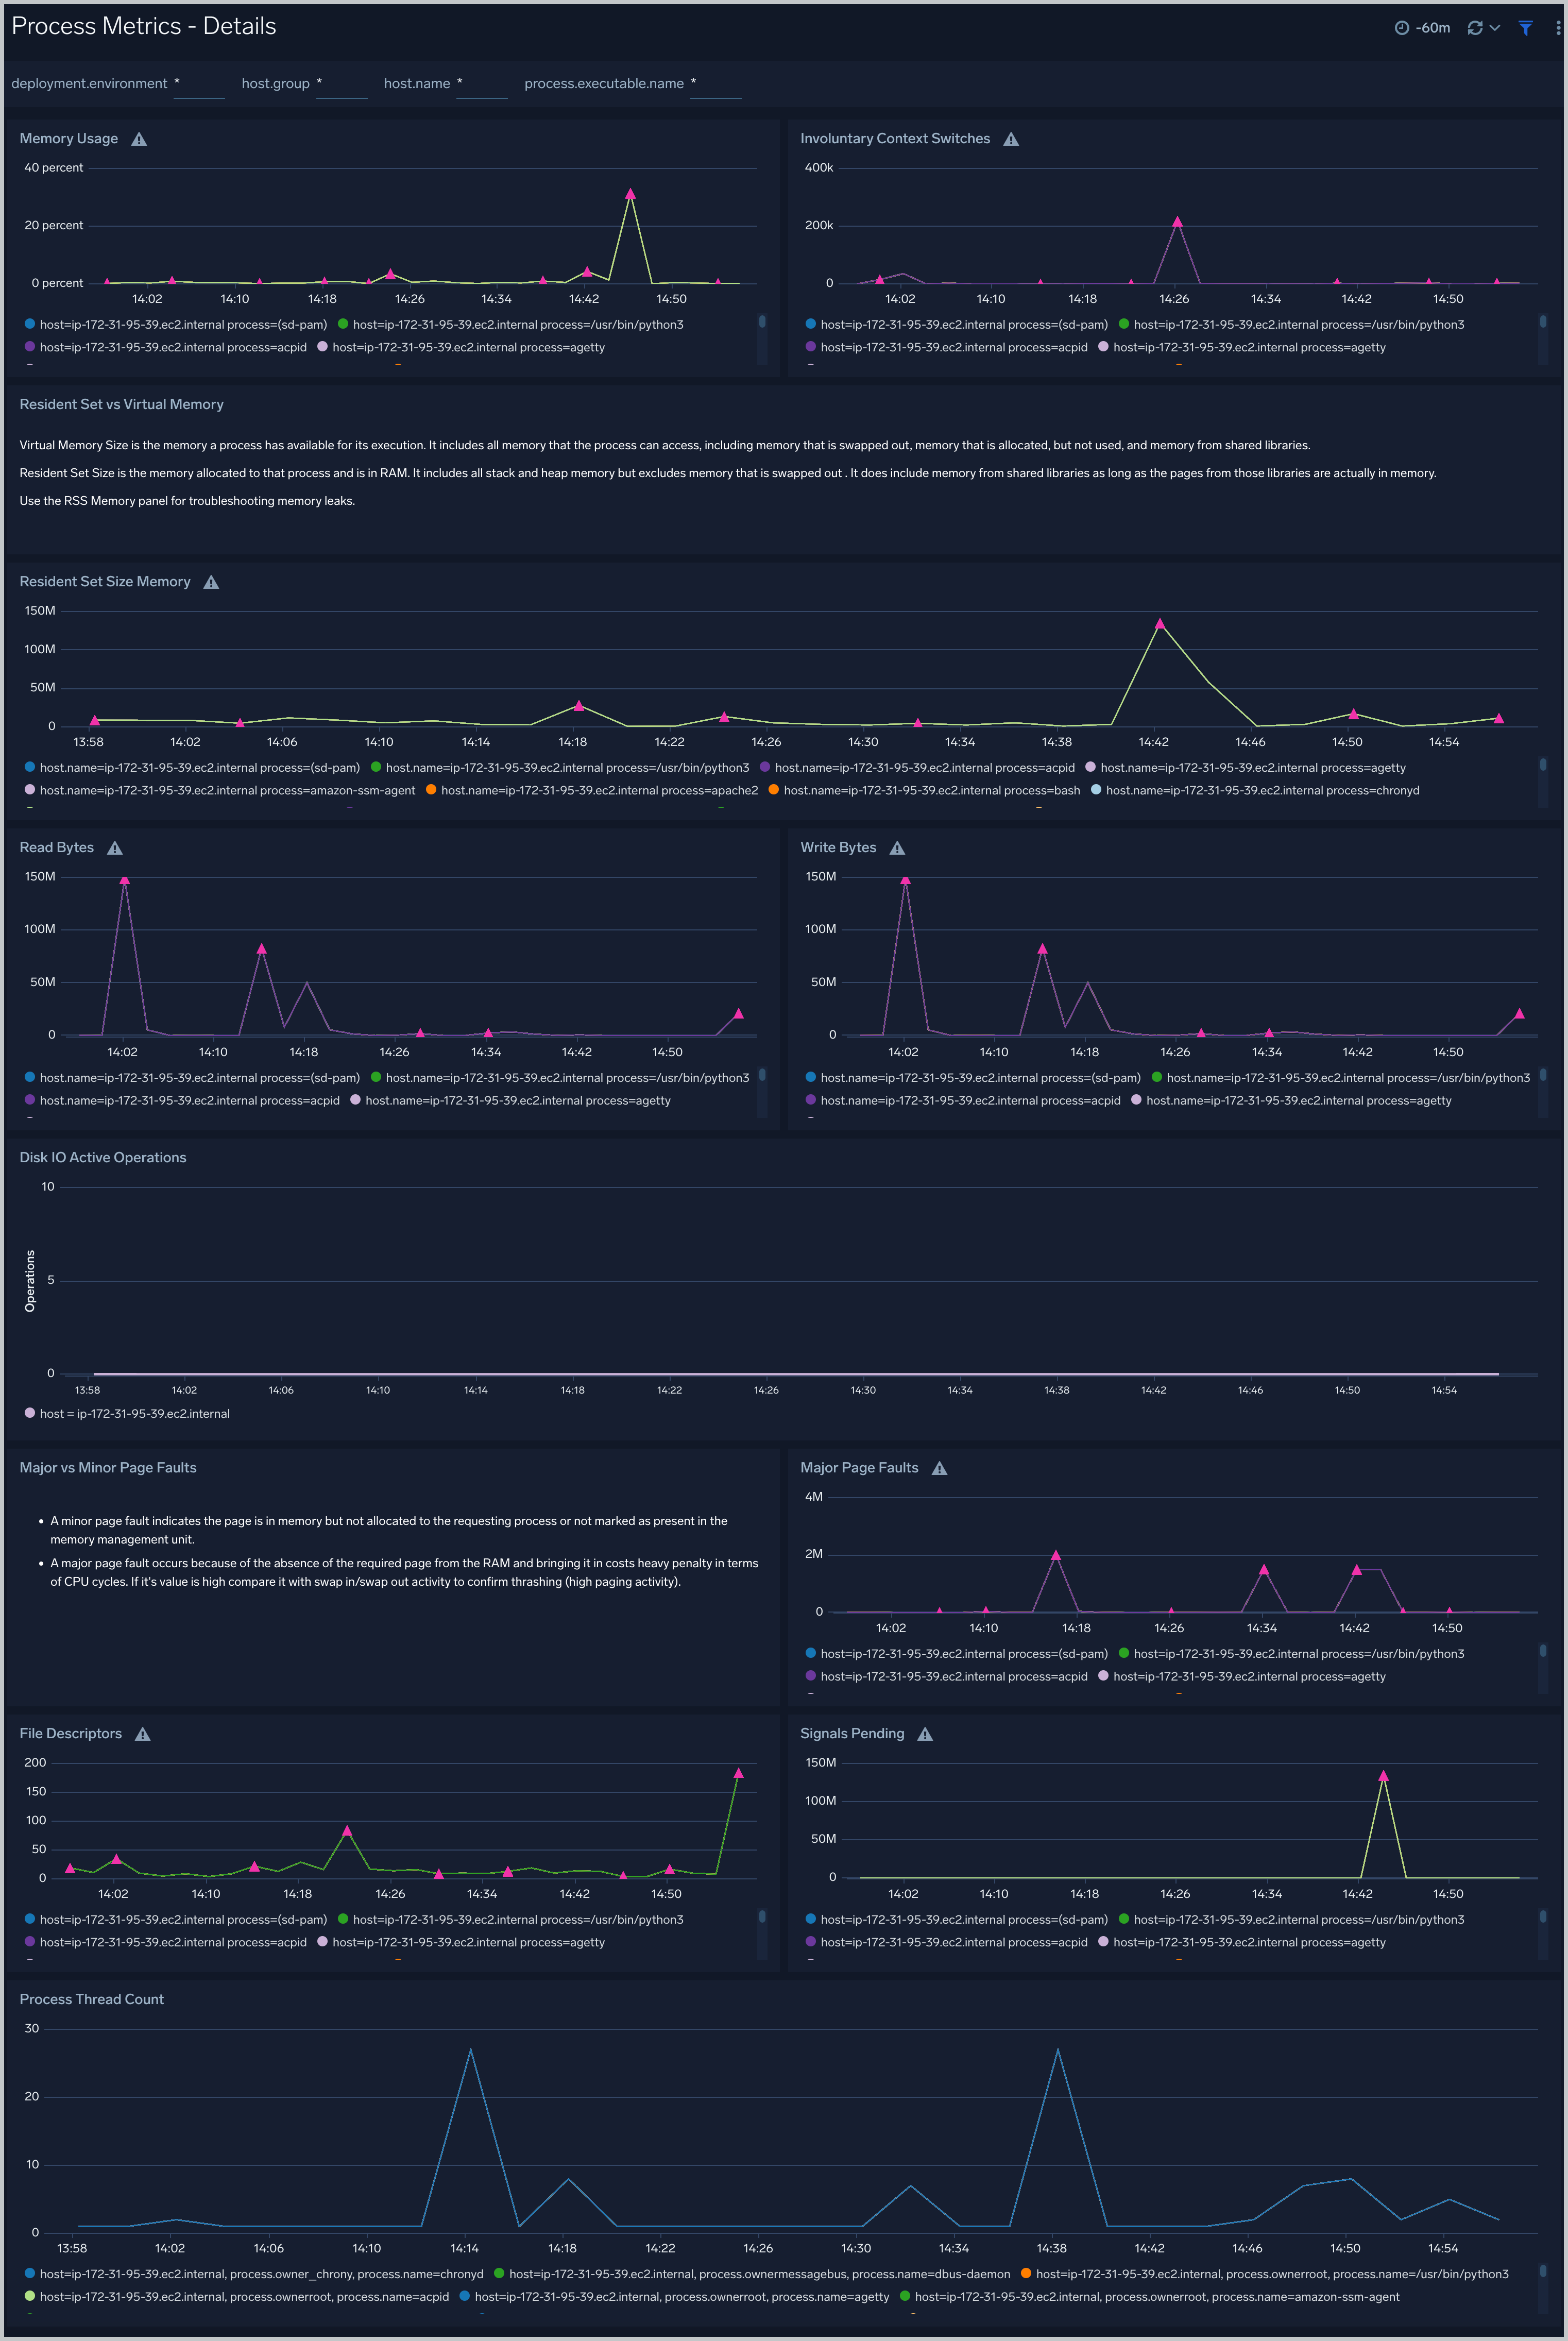
Process Metrics - Details
The Process Metrics - Details dashboard gives you a detailed view of key process related metrics such as CPU and memory utilization, disk read/write throughput, and major/minor page faults.
Use this dashboard to:
- Determine the number of open file descriptors in all hosts. If the number of open file descriptors reaches the maximum file descriptor limits, it can cause IOException errors.
- Identify anomalies in CPU usage, memory usage, major/minor page faults and reads/writes over time.
- Troubleshoot memory leaks using the resident set memory trend chart.
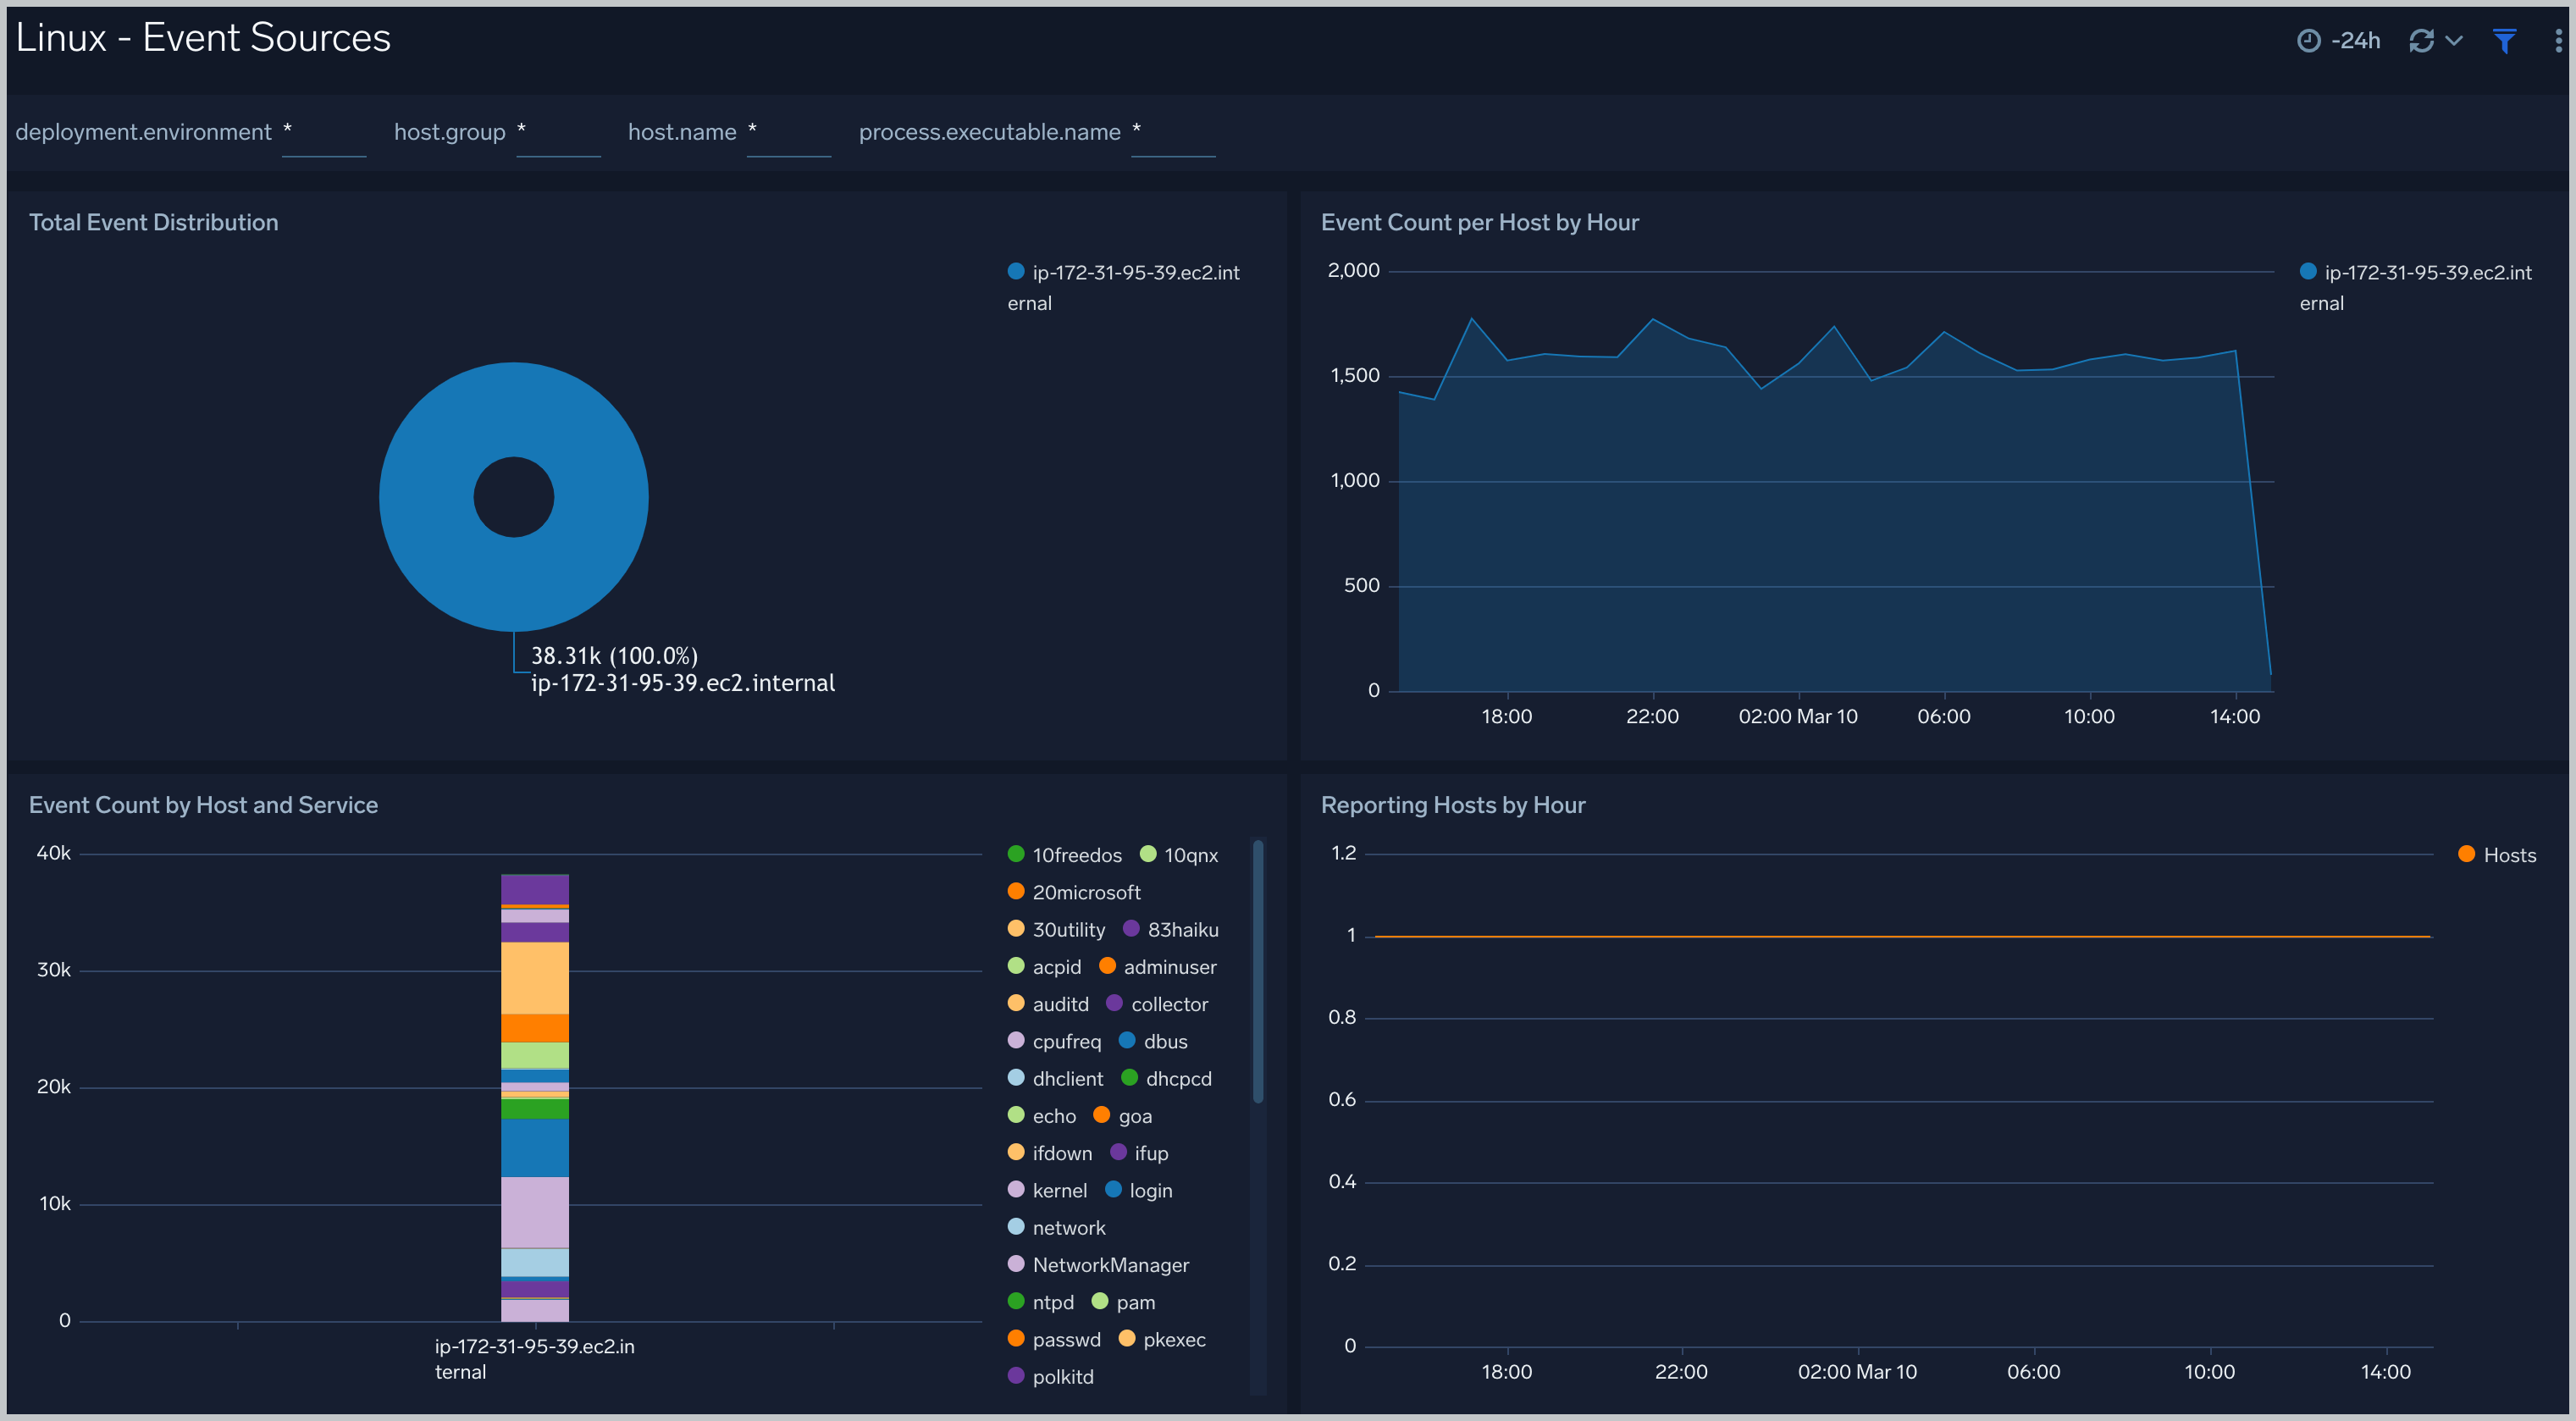
Linux - Event Sources
The Linux - Event Sources dashboard provides information about system events, including their distribution across hosts, event counts per host by hour, and even counts by host and service.
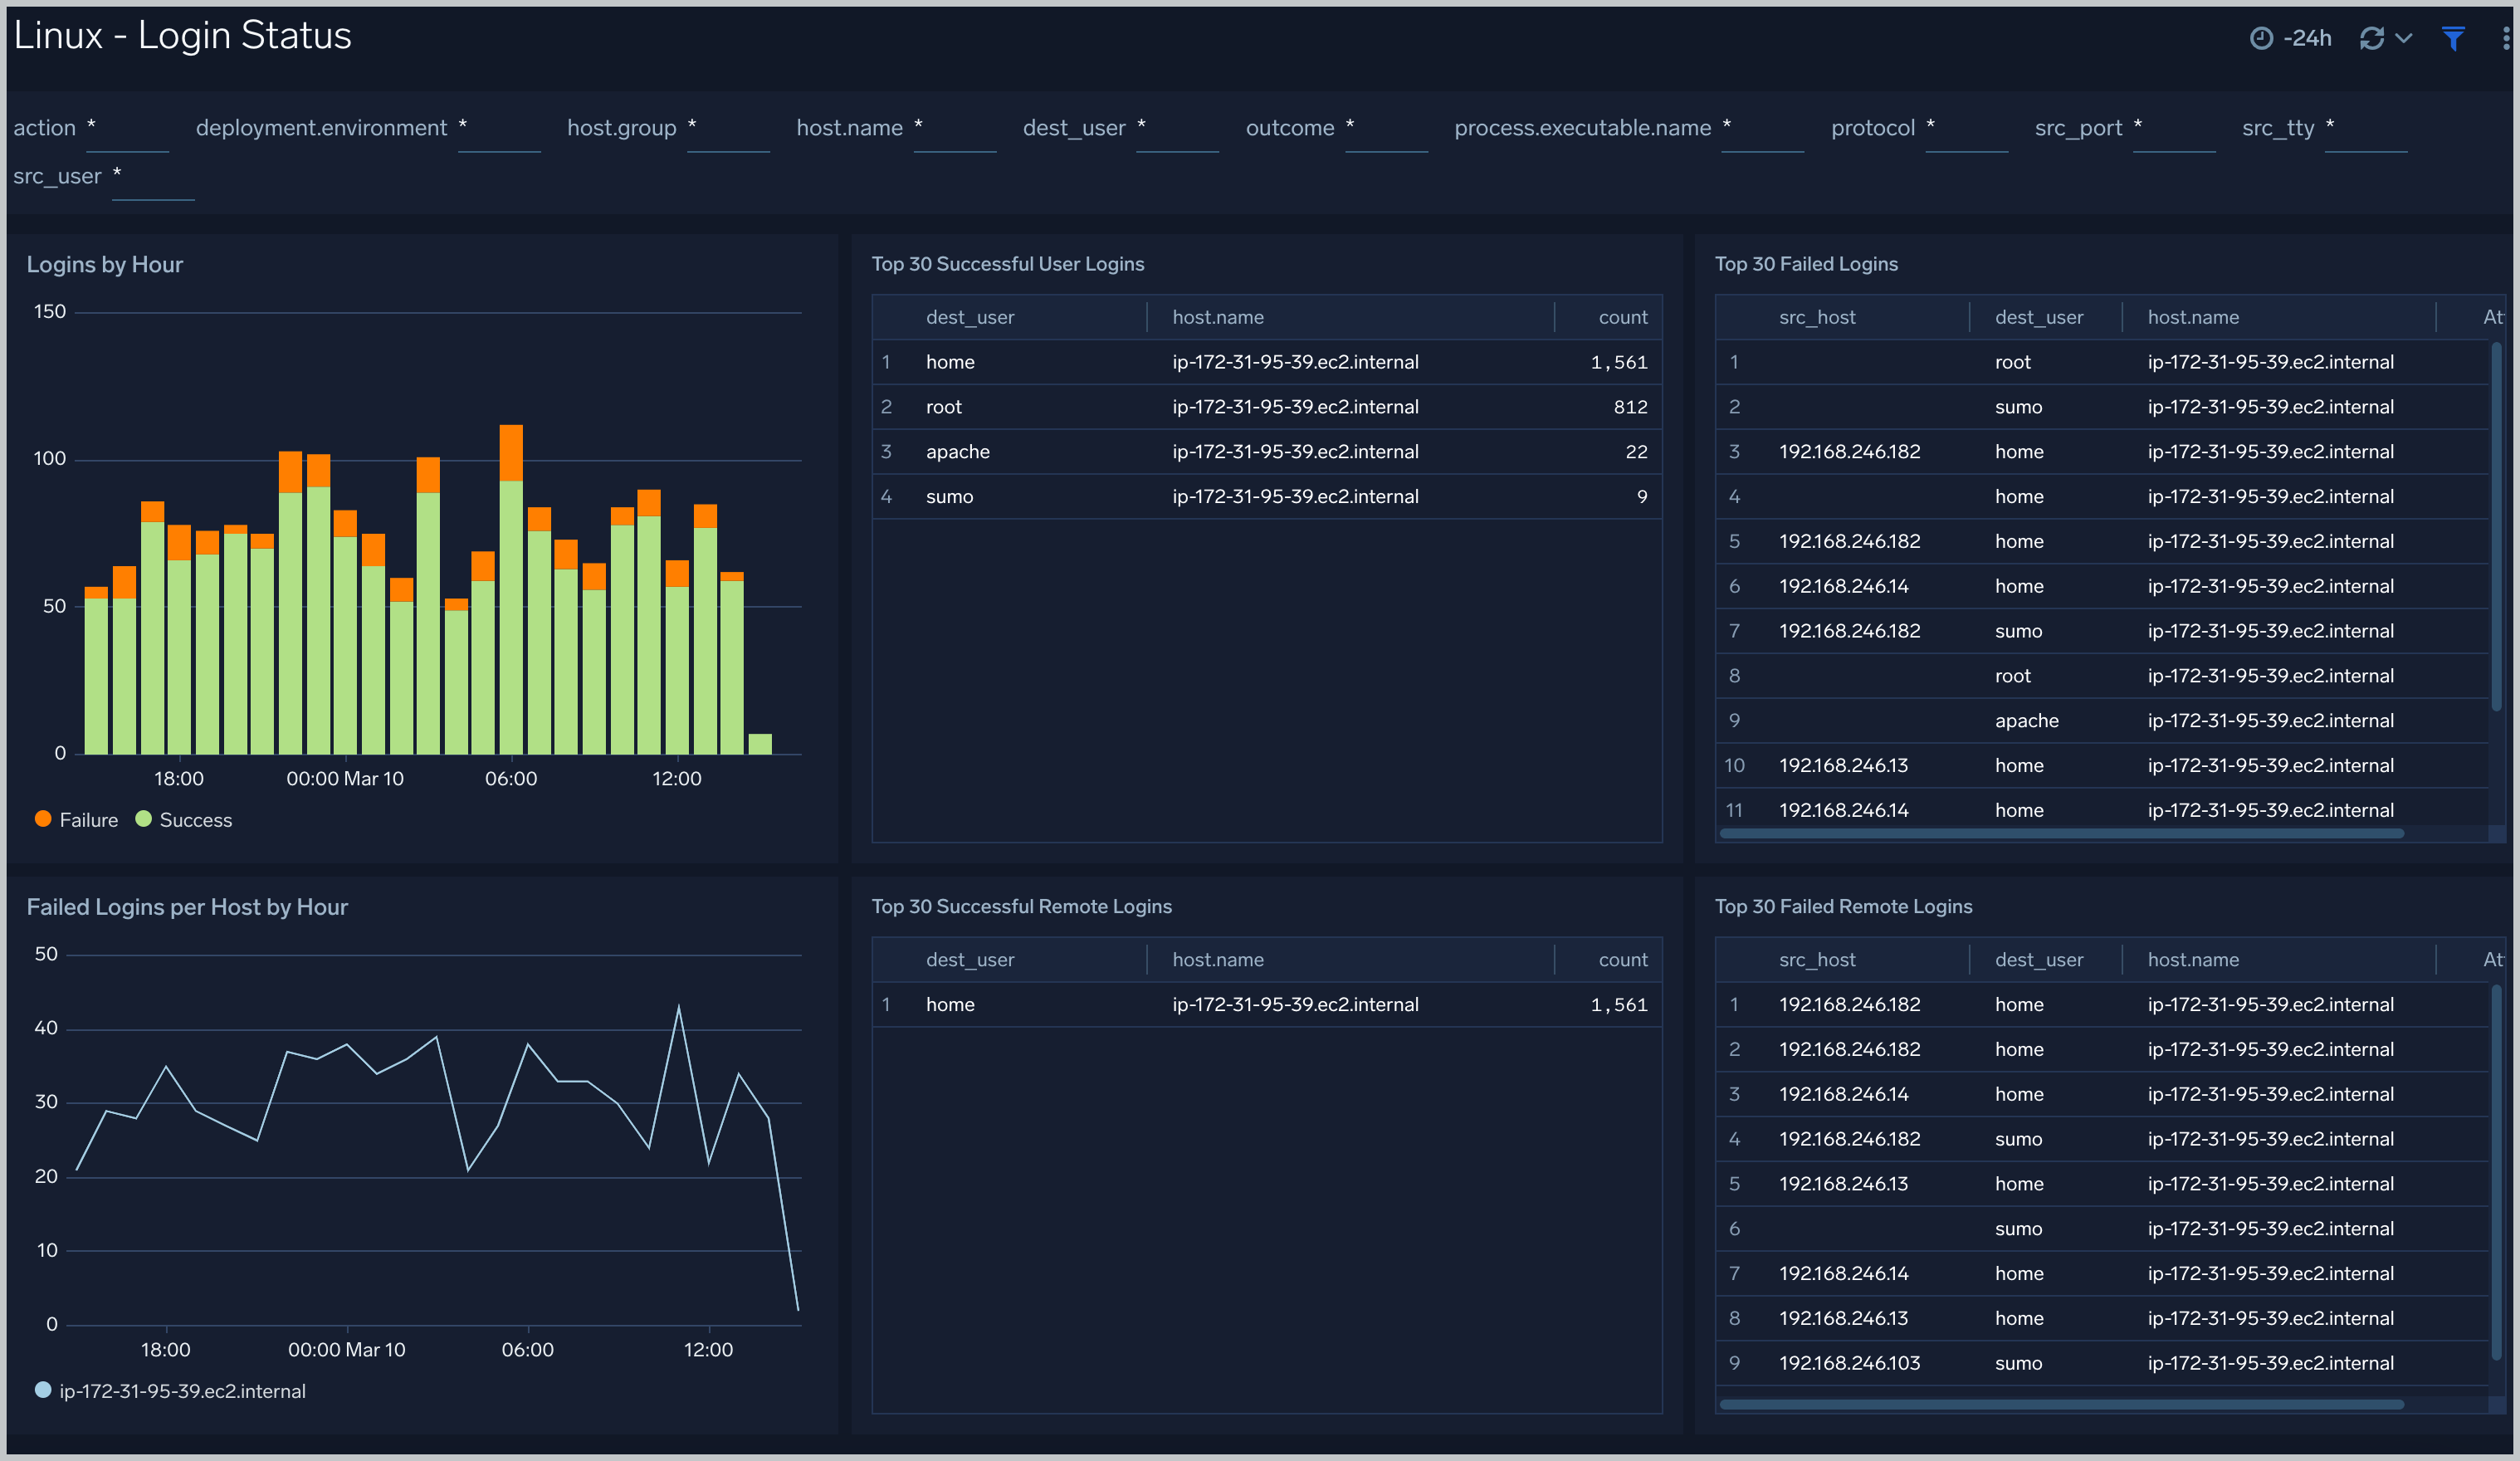
Linux - Login Status
The Linux - Login Status dashboard provides information about logins to Linux hosts; including logins by hour; failed logins per host; the top 30 successful and failed logins; and the top 30 successful and failed remote logins.
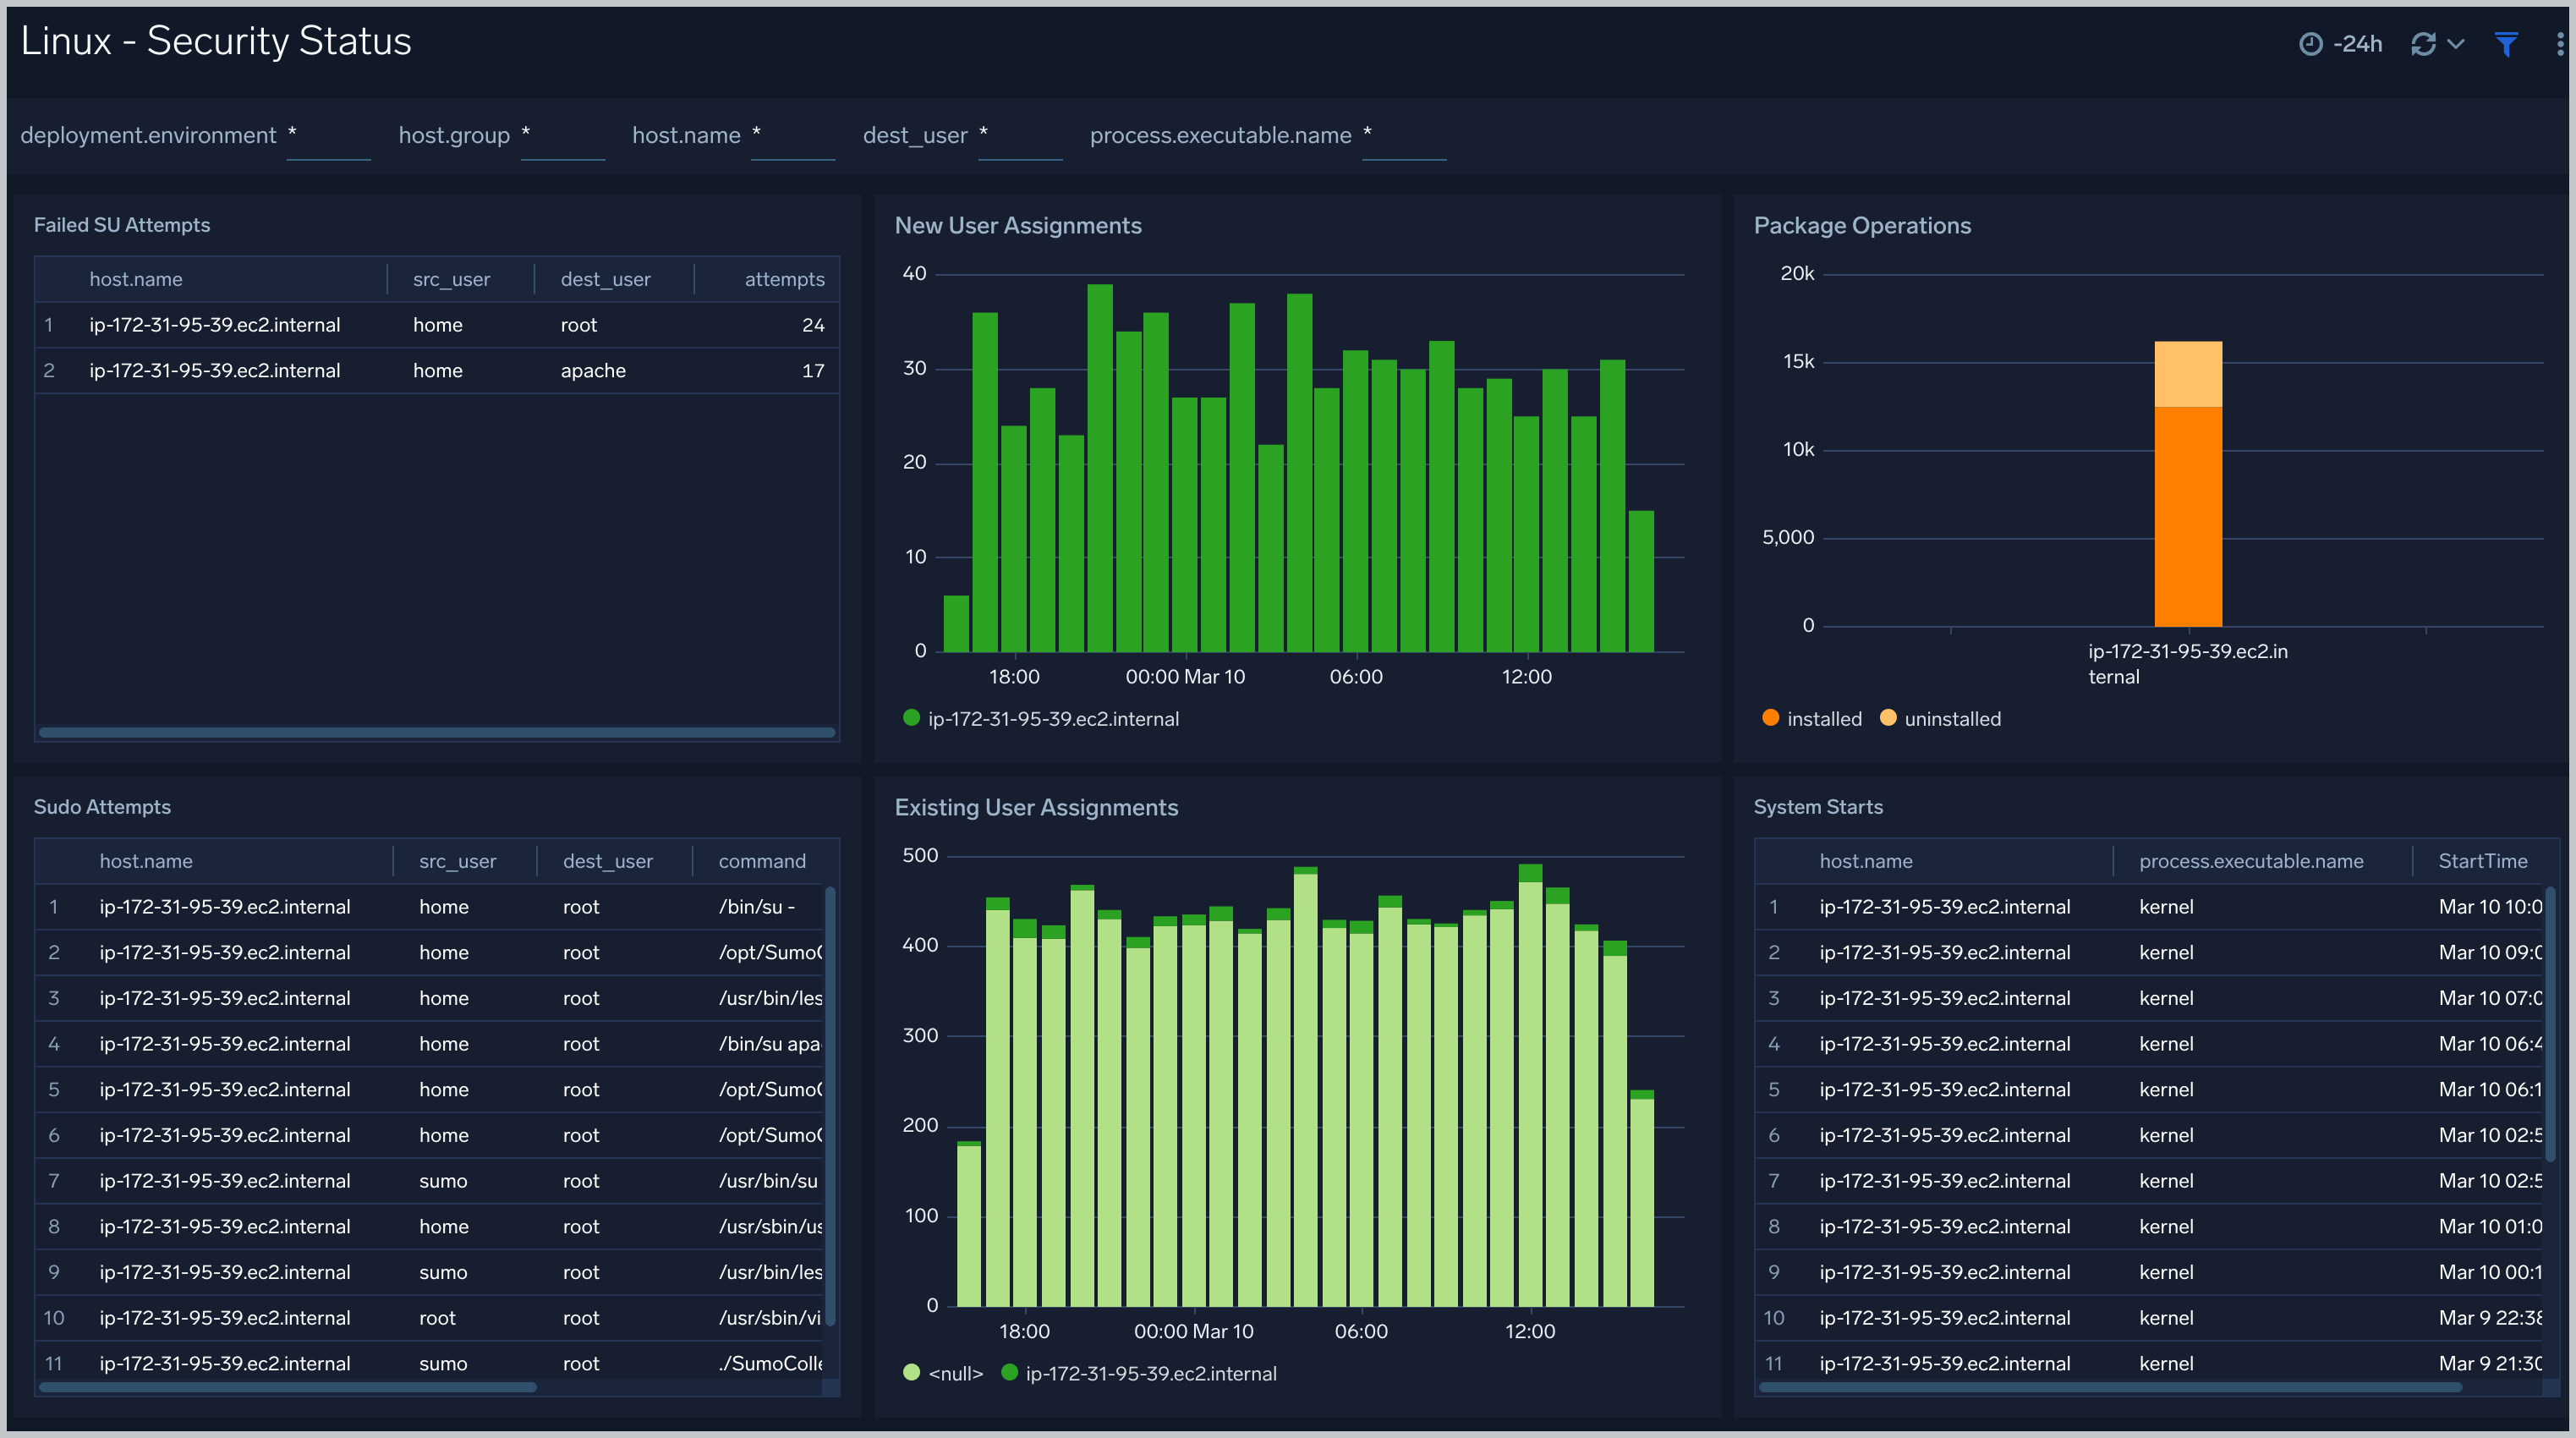
Linux - Security Status
The Linux - Security Status dashboard provides information about security on Linux hosts, including su, sudo attempts, new and existing user assignments, package operations, and system start events.