Okta

Okta provides secure connections between people and your applications on any device through identity management service built for the cloud. The Sumo Logic app for Okta helps you monitor the admin actions, failed logins, successful logins, and user activities to your applications through Okta. The app consists of dashboards that give you visibility into the applications, accesses, user events, and Multi-Factor Authentication (MFA).
Log types and versions
The Sumo Logic collector uses Okta System Log API to get the logs of Okta System. The log types include authentication, events, and actions. For more information on the Okta log API, see here.
Sample log messages
Click to expand
{
   "actor":{
      "id":"00u17b6c3rwVP7kqo1d8",
      "type":"User",
      "alternateId":"kyle.diedrich@company.com",
      "displayName":"Kyle Diedrich",
      "detailEntry":null
   },
   "client":{
      "userAgent":{
         "rawUserAgent":"PostmanRuntime/3.0.11-hotfix.2",
         "os":"Unknown",
         "browser":"UNKNOWN"
      },
      "zone":"null",
      "device":"Unknown",
      "id":null,
      "ipAddress":"12.97.85.90",
      "geographicalContext":{
         "city":"San Francisco",
         "state":null,
         "country":"United States",
         "postalCode":"94107",
         "geolocation":{
            "lat":37.7697,
            "lon":-122.3933
         }
      }
   },
   "authenticationContext":{
      "authenticationProvider":null,
      "credentialProvider":null,
      "credentialType":null,
      "issuer":null,
      "interface":null,
      "authenticationStep":0,
      "externalSessionId":"trsp5PU7OIoTgCOdFBgJOQWIA"
   },
   "displayMessage":"Delete application",
   "eventType":"application.lifecycle.delete",
   "outcome":{
      "result":"SUCCESS",
      "reason":null
   },
   "published":"2017-10-02T17:38:45+0000",
   "securityContext":{
      "asNumber":null,
      "asOrg":null,
      "isp":null,
      "domain":null,
      "isProxy":null
   },
   "severity":"INFO",
   "debugContext":{
      "debugData":{
         "requestUri":"/api/v1/apps/0oa1alyz0mr8M2MoG1d8"
      }
   },
   "legacyEventType":"app.generic.config.app_deleted",
   "transaction":{
      "type":"WEB",
      "id":"WRzO-wWGVlYAavrUTHqwcgAABsA",
      "detail":{ }
   },
   "uuid":"49916412-d679-4285-b3e0-d740c73e4999",
   "version":"0",
   "request":{
      "ipChain":[
         {
            "ip":"12.97.85.90",
            "geographicalContext":{
               "city":"San Francisco",
               "state":null,
               "country":"United States",
               "postalCode":"94107",
               "geolocation":{
                  "lat":37.7697,
                  "lon":-122.3933
               }
            },
            "version":"V4",
            "source":null
         },
         {
            "ip":"54.235.68.72",
            "geographicalContext":{
               "city":"Ashburn",
               "state":null,
               "country":"United States",
               "postalCode":"20149",
               "geolocation":{
                  "lat":39.0481,
                  "lon":-77.4728
               }
            },
            "version":"V4",
            "source":null
         }
      ]
   },
   "target":[
      {
         "id":"0oa1alyz0mr8M2MoG1d8",
         "type":"AppInstance",
         "alternateId":"Cisco AnyConnect VPN (2)",
         "displayName":"Cisco AnyConnect VPN",
         "detailEntry":null
      }
   ]
}
Sample queries
_sourceCategory = "okta" "application.lifecycle.delete"
| json field=_raw "eventType" as event_type
| where event_type = "application.lifecycle.delete"
| json field=_raw "outcome.result" as outcome_result
| json field=_raw "displayMessage" as display_message
| json field=_raw "published"as published_time
| json field=_raw "actor.displayName" as okta_user_name
| json field=_raw "actor.alternateId" as okta_user_id
| json field=_raw "actor.type"
| json field=_raw "severity" as severity
| json field=_raw "target[0].displayName" as app_name
| json field=_raw "target[0].type" as app_type
| json field=_raw "client.ipAddress" as client_ip
| json field=_raw "client.geographicalContext.city" as city
| json field=_raw "client.geographicalContext.state" as state
| json field=_raw "client.geographicalContext.country" as country
| json field=_raw "client.geographicalContext.postalCode" as postal_code
| count by app_name, okta_user_id, outcome_result, display_message
_sourceCategory = "okta" "user.mfa.factor.deactivate"
| json field=_raw "eventType" as event_type
| where event_type = "user.mfa.factor.deactivate"
| json field=_raw "outcome.result" as outcome_result
| json field=_raw "published" as published_time
| json field=_raw "actor.displayName" as actor
| json field=_raw "actor.alternateId" as actor_id
| json field=_raw "actor.type"
| json field=_raw "severity" as severity
| json field=_raw "client.userAgent.os" as OS
| json field=_raw "client.userAgent.browser" as browser
| json field=_raw "client.device" as device
| json field=_raw "client.ipAddress" as client_ip
| json field=_raw "client.geographicalContext.country" as country
| json field=_raw "client.geographicalContext.state" as state
| json field=_raw "client.geographicalContext.city" as city
| json field=_raw "target[0].displayName" as okta_user_name
| json field=_raw "target[0].alternateId" as okta_user_id
| count by okta_user_id, actor, outcome_result, country, state
Configuring Okta Log Collection
Use the new Cloud-to-Cloud Integration for Okta to create the source and use the same source category while installing the app.
The Okta Log Collection configuration via SumoJanus is no longer applicable and deprecated. We recommend switching to Cloud-to-Cloud integration to configure the Okta Log collection. The steps must be completed in the order they are presented.
Installing the Okta app
To install the app, do the following:
- Select App Catalog.
- In the 🔎 Search Apps field, run a search for your desired app, then select it.
- Click Install App.
note
Sometimes this button says Add Integration.
- Click Next in the Setup Data section.
- In the Configure section of your respective app, complete the following fields.
- Key. Select either of these options for the data source.
- Choose Source Category and select a source category from the list for Default Value.
- Choose Custom, and enter a custom metadata field. Insert its value in Default Value.
- Key. Select either of these options for the data source.
- Click Next. You will be redirected to the Preview & Done section.
Post-installation
Once your app is installed, it will appear in your Installed Apps folder, and dashboard panels will start to fill automatically.
Each panel slowly fills with data matching the time range query and received since the panel was created. Results will not immediately be available, but will update with full graphs and charts over time.
Upgrading the Okta app (Optional)
To update the app, do the following:
- Select App Catalog.
- In the Search Apps field, search for and then select your app.
Optionally, you can identify apps that can be upgraded in the Upgrade available section. - To upgrade the app, click Upgrade.
- If the upgrade does not have any configuration or property changes, you will be redirected to the Preview & Done section.
- If the upgrade has any configuration or property changes, you will be redirected to Setup Data page.
- In the Configure section of your respective app, complete the following fields.
- Key. Select either of these options for the data source.
- Choose Source Category and select a source category from the list for Default Value.
- Choose Custom and enter a custom metadata field. Insert its value in Default Value.
- Key. Select either of these options for the data source.
- Click Next. You will be redirected to the Preview & Done section.
- In the Configure section of your respective app, complete the following fields.
Post-update
Your upgraded app will be installed in the Installed Apps folder, and dashboard panels will start to fill automatically.
See our Release Notes changelog for new updates in the app.
Uninstalling the Okta app (Optional)
To uninstall the app, do the following:
- Select App Catalog.
- In the 🔎 Search Apps field, run a search for your desired app, then select it.
- Click Uninstall.
Viewing Okta dashboards
All dashboards have a set of filters that you can apply to the entire dashboard. Use these filters to drill down and examine the data to a granular level.
- You can change the time range for a dashboard or panel by selecting a predefined interval from a drop-down list, choosing a recently used time range, or specifying custom dates and times. Learn more.
- You can use template variables to drill down and examine the data on a granular level. For more information, see Filter with template variables.
- Most Next-Gen apps allow you to provide the scope at the installation time and are comprised of a key (
_sourceCategoryby default) and a default value for this key. Based on your input, the app dashboards will be parameterized with a dashboard variable, allowing you to change the dataset queried by all panels. This eliminates the need to create multiple copies of the same dashboard with different queries.
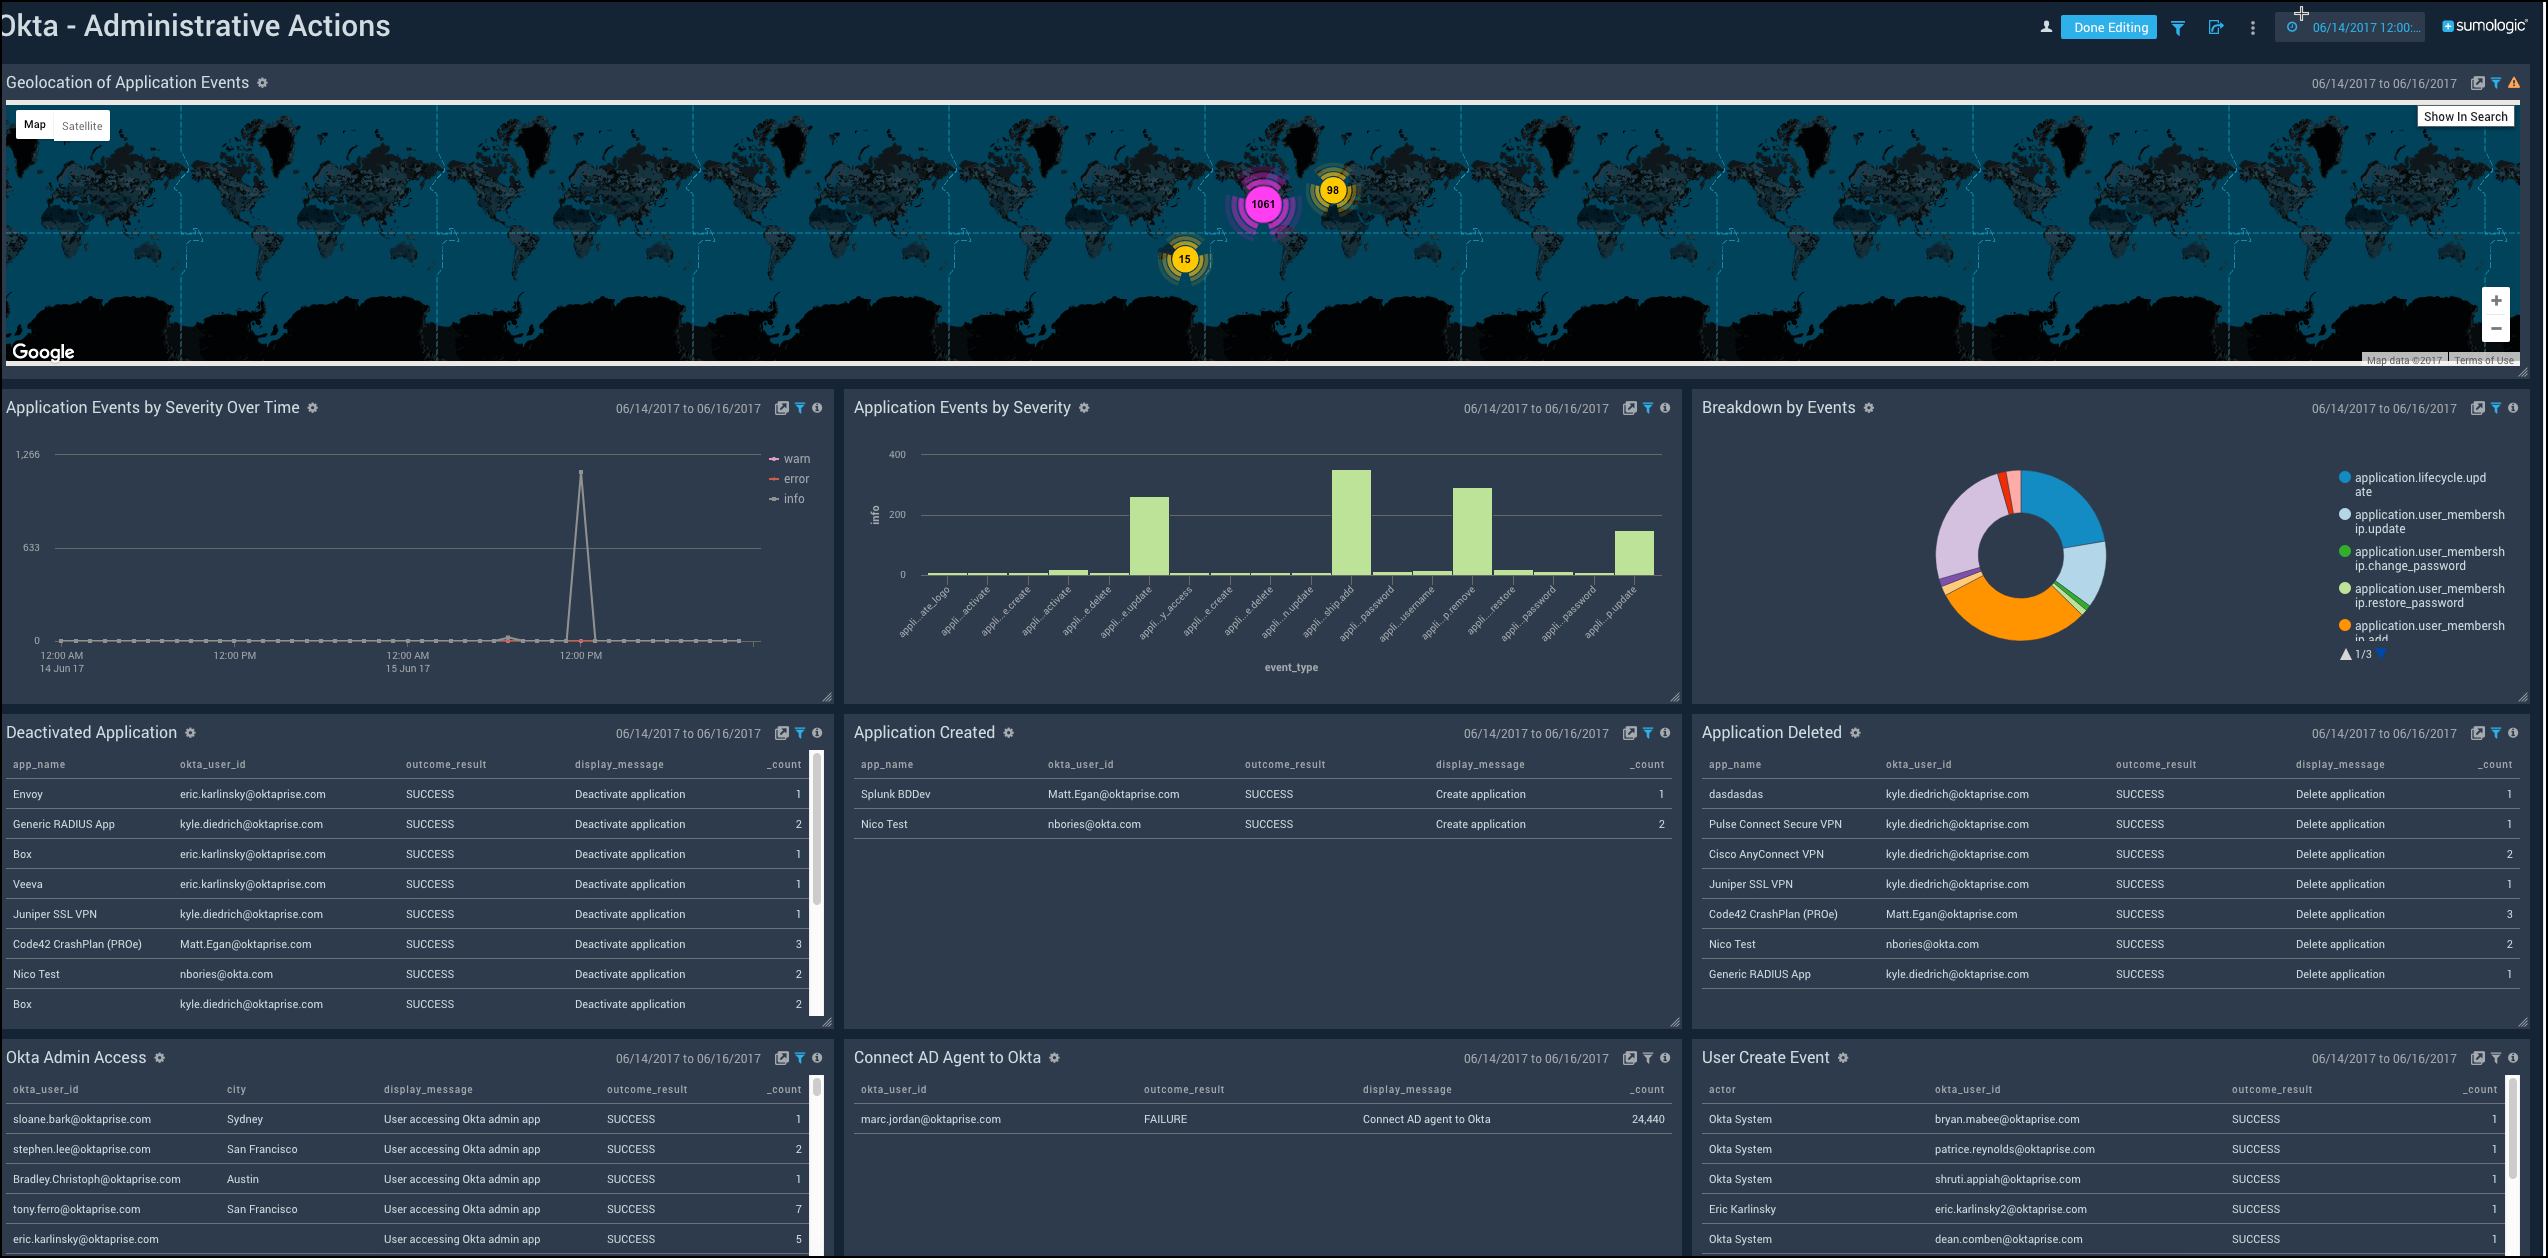
Administrative Actions
Shows the details of administrative actions such as the geolocation of application events, severity of events over time, application events, deactivated applications, application creation and deletion, admin accesses, and AD agent connection to Okta.
Geolocation of Application Events. See the number of application events across the world on a map in the last 24 hours.
Application Events by Severity Over Time. See the count of application events by severity in the last 24 hours on a line chart.
Application Events by Severity. See the count of application events by severity in the last 24 hours on a column chart.
Breakdown by Events. See the breakdown of administrative actions by events in the last 24 hours on a pie chart.
Deactivated Application. See the app name, user ID, outcome of access attempt, display message, and count of the deactivated applications in the last 24 hours displayed in a table.
Application Created. See the count of applications created in the last 24 hours along with the application name, user ID, message displayed, and the outcome result shown in a table.
Application Deleted. See the count of applications deleted in the last 24 hours along with the application name, user ID, message displayed, and the outcome result shown in a table.
Okta Admin Access. See the user ID, city, display message, outcome result, and count of the Okta Admin Access in the last 24 hours displayed in a table.
Connect AD Agent to Okta. See the details of connect AD agent to Okta such as the Okta user ID, outcome result, display message, and count, in the last 24 hours.
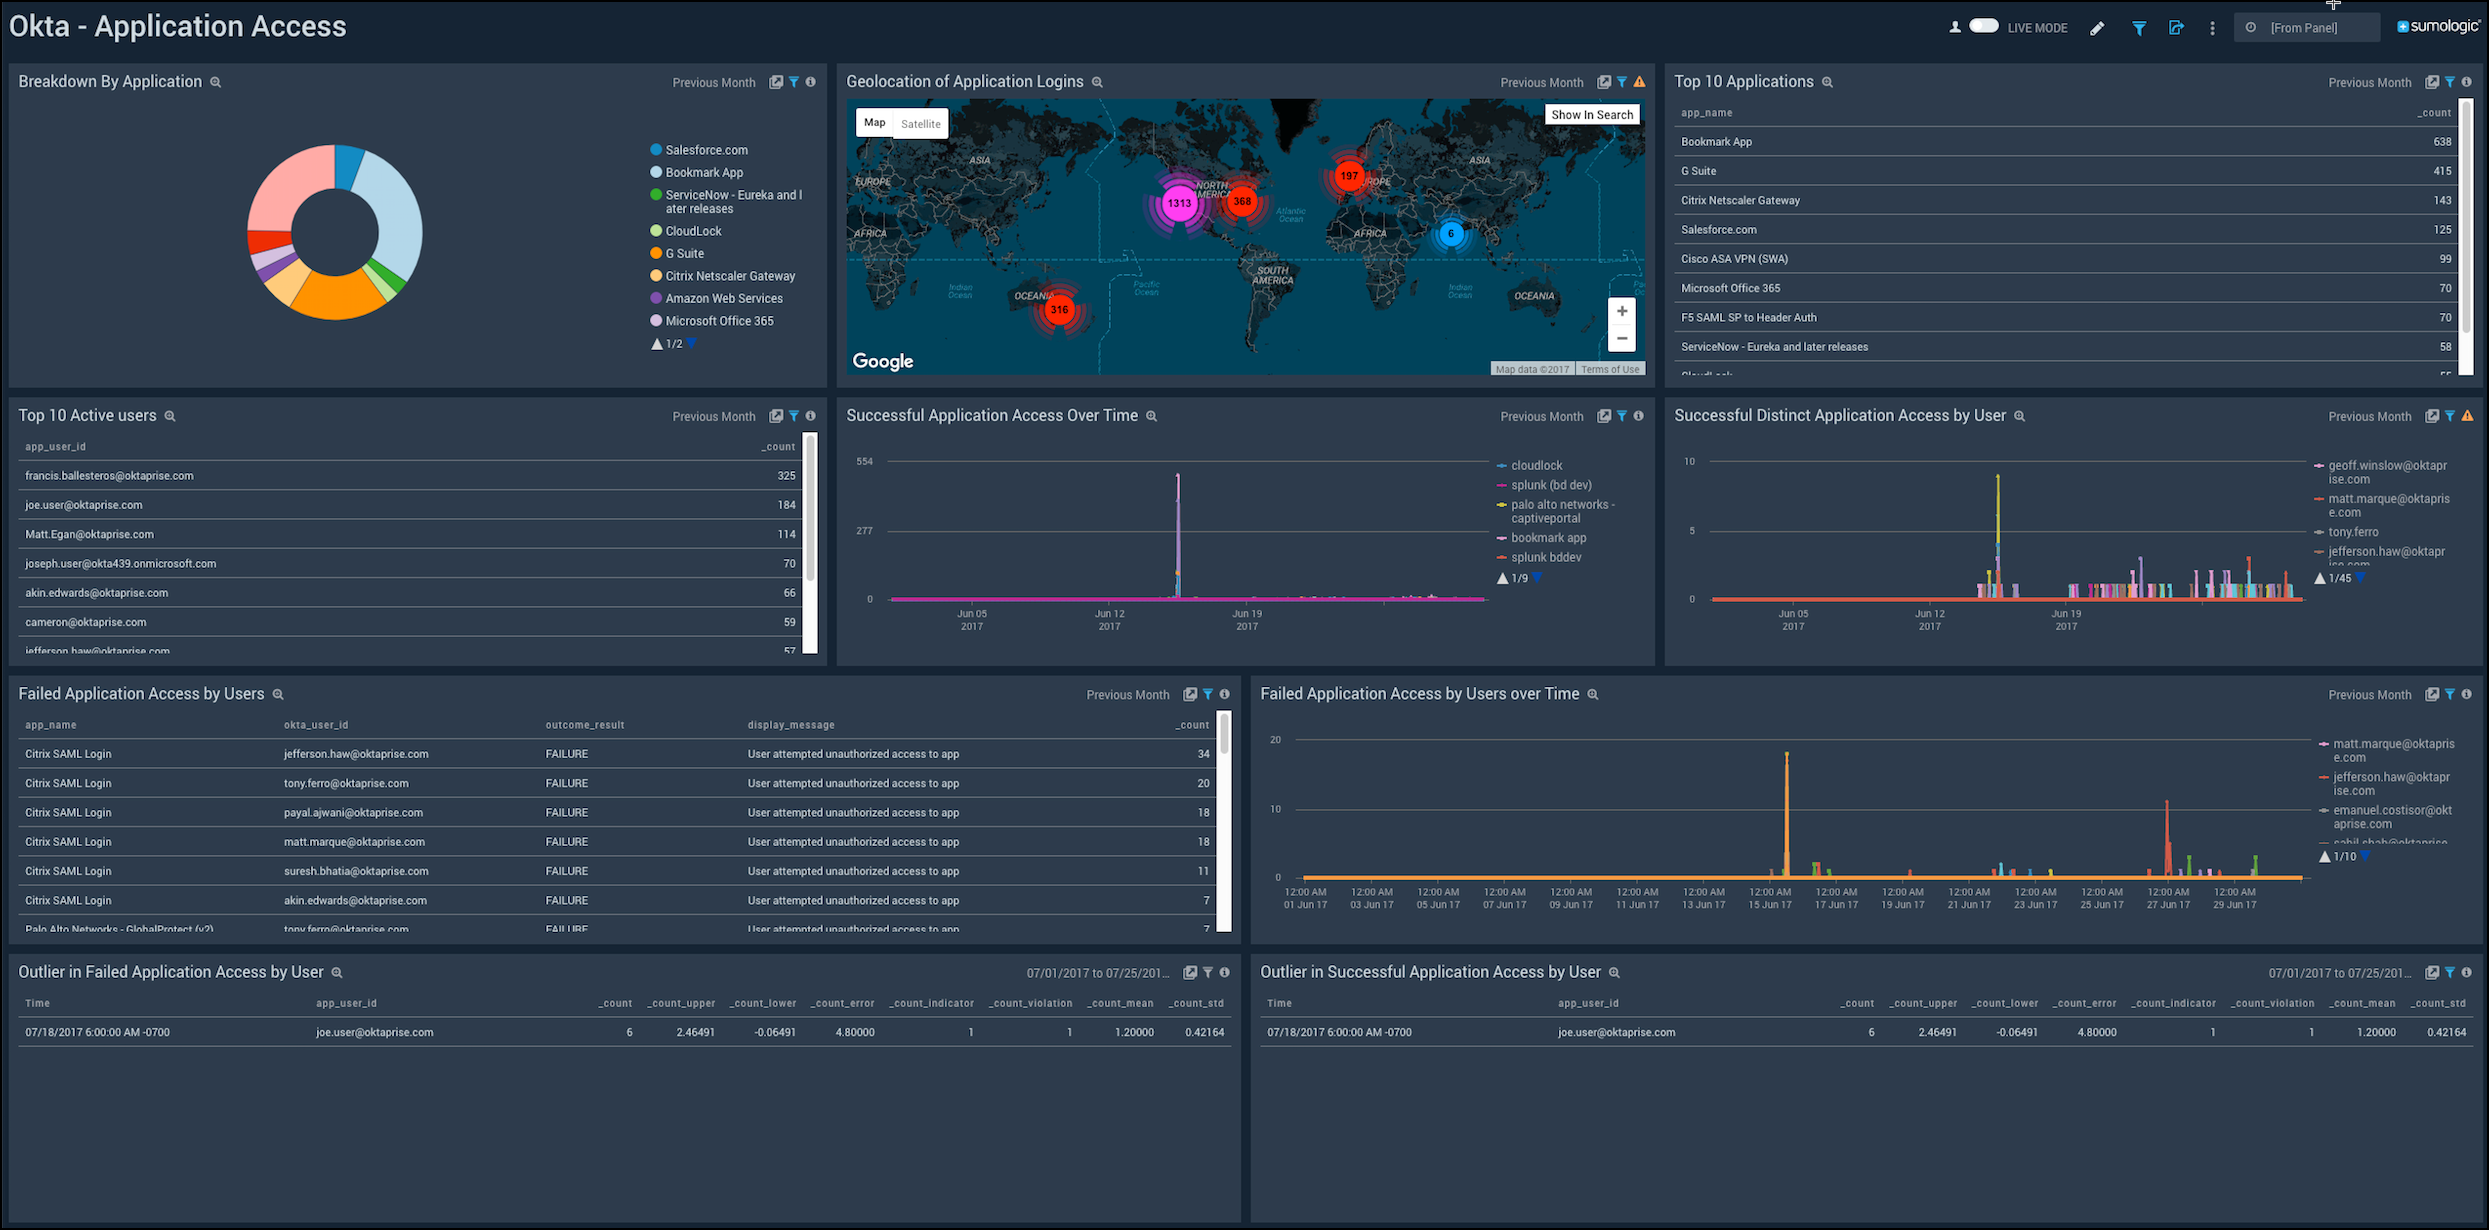
Application Access
Shows the details of accesses by different applications, the location of logins, top 10 active users, successful and failed accesses by applications.
Breakdown By Application. See the Okta access broken down by application in a pie chart for the last three days.
Geolocation of Application Logins. See the number of logins to the application across the world on a map for the last three days.
Top 10 Applications. See the name and count of the top 10 applications accessing Okta in the last three days in a table.
Top 10 Active users. See the name and count of the top 10 users accessing Okta the last three days displayed in a table.
Successful Application Access Over Time. See the successful application accesses over the last three days in a line chart.
Successful Distinct Application Access by User. See the successful application accesses by users over the last three days in a line chart.
Failed Application Access by Users. See the app name, user ID, outcome of access attempt, display message, and count of the failed access by users in the last three days displayed in a table.
Failed Application Access by Users over Time. See the failed accesses by users in the last three days on a line chart.
Outlier in Successful Application Access by User. See the outlier in the successful accesses in the last three days by user ID and count statistics displayed in a table.
Outlier in Failed Application Access by User. See the outlier in the failed accesses in the last three days by user ID and count statistics displayed in a table.
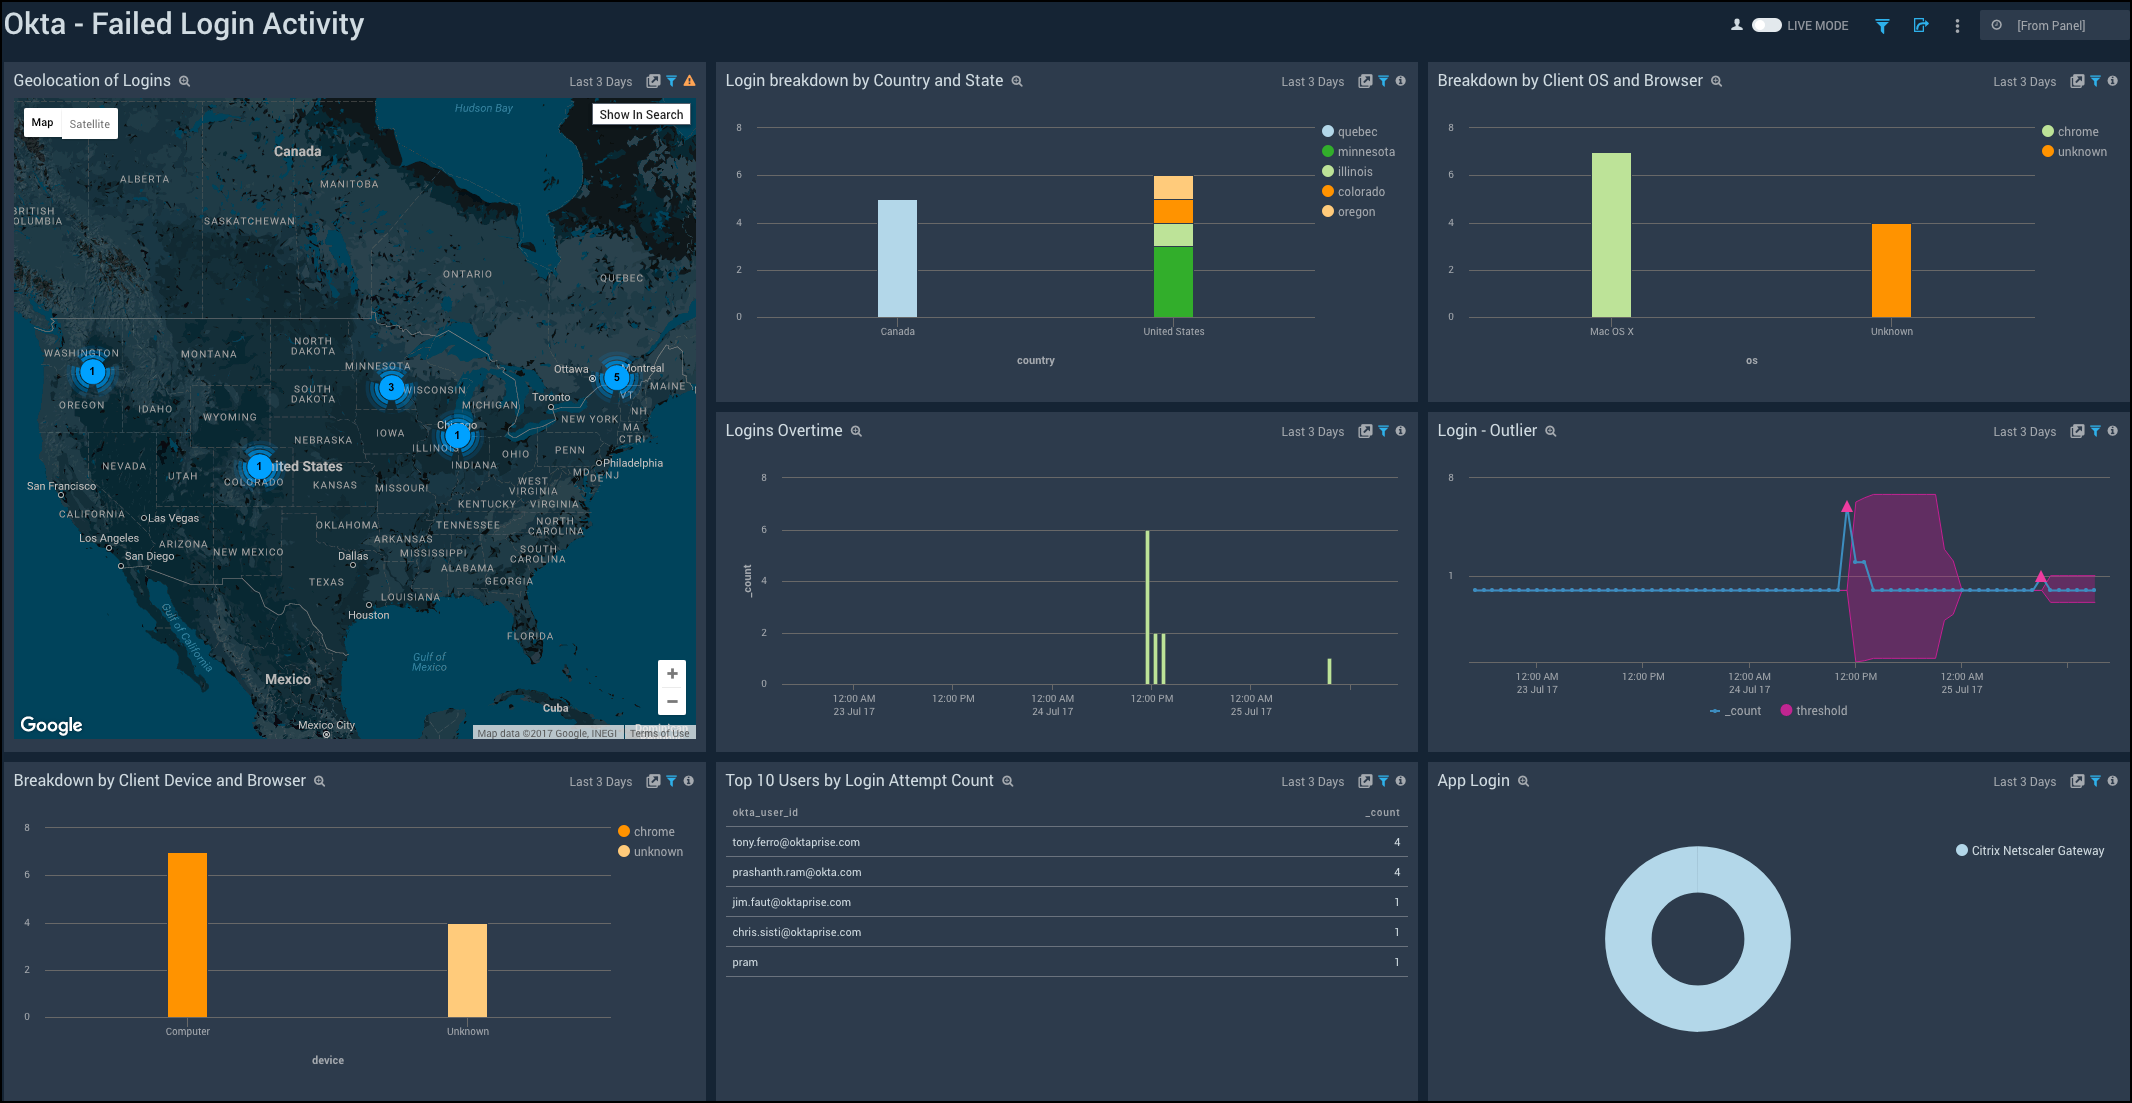
Failed Login Activity
Shows the details of failed logins to Okta such as the geolocation, country, state, OS, browser, device, top 10 users, and application.
Geolocation of Logins. See the number of failed logins across the world on a map for the last three days.
Login breakdown by Country and State. See the count of failed logins broken down by country and state in a stacked column chart on a timeline for the last three days.
Breakdown by Client OS and Browser. See the count of failed logins by browsers broken down by OS in a stacked column chart on a timeline for the last three days.
Logins Overtime. See the count of failed logins over time in the last three days on a column chart.
Login - Outlier. See the failed logins in an outlier chart on a timeline for the last three days.
Breakdown by Client Device and Browser. See the count of failed logins by browsers broken down by devices in a stacked column chart on a timeline for the last three days.
Top 10 Users by Login Attempt Count. See the top 10 users with the count of failed login attempts for the last three days in a table.
App Login. See the breakdown of failed logins by applications for the last three days on a pie chart.
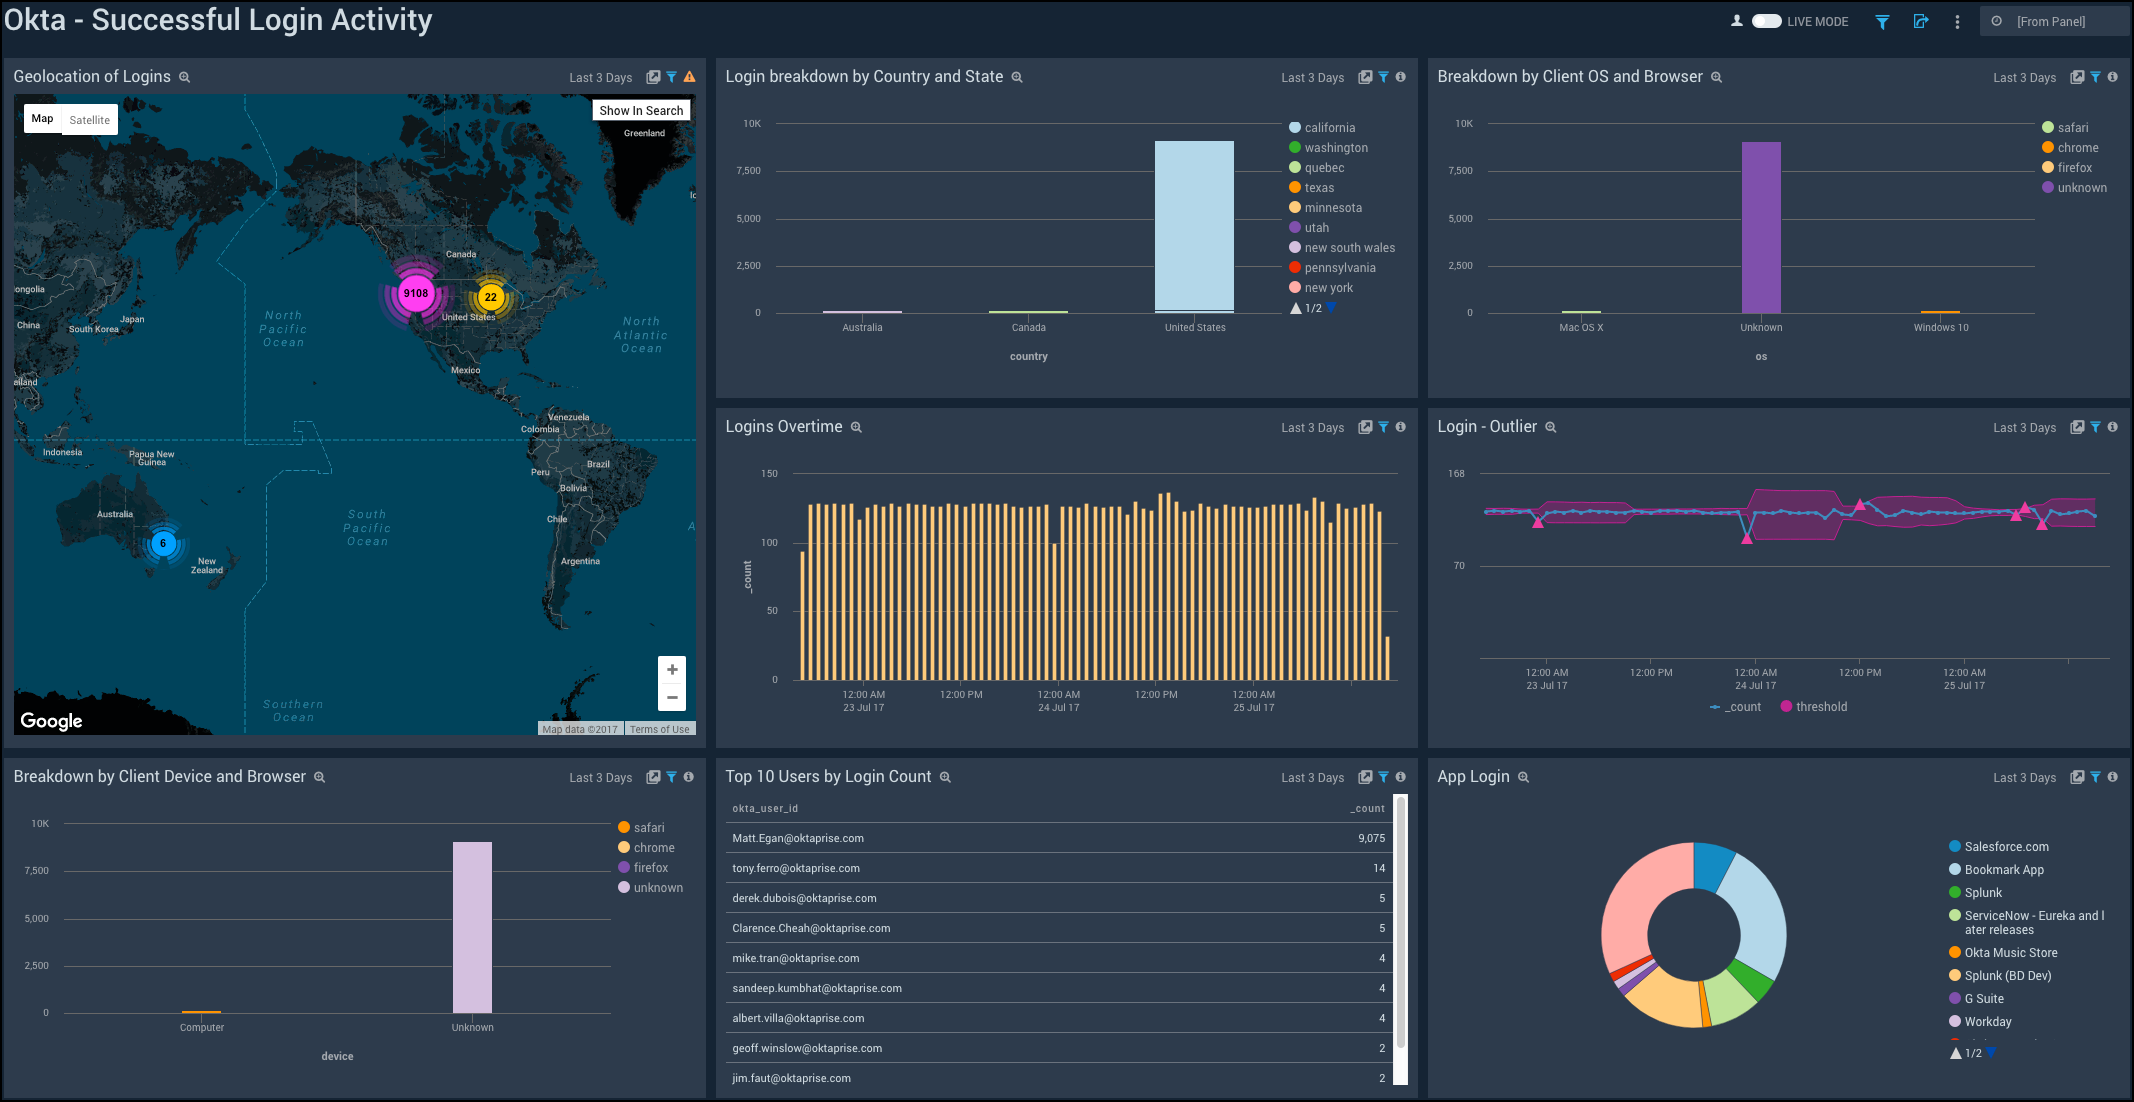
Successful Login Activity
Shows the details of successful logins to Okta such as the device, browser, country, state, OS, geolocation, logins overtime, outlier, top 10 users, and application.
Geolocation of Logins. See the number of successful logins across the world on a map for the last three days.
Login breakdown by Country and State. See the count of successful logins broken down by country and state in a stacked column chart on a timeline for the last three days.
Breakdown by Client OS and Browser. See the count of successful logins by browsers broken down by OS in a stacked column chart on a timeline for the last three days.
Logins Overtime. See the count of successful logins over time in the last three days on a column chart.
Login - Outlier. See the successful logins in an outlier chart on a timeline for the last three days.
Breakdown by Client Device and Browser. See the count of successful logins by browsers broken down by devices in a stacked column chart on a timeline for the last three days.
Top 10 Users by Login Count. See the top 10 users with the count of successful logins for the last three days in a table.
App Login. See the breakdown of successful logins by applications for the last three days on a pie chart.
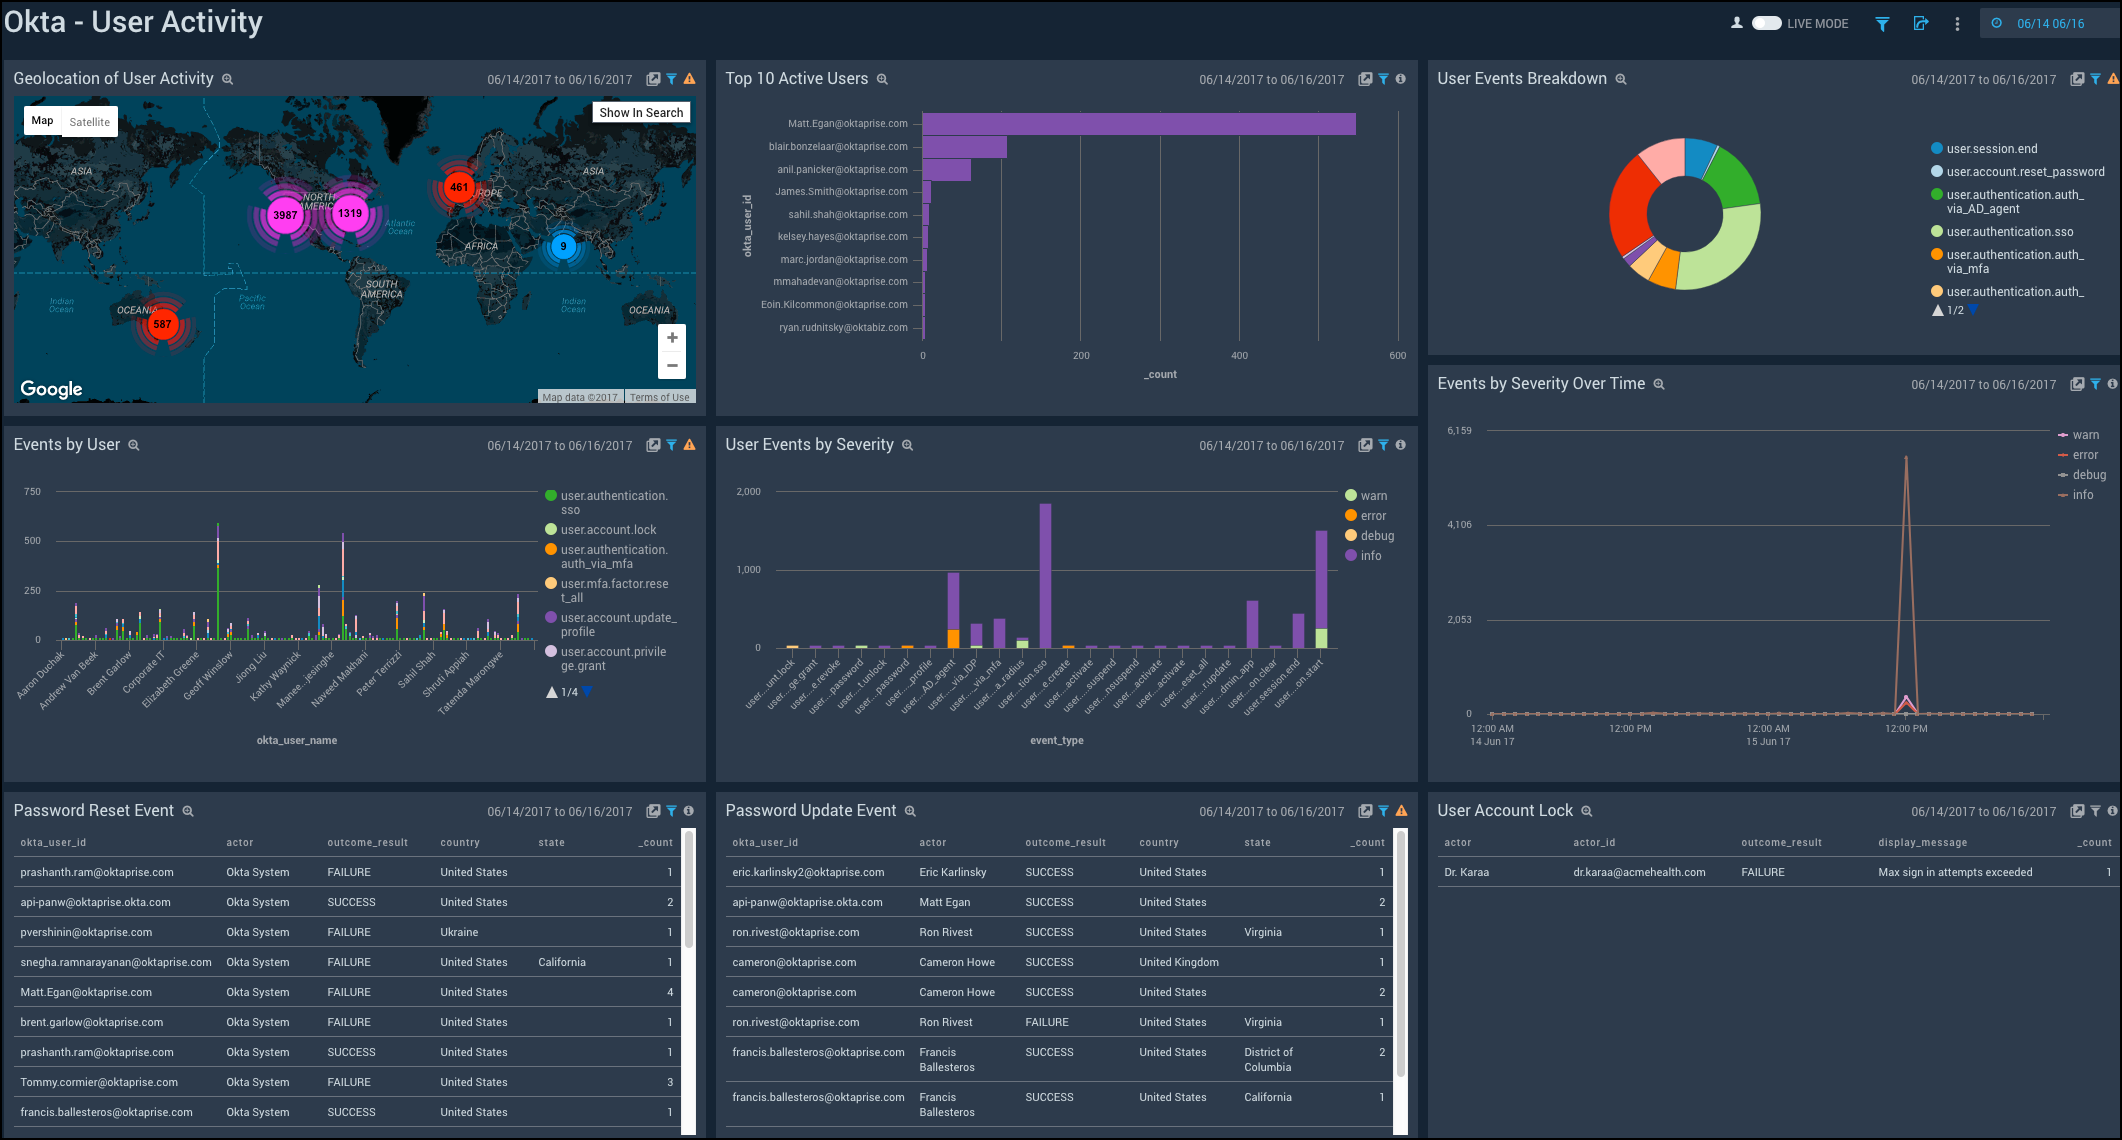
User Activity
Shows the details of user activity such as the geolocation, top 10 users, user events, events by users, events by severity, password resets, password updates, and user account locks.
Geolocation of User Activity. See the number of user activities across the world on a map for the last 24 hours.
Top 10 Active Users. See the top 10 active users in the last 24 hours displayed on a bar chart.
User Events Breakdown. See the breakdown of user events in the last 24 hours on a pie chart.
Events by User. See the count of events per user in the last 24 hours on a column chart.
User Events by Severity. See the count of user events by severity for the last 24 hours on a column chart.
Events by Severity Over Time. See the count of events by severity for the last 24 hours on a line chart.
Password Reset Event. See the details of password reset events such as the username, actor, outcome result, country, state, and count, in the last 24 hours displayed in a table.
Password Update Event. See the details of password update events such as the username, actor, outcome result, country, state, and count, in the last 24 hours displayed in a table.
User Account Lock. See the details of locked user accounts in the last 24 hours such as the actor, actor ID, outcome result, displayed message, and count, shown in a table.
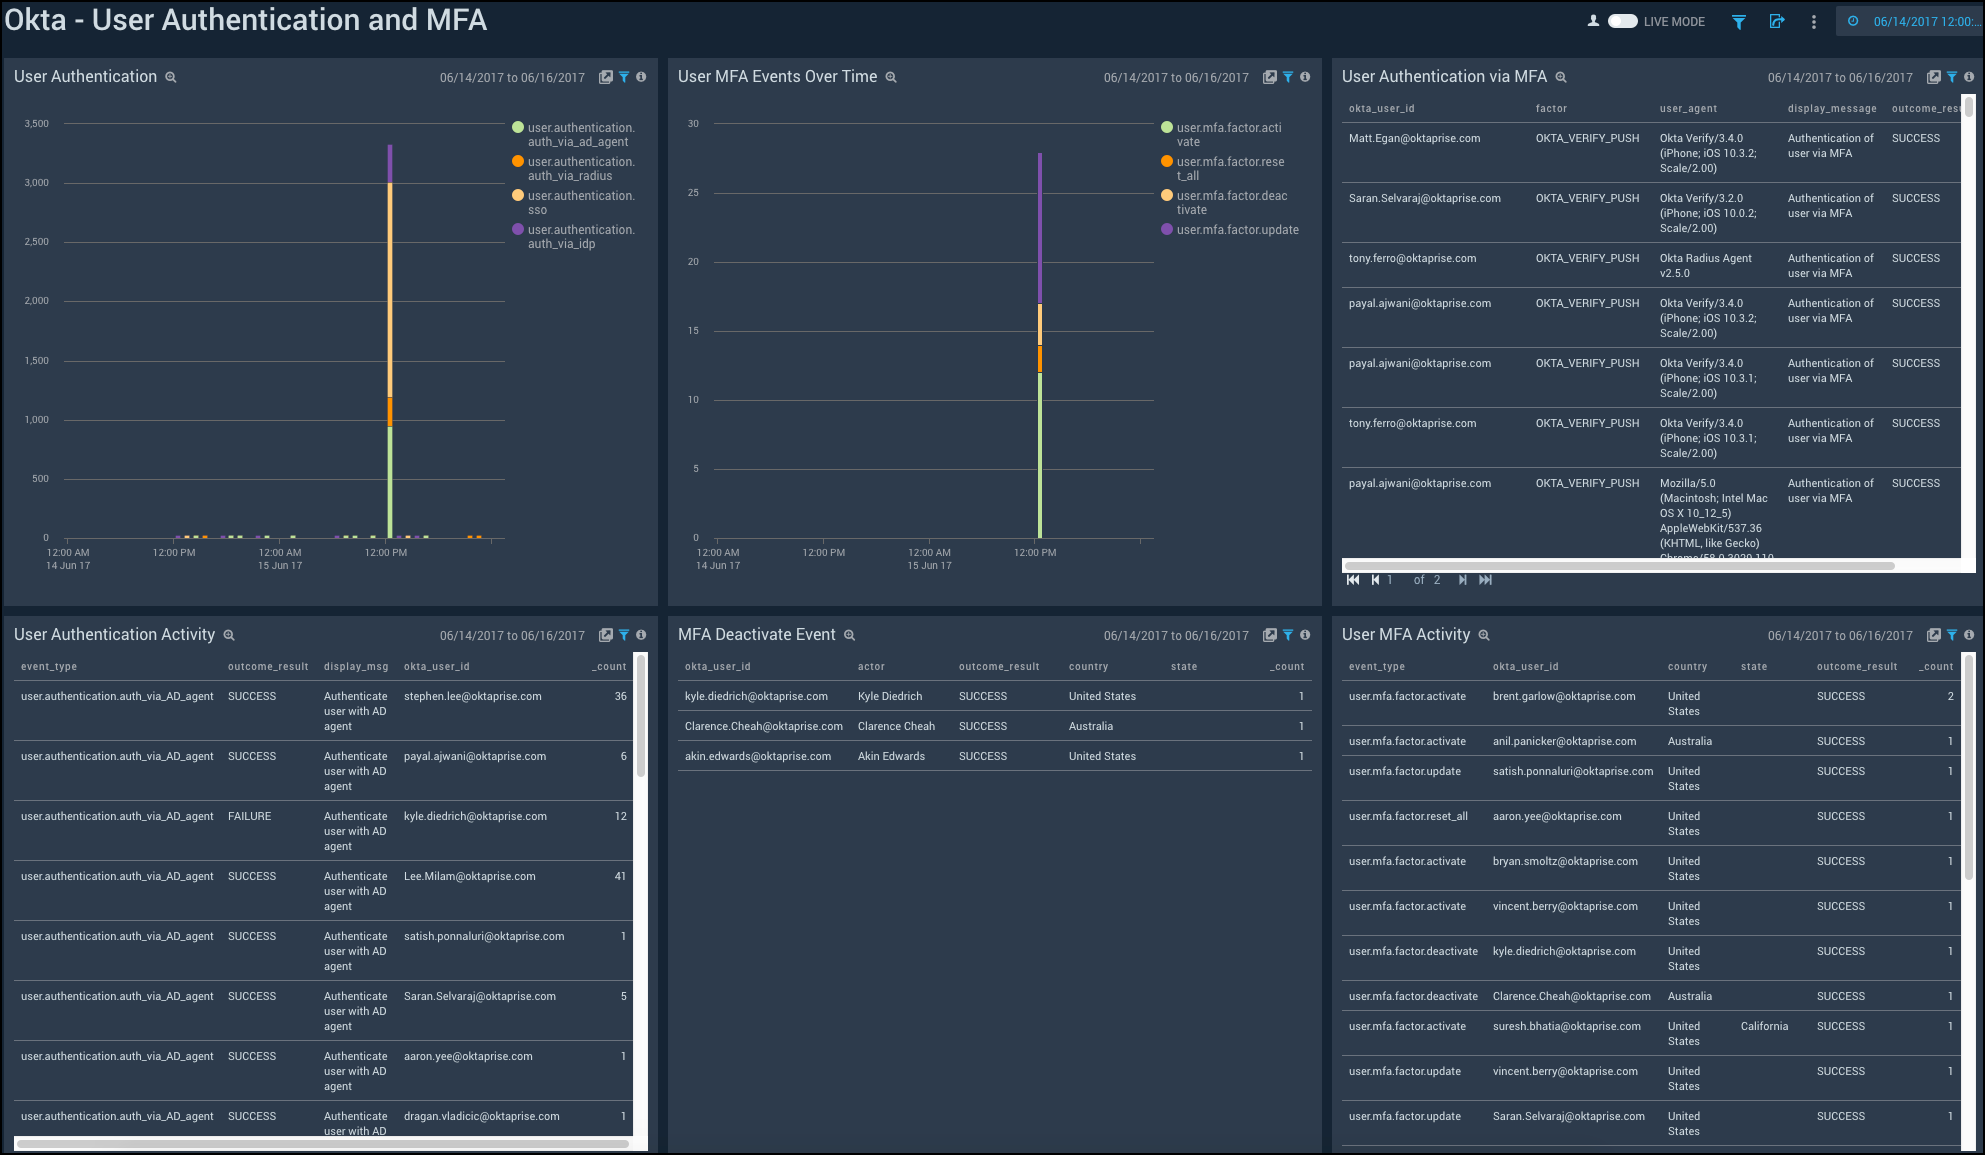
User Authentication and MFA
Shows the details of user authentication and Multi-Factor Authentication (MFA) activities such as the user authentication over time, MFA events, MFA deactivation, and user authentication using MFA.
User Authentication. See the count of user authentication in the last 24 hours on a column chart.
User MFA Events Over Time. See the count of user MFA events in the last 24 hours on a column chart.
User Authentication via MFA. See the details of user authentication using MFA such as the user ID, factor, user agent, display message, outcome result, and count, in the last 24 hours displayed in a table.
User Authentication Activity. See the count of user authentication activities in the last 24 hours on a stacked column chart.
MFA Deactivate Event. See the details of MFA deactivate event in the last 24 hours such as the user ID, actor, outcome result, country, state, and count, shown in a table.
User MFA Activity. See the details of user MFA activities such as the event type, result, reason, user ID, username, and count, in the last 24 hours, displayed in a table.