Heroku

Heroku is a platform that allows you to build cloud-based apps. The Sumo Logic app for Heroku is a logs-only app that allows you to monitor your Heroku environment. Our preconfigured dashboards present information to monitor Heroku infrastructure, applications, metrics, and error scenarios to ensure observability into Heroku and its components.
We offer an add-on for Heroku that fully integrates Sumo Logic log analytics for Heroku users.
Log types
- Heroku’s Logplex logging service makes it easy to collect logs from its applications and forward them to Sumo Logic. We use an HTTPS log drain to send Syslog-formatted messages to an HTTPS endpoint via a POST request.
- The Heroku Labs log-runtime-metrics feature adds experimental support for enabling visibility into load and memory usage for running dynos.
Sample log messages
- A Logplex POST body resembles the following.
83 <40>1 2012-11-30T06:45:29+00:00 host app web.3 - State changed from starting to up
119 <40>1 2012-11-30T06:45:26+00:00 host app web.3 - Starting process with command `bundle exec rackup config.ru -p 24405 - Runtime metric logs have the following format.
335 <134>1 2023-08-24T10:28:47.153192+00:00 host heroku web.1 - source=web.1 dyno=heroku.322071457.63c5abfd-838b-4e2d-bce1-ce46de280675 sample#memory_total=180.43MB sample#memory_rss=180.05MB sample#memory_cache=0.38MB sample#memory_swap=0.00MB sample#memory_pgpgin=84329pages sample#memory_pgpgout=38140pages sample#memory_quota=512.00MB
205 <134>1 2023-08-24T12:31:50.112+00:00 host heroku web.1 - source=web.1 dyno=heroku.319324155.67cc34d0-0440-4106-97b6-d9486f7d9009 sample#load_avg_1m=0.00 sample#load_avg_5m=0.00 sample#load_avg_15m=0.01
Sample queries
Log queries
_sourceCategory="Heroku" "Build Succeeded"
| where _sourceName matches "{{log_drain}}"
| _sourceName as log_drain
| timeslice 5m
| count by log_drain, _timeslice
| transpose row _timeslice column log_drain
Metric log queries
_sourceCategory="Heroku"
| parse regex "dyno=(?<dyno>.*?(?= )).*memory_total=(?<memory_total>.*?(?=MB )).*memory_rss=(?<memory_rss>.*?(?=MB )).*memory_cache=(?<memory_cache>.*?(?=MB )).*memory_swap=(?<memory_swap>.*?(?=MB ))"
| where dyno matches "{{dyno}}" and _sourceName matches "{{log_drain}}"
| timeslice 5m
| avg(memory_total) as memory_total, avg(memory_rss) as resident_memory, avg(memory_cache) as disk_cache_memory, avg(memory_swap) as swap_memory by _timeslice
Collecting logs for Heroku
Heroku is a cloud platform that lets companies build, deliver, monitor, and scale apps in eight programming languages namely Node.js, Ruby, Python, Java, PHP, Go, Scala, and Clojure.
There are two ways to send Heroku logs to Sumo Logic.
- HTTPS Log Drain. A HTTPS Log Drain can be attached to a Heroku application via the CLI. It can be used to send logs to a http logs source for any type of Sumo Logic account as per your requirement. The Sumo Logic Add-on internally wraps this method.
- Sumo Logic Add-on. The Sumo Logic add-on can be attached to a Heroku application via the CLI or the UI. It automatically creates a Sumo Logic free trial account that contains a HTTPS logs source on a Hosted Collector.
We recommended attaching a Heroku add-on just after creating an app or running the heroku create command to help observe Heroku logs for all events that may follow for the app.
Collecting logs via HTTPS Log Drain
A HTTPS Log Drain can be attached to a Heroku application via the CLI.
- Collect the URL of a HTTPs logs source on a hosted collector in any Sumo Logic account.
- Install the Heroku CLI.
- Add an HTTPS drain for an app named myapp:
heroku drains:add <URL> -a myapp
You will now be able to see Heroku logs flowing into that HTTP source in Sumo Logic. You can also attach the same URL to multiple apps for a single log drain.
You can also run heroku drains or heroku drains --json command in your app directory to find the name of an existing Sumo Logic http source log_drain url of an app, which can be attached to a new app.
Collecting logs via Sumo Logic add-on
The Sumo Logic add-on for Heroku helps you to monitor Heroku apps and harness the power of machine data with effortless log management that delivers business and operational insights within minutes.
Provisioning the Sumo Logic add-on via CLI
Provisioning the Sumo Logic add-on via the CLI allows us to monitor a single app as well as multiple apps using the same add-on. It creates a Sumo Logic free trial account for analyzing the Heroku logs. You would first need to install the Heroku CLI. The following sections show how to configure the add-on for Heroku apps.
Monitor a single app
For a single app, run the following command in your app directory.
heroku addons:create sumologic
-----> Adding sumologic to sharp-mountain-4005... done, v18 (free)
Monitor multiple apps
To monitor multiple applications, you can share the same Sumo Logic add-on with multiple applications.
- Provision the add-on for your first application by running the following command in your app directory.
heroku addons:create sumologic
-----> Creating sumologic-test-horizontal-9854... done, (free)
-----> Adding sumologic-test-horizontal-9854... done - Attach the add-on to your additional applications using the name of the add-on returned by the create command. Then run the following command in your app directory.
heroku addons:attach sumologic-test-horizontal-9854
-----> Attaching sumologic-test-horizontal-9854... donenoteYou can also run
heroku drainsorheroku drains --jsoncommand in your app directory to find the name of an existing Sumo Logic add-on of an app which can be attached to a new app. - Run the following command in your app directory to access Sumo Logic.
heroku addons:open sumologic
Opening sumologic for sharp-mountain-4005
This opens up a Sumo Logic free trial account. Fill up the Sumo Logic onboarding form with the relevant details and click on Get Started to use Sumo Logic. The Sumo Logic add-on for Heroku sets the value of _sourceCategory for your Heroku log data to heroku. It is recommended to use a single add-on for multiple applications.
Provisioning the Sumo Logic add-on via the UI
Provisioning the Sumo Logic add-on via the UI allows us to monitor a single app. The steps to do so are as follows:
- Sign in to your Heroku Dashboard to view information about your apps.
- Click on an app to view an in-depth page about the app, which also shows all the Installed add-ons in the Overview tab.
- Click on the Configure Add-ons and then search for Sumo Logic.
- Click on the Sumo Logic add-on to open up a add-on order form.
- Choose the Plan name and click on the Submit Order Form button.
You will now be able to see the Sumo Logic add-on in the Installed add-ons section of your app's Overview tab. Clicking on that add-on redirects you to open up a Sumo Logic free trial account, with a limited feature set, a daily data volume limit of 500MB per day, and 7 days of data retention. Fill up the Sumo Logic onboarding form with the relevant details and click on Get Started to use Sumo Logic. The Sumo Logic add-on for Heroku sets the value of _sourceCategory for your Heroku log data to heroku. Your application logs are automatically forwarded to this account. To monitor multiple applications, you can share the same Sumo Logic add-on with multiple applications.
There are two places you can access the Sumo Logic add-on for Heroku: from the Heroku application panel and the Sumo Logic UI, where you'll see a new Heroku navigation bar above the Sumo Logic main navigation bar. Otherwise, there are no other changes to Sumo Logic.
Limitations
Heroku users can use all Sumo Logic features associated with their account type, with a few exceptions.
All Heroku add-on user accounts are created as Sumo Logic administrators, but no user information or roles can be added or edited in Sumo. You can only log into Sumo Logic from the Heroku application panel. For this reason, you cannot change your password once your account is created, and as required by Heroku, you cannot log out of Sumo Logic once you have installed the add-on.
In addition, the following features are not supported:
- Allowlisting IP addresses
- Password Policies
- SAML
Heroku Support
All Sumo Logic add-on for Heroku support questions should be submitted to a Heroku Support Channel.
Collecting Metric Logs for Heroku
The Heroku Labs log-runtime-metrics feature adds experimental support for enabling visibility into load and memory usage for running dynos. Per-dyno stats on memory use, swap use, and load average are inserted into the app’s log stream where they can be seen via heroku logs --tail, used for graphs or alerting via an add-on which consumes app logs, or sent to a log drain. There is no cost incurred by enabling this feature.
Follow these steps to collect metric logs for an app.
- Attach a log drain to the app. You can either attach a Sumo Logic add-on or a HTTPS log drain as explained in the Collecting Logs for Heroku section.
- Enable the log-runtime-metrics.
heroku labs:enable log-runtime-metrics --app example-app
Enabling log-runtime-metrics for example-app... done
heroku restart
The metric logs will start flowing into the Sumo Logic endpoint attached to your app. The load and memory usage metrics are surfaced as system logs in the Logplex log stream. Metrics are emitted for each running dyno, at an approximate frequency of once every 20 seconds.
Run the following command to disable this feature.
heroku labs:disable log-runtime-metrics --app example-app
Disabling log-runtime-metrics for example-app... done
heroku restart
(Optional) Set up field extraction rules for applications
This step is optional, but recommended, as it makes easier for you to query your Heroku application logs in Sumo Logic. When Sumo Logic ingests Heroku application logs, it attaches the _sourceName metadata field to the the data. The _sourceName Sumo Logic assigns varies by application—its value is the unique identifier for the Logplex drain assigned to the application.
For ease of understanding the log data, you can use a Field Extraction Rule (FER) to rename _sourceName from the drain UUID to the application name. For general information about FERs, refer to the Create a Field Extraction Rule.
- Determine the drain identifier by running the
heroku drainscommand for your app. The identifier will look something like:d.98ee476d-d2d8-46bf-afc2-740f6f7e5b2a - Define an FER in Sumo Logic.
-
In the main Sumo Logic menu, select Manage Data > Logs > Field Extraction Rules.
-
Click the + in the upper left corner of the page to display the Create Field Extraction Rule popup.
- Rule Name. Enter a name for the FER.
- Scope. Enter
_sourceCategory=herokuwhen the collection is setup via the Sumo Add-on. - Parse Expression. For each Heroku application reporting data to Sumo, enter a statement that renames the
_sourceNamefrom the drain ID to the application name. For example:
if (_sourceName="Drain_ID", "Application_Name", _sourceName) as _sourceNameThe FER below changes the value of
_sourceNamefor two applications. The first line changes_sourceNamefrom “d.98ee476d-d2d8-46bf-afc2-740f6f7e5b2a” to “CustApp”. The second line changes_sourceNamefrom “d.00870f28-53f9-4680-b2ab-2287ec9d8637” to “VendorApp”:if (_sourceName="d.98ee476d-d2d8-46bf-afc2-740f6f7e5b2a", "CustApp", _sourceName) as _sourceName
| if (_sourceName="d.00870f28-53f9-4680-b2ab-2287ec9d8637", "VendorApp", _sourceName) as _sourceName
-
- Click Add to save the rule.
These custom app _sourceNames will appear as values in the dashboard filter variable log_drain for the Heroku app dashboards.
Installing the Heroku app
To install the app, do the following:
- Select App Catalog.
- In the 🔎 Search Apps field, run a search for your desired app, then select it.
- Click Install App.
note
Sometimes this button says Add Integration.
- Click Next in the Setup Data section.
- In the Configure section of your respective app, complete the following fields.
- Key. Select either of these options for the data source.
- Choose Source Category and select a source category from the list for Default Value.
- Choose Custom, and enter a custom metadata field. Insert its value in Default Value.
- Key. Select either of these options for the data source.
- Click Next. You will be redirected to the Preview & Done section.
Post-installation
Once your app is installed, it will appear in your Installed Apps folder, and dashboard panels will start to fill automatically.
Each panel slowly fills with data matching the time range query and received since the panel was created. Results will not immediately be available, but will update with full graphs and charts over time.
Upgrading the Heroku app (Optional)
To update the app, do the following:
- Select App Catalog.
- In the Search Apps field, search for and then select your app.
Optionally, you can identify apps that can be upgraded in the Upgrade available section. - To upgrade the app, click Upgrade.
- If the upgrade does not have any configuration or property changes, you will be redirected to the Preview & Done section.
- If the upgrade has any configuration or property changes, you will be redirected to Setup Data page.
- In the Configure section of your respective app, complete the following fields.
- Key. Select either of these options for the data source.
- Choose Source Category and select a source category from the list for Default Value.
- Choose Custom and enter a custom metadata field. Insert its value in Default Value.
- Key. Select either of these options for the data source.
- Click Next. You will be redirected to the Preview & Done section.
- In the Configure section of your respective app, complete the following fields.
Post-update
Your upgraded app will be installed in the Installed Apps folder, and dashboard panels will start to fill automatically.
See our Release Notes changelog for new updates in the app.
Uninstalling the Heroku app (Optional)
To uninstall the app, do the following:
- Select App Catalog.
- In the 🔎 Search Apps field, run a search for your desired app, then select it.
- Click Uninstall.
While using the Sumo Add-on, the value _sourceCategory=heroku should be used while installing the app.
Viewing Heroku Dashboards
All dashboards have a set of filters that you can apply to the entire dashboard. Use these filters to drill down and examine the data to a granular level.
- You can change the time range for a dashboard or panel by selecting a predefined interval from a drop-down list, choosing a recently used time range, or specifying custom dates and times. Learn more.
- You can use template variables to drill down and examine the data on a granular level. For more information, see Filter with template variables.
- Most Next-Gen apps allow you to provide the scope at the installation time and are comprised of a key (
_sourceCategoryby default) and a default value for this key. Based on your input, the app dashboards will be parameterized with a dashboard variable, allowing you to change the dataset queried by all panels. This eliminates the need to create multiple copies of the same dashboard with different queries.
Overview
The Heroku - Overview dashboard demonstrates the use cases for Heroku request timings, response latencies, dyno, and error overviews. It also showscases their daily trends. This dashboard has two filter variables namely, log_drain and application_name.
-
log_drain. Denotes the drain identifier Heroku attaches with the
_sourceNamemetadata while ingesting Heroku logs. It works on all panels of the dashboard. -
application_name. Denotes an application name from the Heroku platform. It works on all panels of the dashboard except the Errors Overview panels, the Dyno Load Average(15 min) panel and the Dyno Memory(MB) panel.
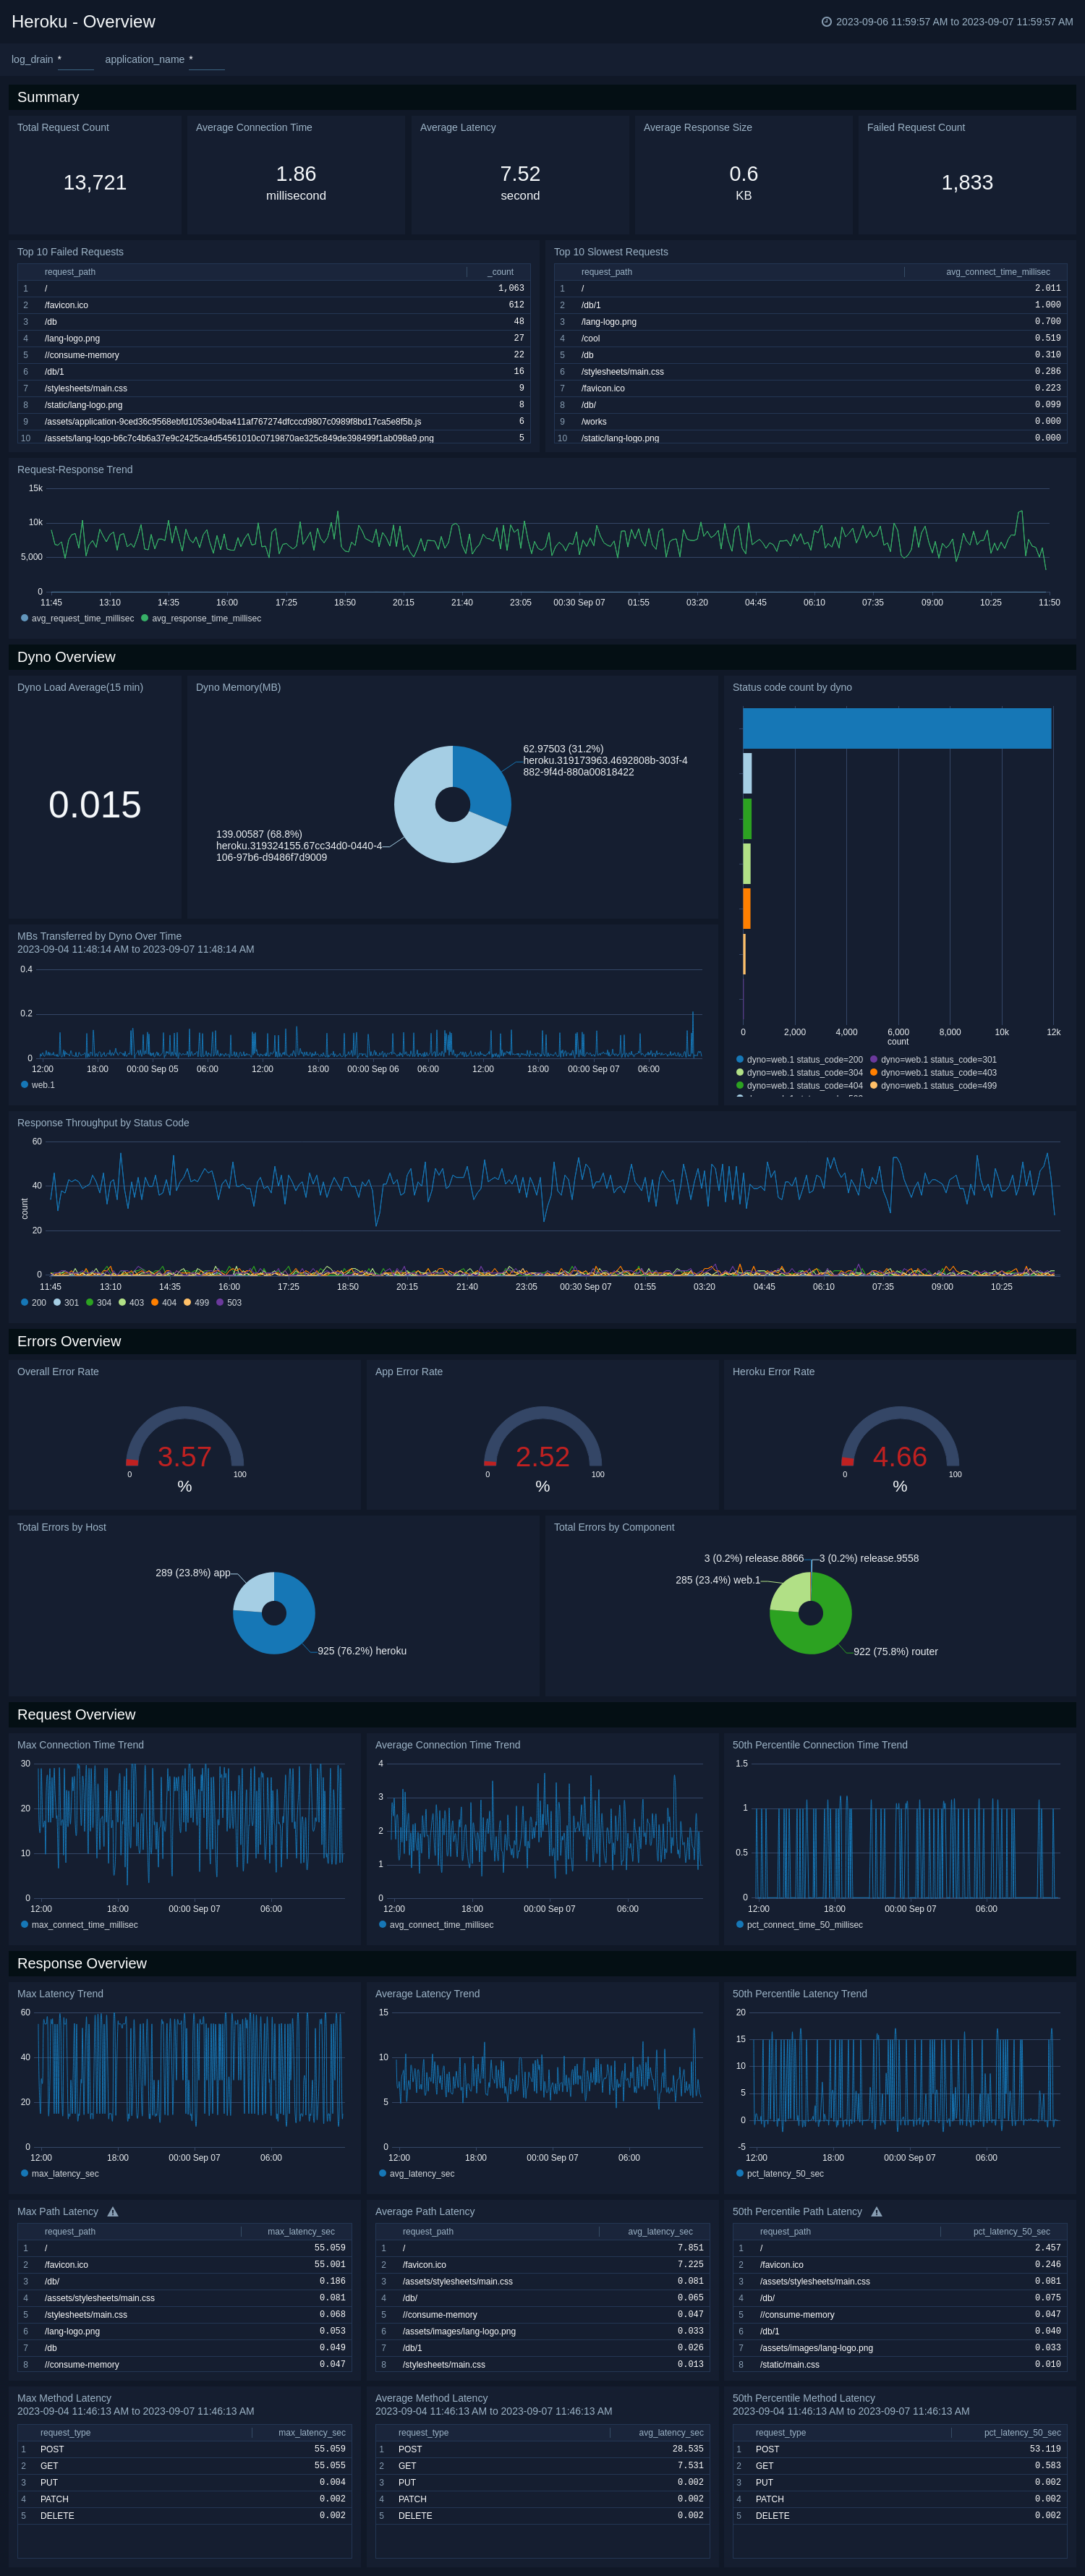
- Total Request Count. Shows the number of unique requests from a client to a Heroku app backend.
- Average Connection Time. Shows the average time in milliseconds spent establishing a connection to a backend web process.
- Average Latency. Shows the average time in seconds spent proxying data between a backend web process and a client.
- Average Response Size. Shows the average number of bytes transferred from a backend web process to a client
- Failed Request Count. Shows the number of requests to a Heroku app backend which returned a non 200 response code.
- Top 10 Failed Requests. Shows the 10 most request paths which returned a non 200 response code.
- Top 10 Slowest Requests. Shows the 10 slowest request paths based on their average connection time.
- Request-Response Trend. Shows the average request and response time distribution over a period of time.
- Dyno Load Average(15 min). Shows the average load returned by each dyno in the last 15 minutes.
- Dyno Memory(MB). Shows the average total memory used by each dyno.
- Status code count by Dyno. Shows the list and count of each status code returned by each dyno response.
- MBs Transferred by Dyno Over Time. Shows the total load trend returned by each dyno.
- Response Throughput by Status Code. Shows the response throughput by various status codes over a period of time.
- Total Errors by Host. Shows the distribution of errors returned either by Heroku or application infrastructure.
- Overall/App/Heroku Error Rate. Shows the error generation percentage of all/app/heroku platform components.
- Total Errors by Component. Shows the distribution of errors returned by different Heroku infrastructure components.
- Max/Average/50th Percentile Connect Time Trend. Shows the maximum, average, and the 50th percentile average connection time trend for Heroku app requests.
- Max/Average/50th Percentile Latency Trend. Shows the maximum, average, and the 50th percentile average service time latency trend for Heroku app responses.
- Max/Average/50th Percentile Path Latency. Shows the maximum, average, and the 50th percentile average service time latency for Heroku app request paths.
- Max/Average/50th Percentile Method Latency. Shows the maximum, average, and the 50th percentile average service time latency for Heroku app request methods.
Dyno
This Heroku - Dyno demonstrates the use cases for successful, completed, and crashed Heroku dyno launches, providing information about their daily trends. Also, it has information on dyno stops, restarts, and scaling operations. This dashboard has a single filter variable namely, log_drain.
- log_drain. Denotes the drain identifier Heroku attaches with the
_sourceNamemetadata while ingesting Heroku logs. It works on all panels of the dashboard.
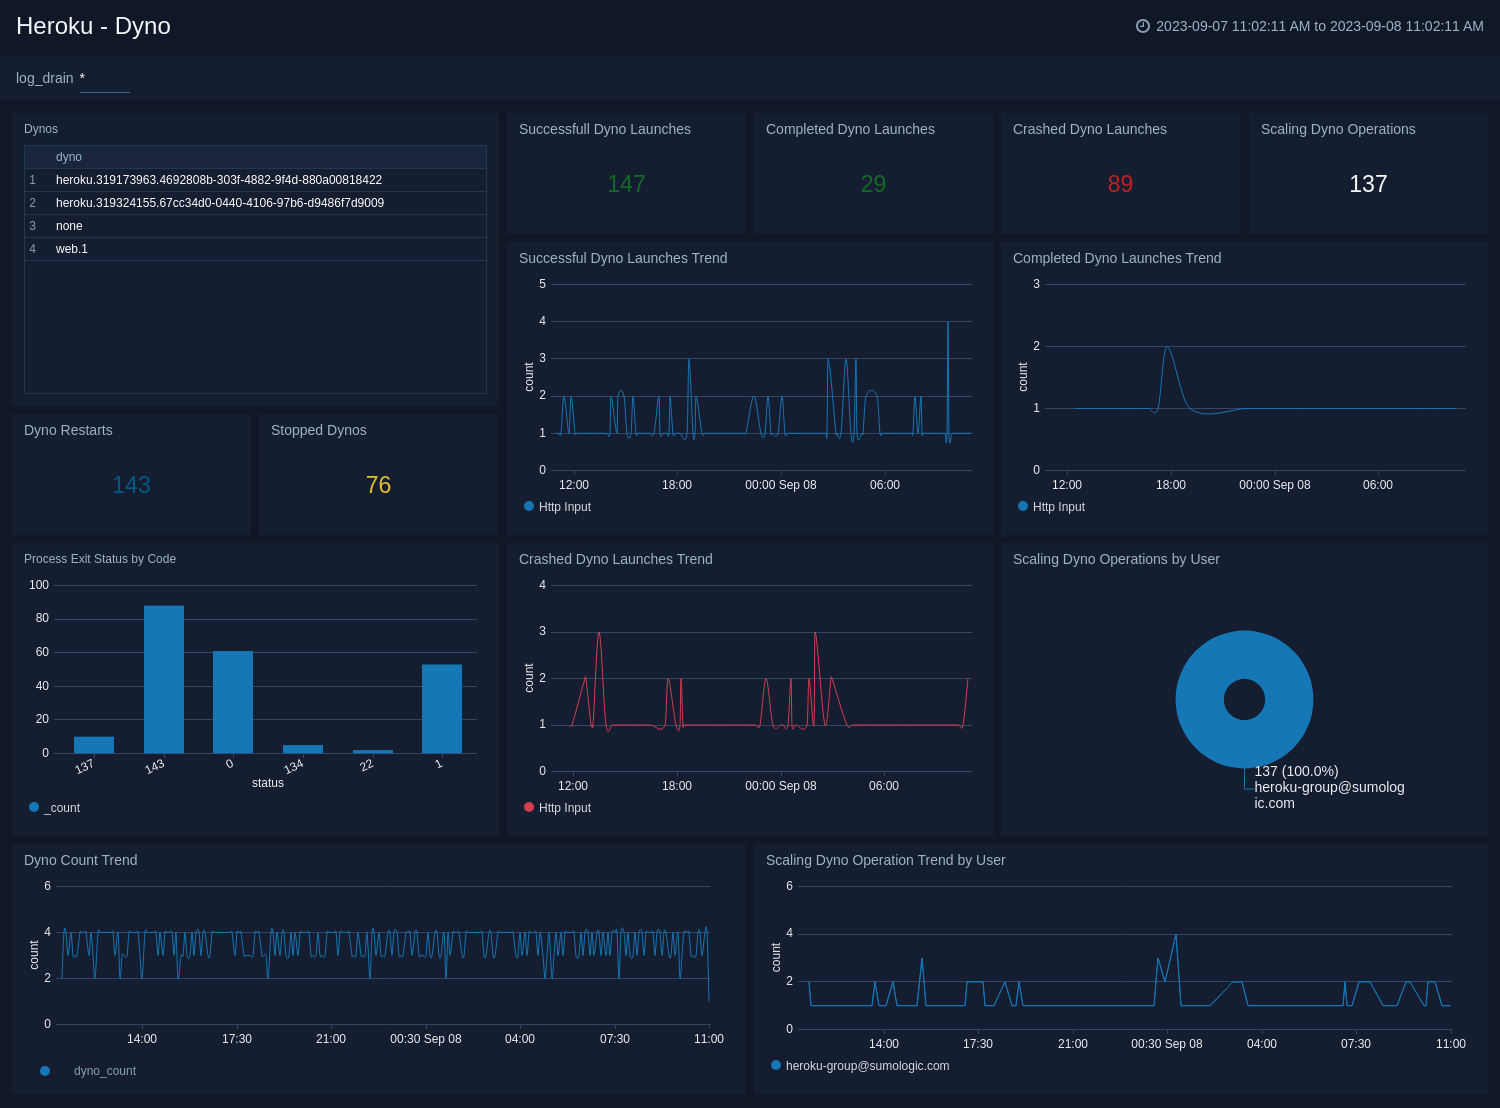
- Dynos. Shows the list the current running dynos.
- Successful Dyno Launches. Shows the count of dynos that have successfully started and are now running in a healthy state.
- Completed Dyno Launches. Shows the count of dynos that have finished executing their designated tasks or commands and have now terminated.
- Crashed Dyno Launches. Shows the count of dynos that have crashed and their applications are no longer able to handle incoming requests and are temporarily unavailable.
- Scaling Dyno Operations. Shows the count of scraling dyno operations performed by application owners.
- Dyno Restarts. Shows the count of dyno restarts.
- Stopped Dynos. Shows the count of stopped dynos.
- Process Exit Status by Code. Shows the process exit status codes for various dyno operations
- Dyno Count Trend. Shows the count of dynos used in Heroku over a period of time.
- Successful/Completed/Crashed Dyno Launches Trend. Shows the count of successful/completed/crashed dynos over a period of time.
- Scaling Dyno Operations by User. Shows the distribution of scraling dyno operations performed by application owners.
- Scaling Dyno Operation Trend by User. Shows the count of scraling dyno operations performed by application owners over a period of time.
Application
The Heroku - Application dashboard demonstrates the use cases for Heroku app builds, providing information about their success and failure trends. Also, it has information on app deployments and releases. This dashboard has a single filter variable namely, log_drain.
- log_drain. Denotes the drain identifier Heroku attaches with the
_sourceNamemetadata while ingesting Heroku logs. It works on all panels of the dashboard.
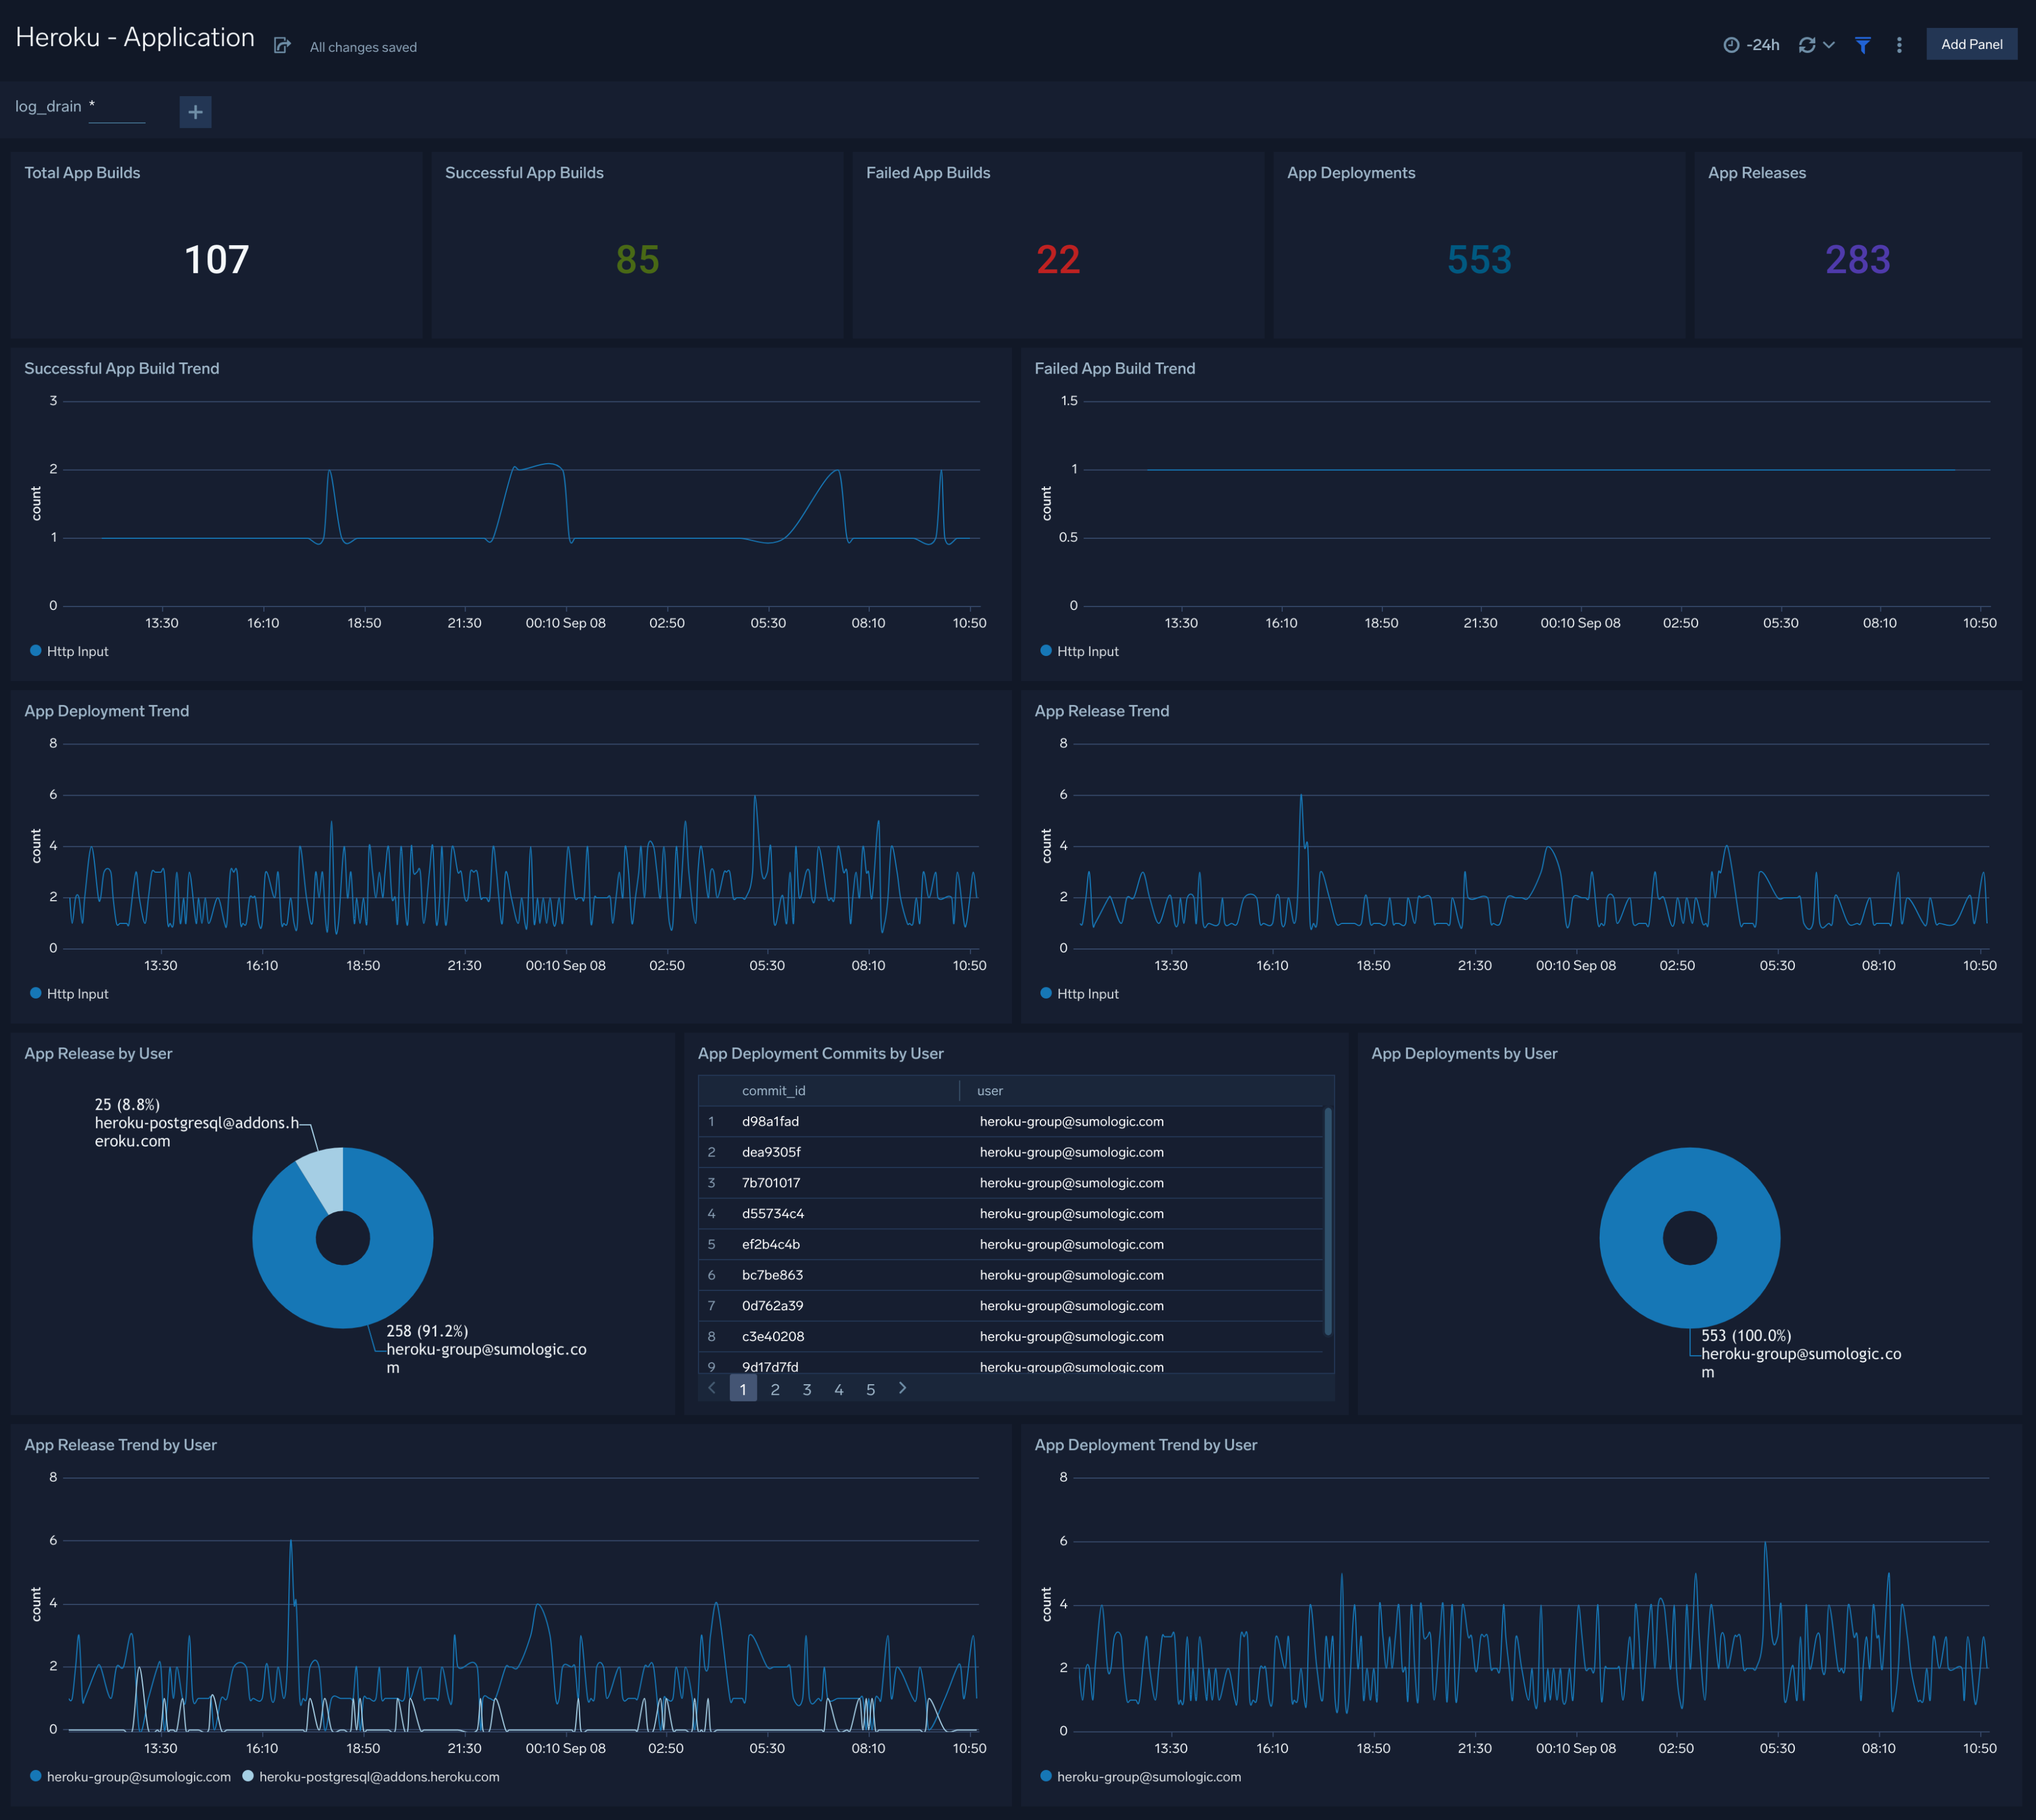
- Total App Builds. Shows the count of total application builds in Heroku.
- Successful App Builds. Shows the count of successful application builds in Heroku.
- Failed App Builds. Shows the count of failed application builds in Heroku.
- App Deployments. Shows the count of application deployments initiated in Heroku.
- App Releases. Shows the count of application releases created in Heroku.
- Successful/Failed App Build Trend. Shows the count of successful/failed application builds in Heroku over a period of time.
- App Deployment/Release Trend. Shows the count of application deployments/releases created in Heroku over a period of time.
- App Deployments/Releases by User. Shows the distribution of application deployments/releases created by application owners in Heroku.
- App Deployment/Release Trend by User. Shows the count of application deployments/releases created by application owners in Heroku over a period of time.
- App Deployment Commits by User. Shows the list of commit ids created by application owners for application deployments in Heroku.
Memory Metrics
The Heroku - Memory Metrics dashboard demonstrates the use cases for the metrics which are reported for memory consumption and swap. This dashboard has two filter variables namely, dyno and log_drain.
-
dyno. Denotes the name of dynos present in the Heroku applications. It works on all panels of the dashboard.
-
log_drain. Denotes the drain identifier Heroku attaches with the
_sourceNamemetadata while ingesting Heroku logs. It works on all panels of the dashboard.
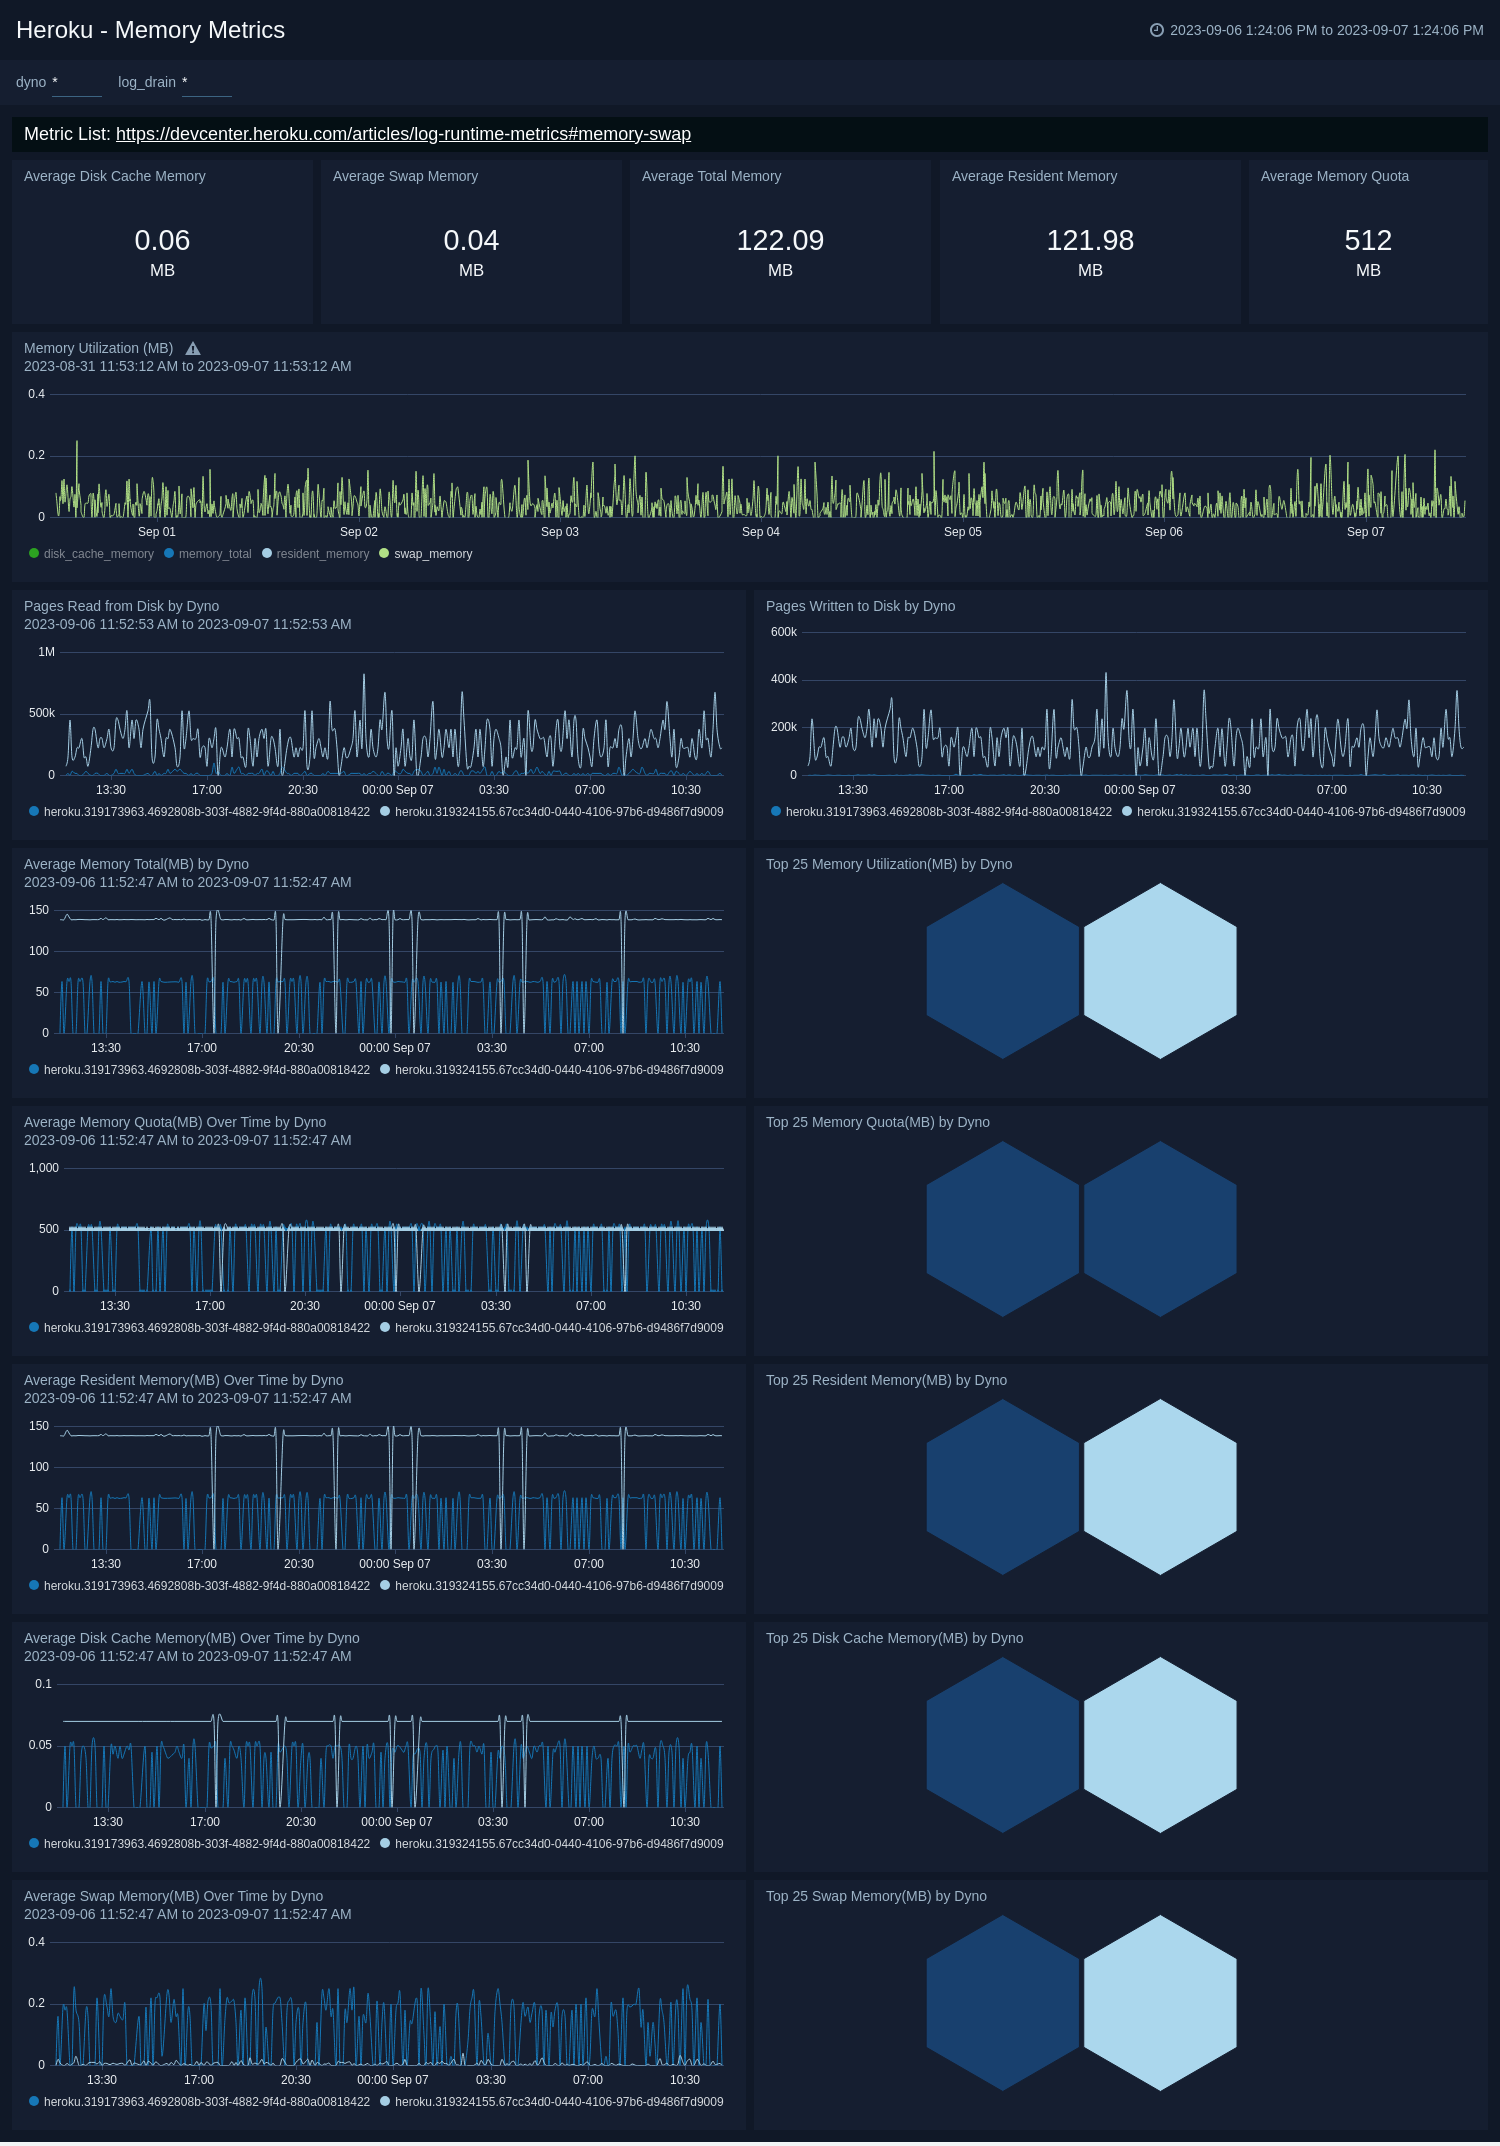
- Resident Memory (memory_rss). The portion of the dyno’s memory (megabytes) held in RAM.
- Disk Cache Memory (memory_cache). The portion of the dyno’s memory (megabytes) used as disk cache.
- Swap Memory (memory_swap). The portion of a dyno’s memory, in megabytes, stored on disk. It’s normal for an app to use a few megabytes of swap per dyno. Higher levels of swap usage though may indicate too much memory usage when compared to the dyno size. This can lead to slow response times and should be avoided.
- Total Memory (memory_total). The total memory (megabytes) being used by the dyno, equal to the sum of resident, cache, and swap memory.
- Memory Quota (memory_quota). The resident memory (memory_rss) value (megabytes) at which an R14 is triggered.
- Pages Written to Disk (memory_pgpgout). The cumulative total of the pages written to disk. Sudden high variations on this number can indicate short duration spikes in swap usage. The other memory related metrics are point in time snapshots and can miss short spikes.
- Pages Read from Disk (memory_pgpgin). The cumulative total of the pages read from disk. As with the previous metric, watch out for sudden variations.
CPU Load Metrics
The Heroku - CPU Load Metrics dashboard demonstrates the use cases for the metrics which are reported for CPU load average. This dashboard has two filter variables namely, dyno and log_drain.
-
dyno. Denotes the name of dynos present in the Heroku applications. It works on all panels of the dashboard.
-
log_drain. denotes the drain identifier Heroku attaches with the
_sourceNamemetadata while ingesting Heroku logs. It works on all panels of the dashboard.
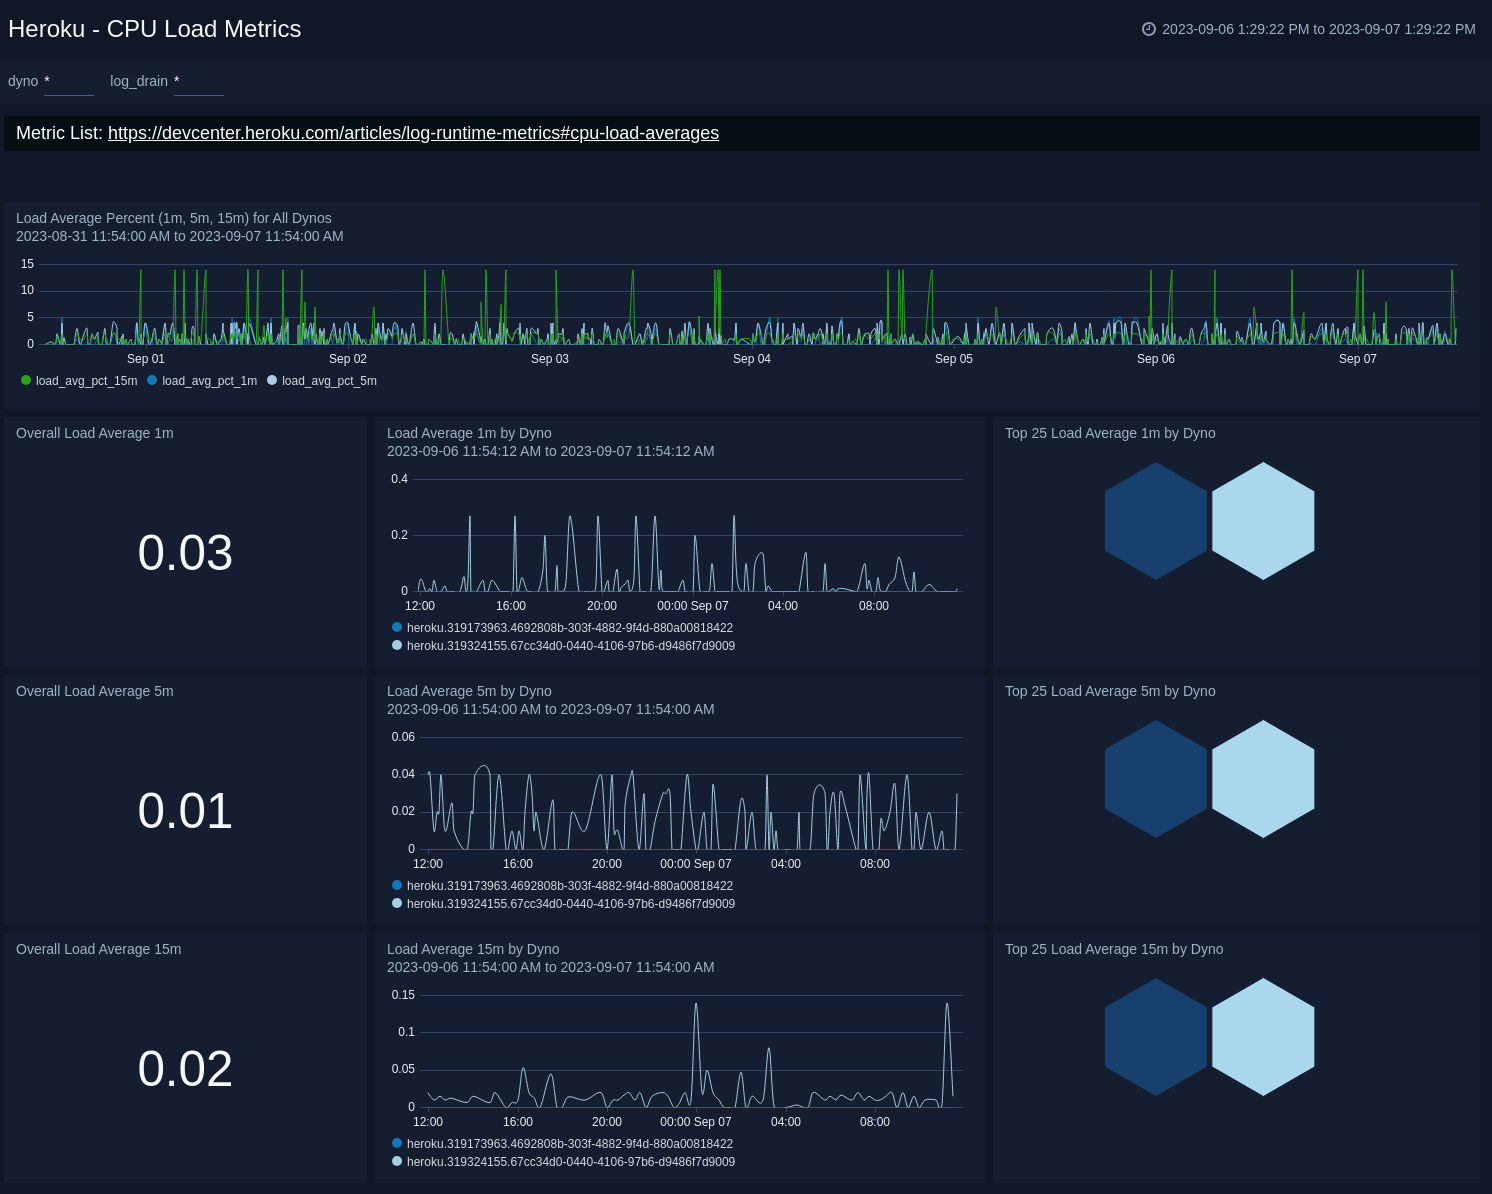
- Load Average 1m (load_avg_1m). The load average for the dyno in the last 1 minute. This reflects the number of CPU tasks that are in the ready queue or waiting to be processed.
- Load Average 5m (load_avg_5m). The load average for the dyno in the last 5 minutes. Computed in the same manner as 1m load average.
- Load Average 15m (load_avg_15m). The load average for the dyno in the last 15 minutes. Computed in the same manner as 1m load average.
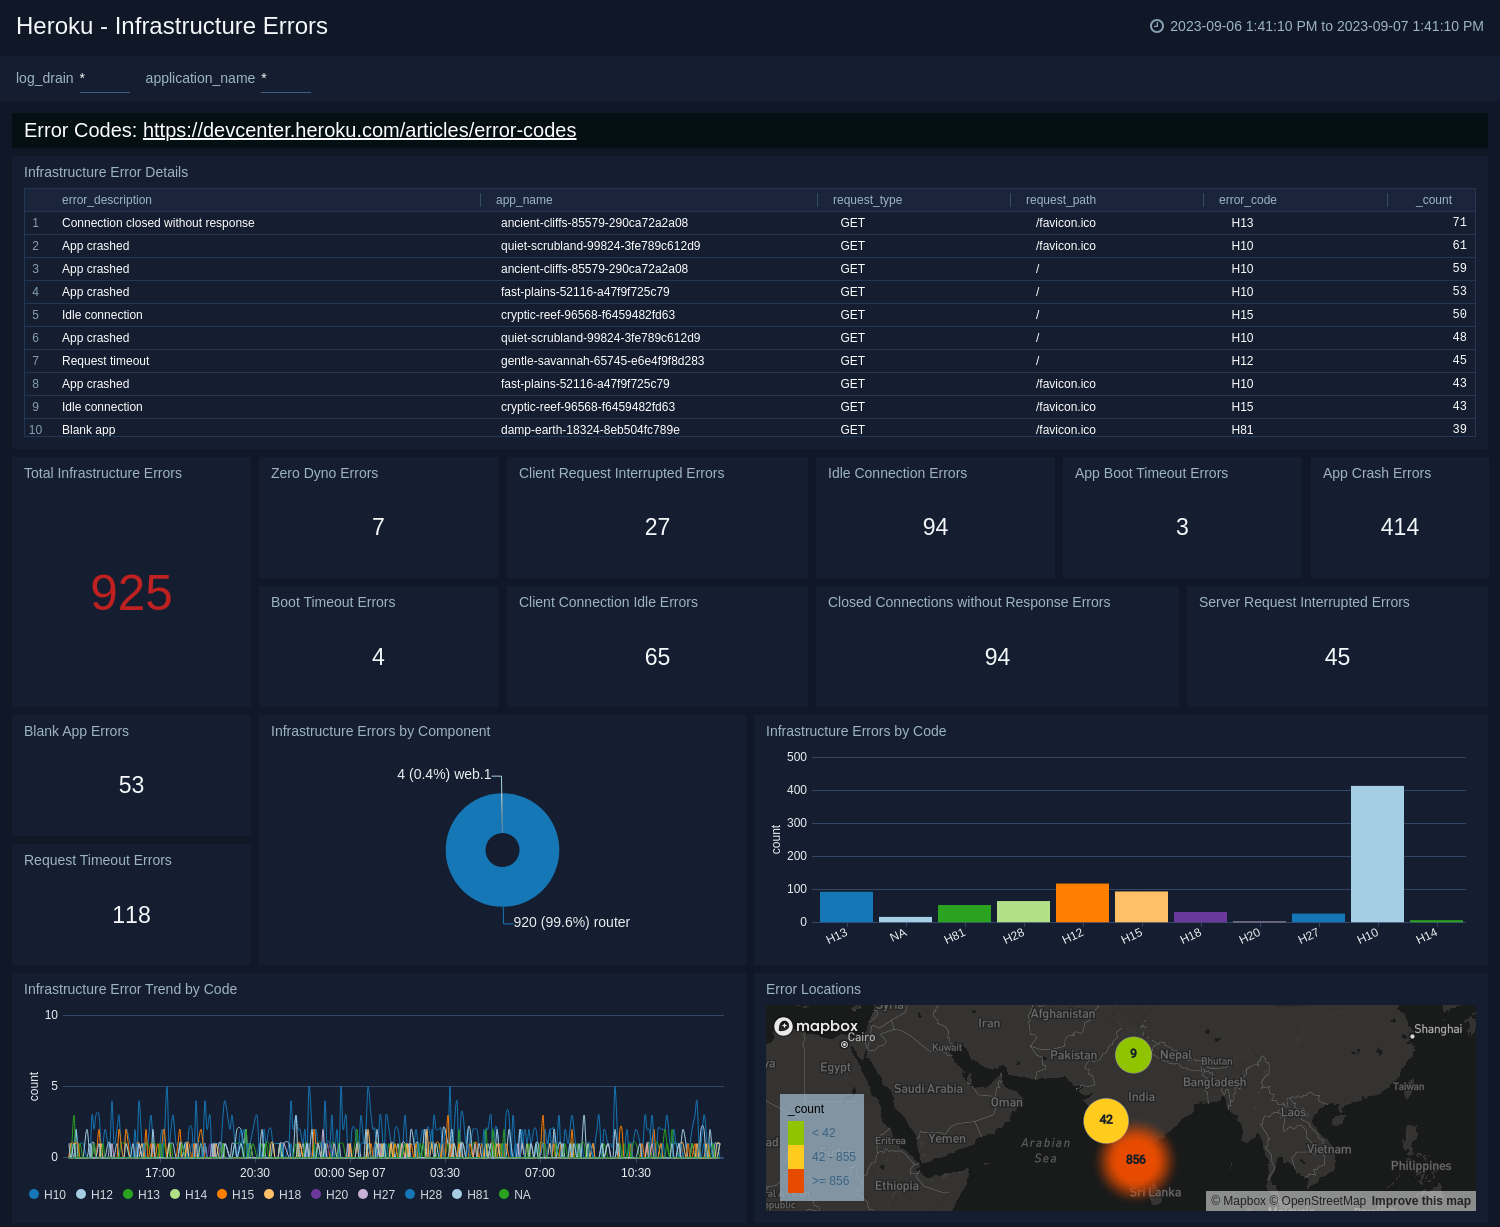
Infrastructure Errors
The Heroku - Infrastructure Errors dashboard demonstrates the use cases for Heroku infrastructure errors, providing information about different types of errors and other observations. It also shows the trends of these Heroku infrastructure errors. This dashboard has two filter variables namely, log_drain and application_name.
-
log_drain. Denotes the drain identifier Heroku attaches with the
_sourceNamemetadata while ingesting Heroku logs. It works on all panels of the dashboard. -
application_name. Denotes an application name from the Heroku platform. It works on all panels of the dashboard.
The panels of this dashboard try to cover a few error cases from the list of errors present here.
Application Errors
The Heroku - Application Errors dashboard demonstrates the use cases for Heroku app errors, providing information about different types of errors and other observations. It also the trends of these Heroku app errors. This dashboard has a single filter variable namely, log_drain.
- log_drain. Denotes the drain identifier Heroku attaches with the
_sourceNamemetadata while ingesting Heroku logs. It works on all panels of the dashboard.
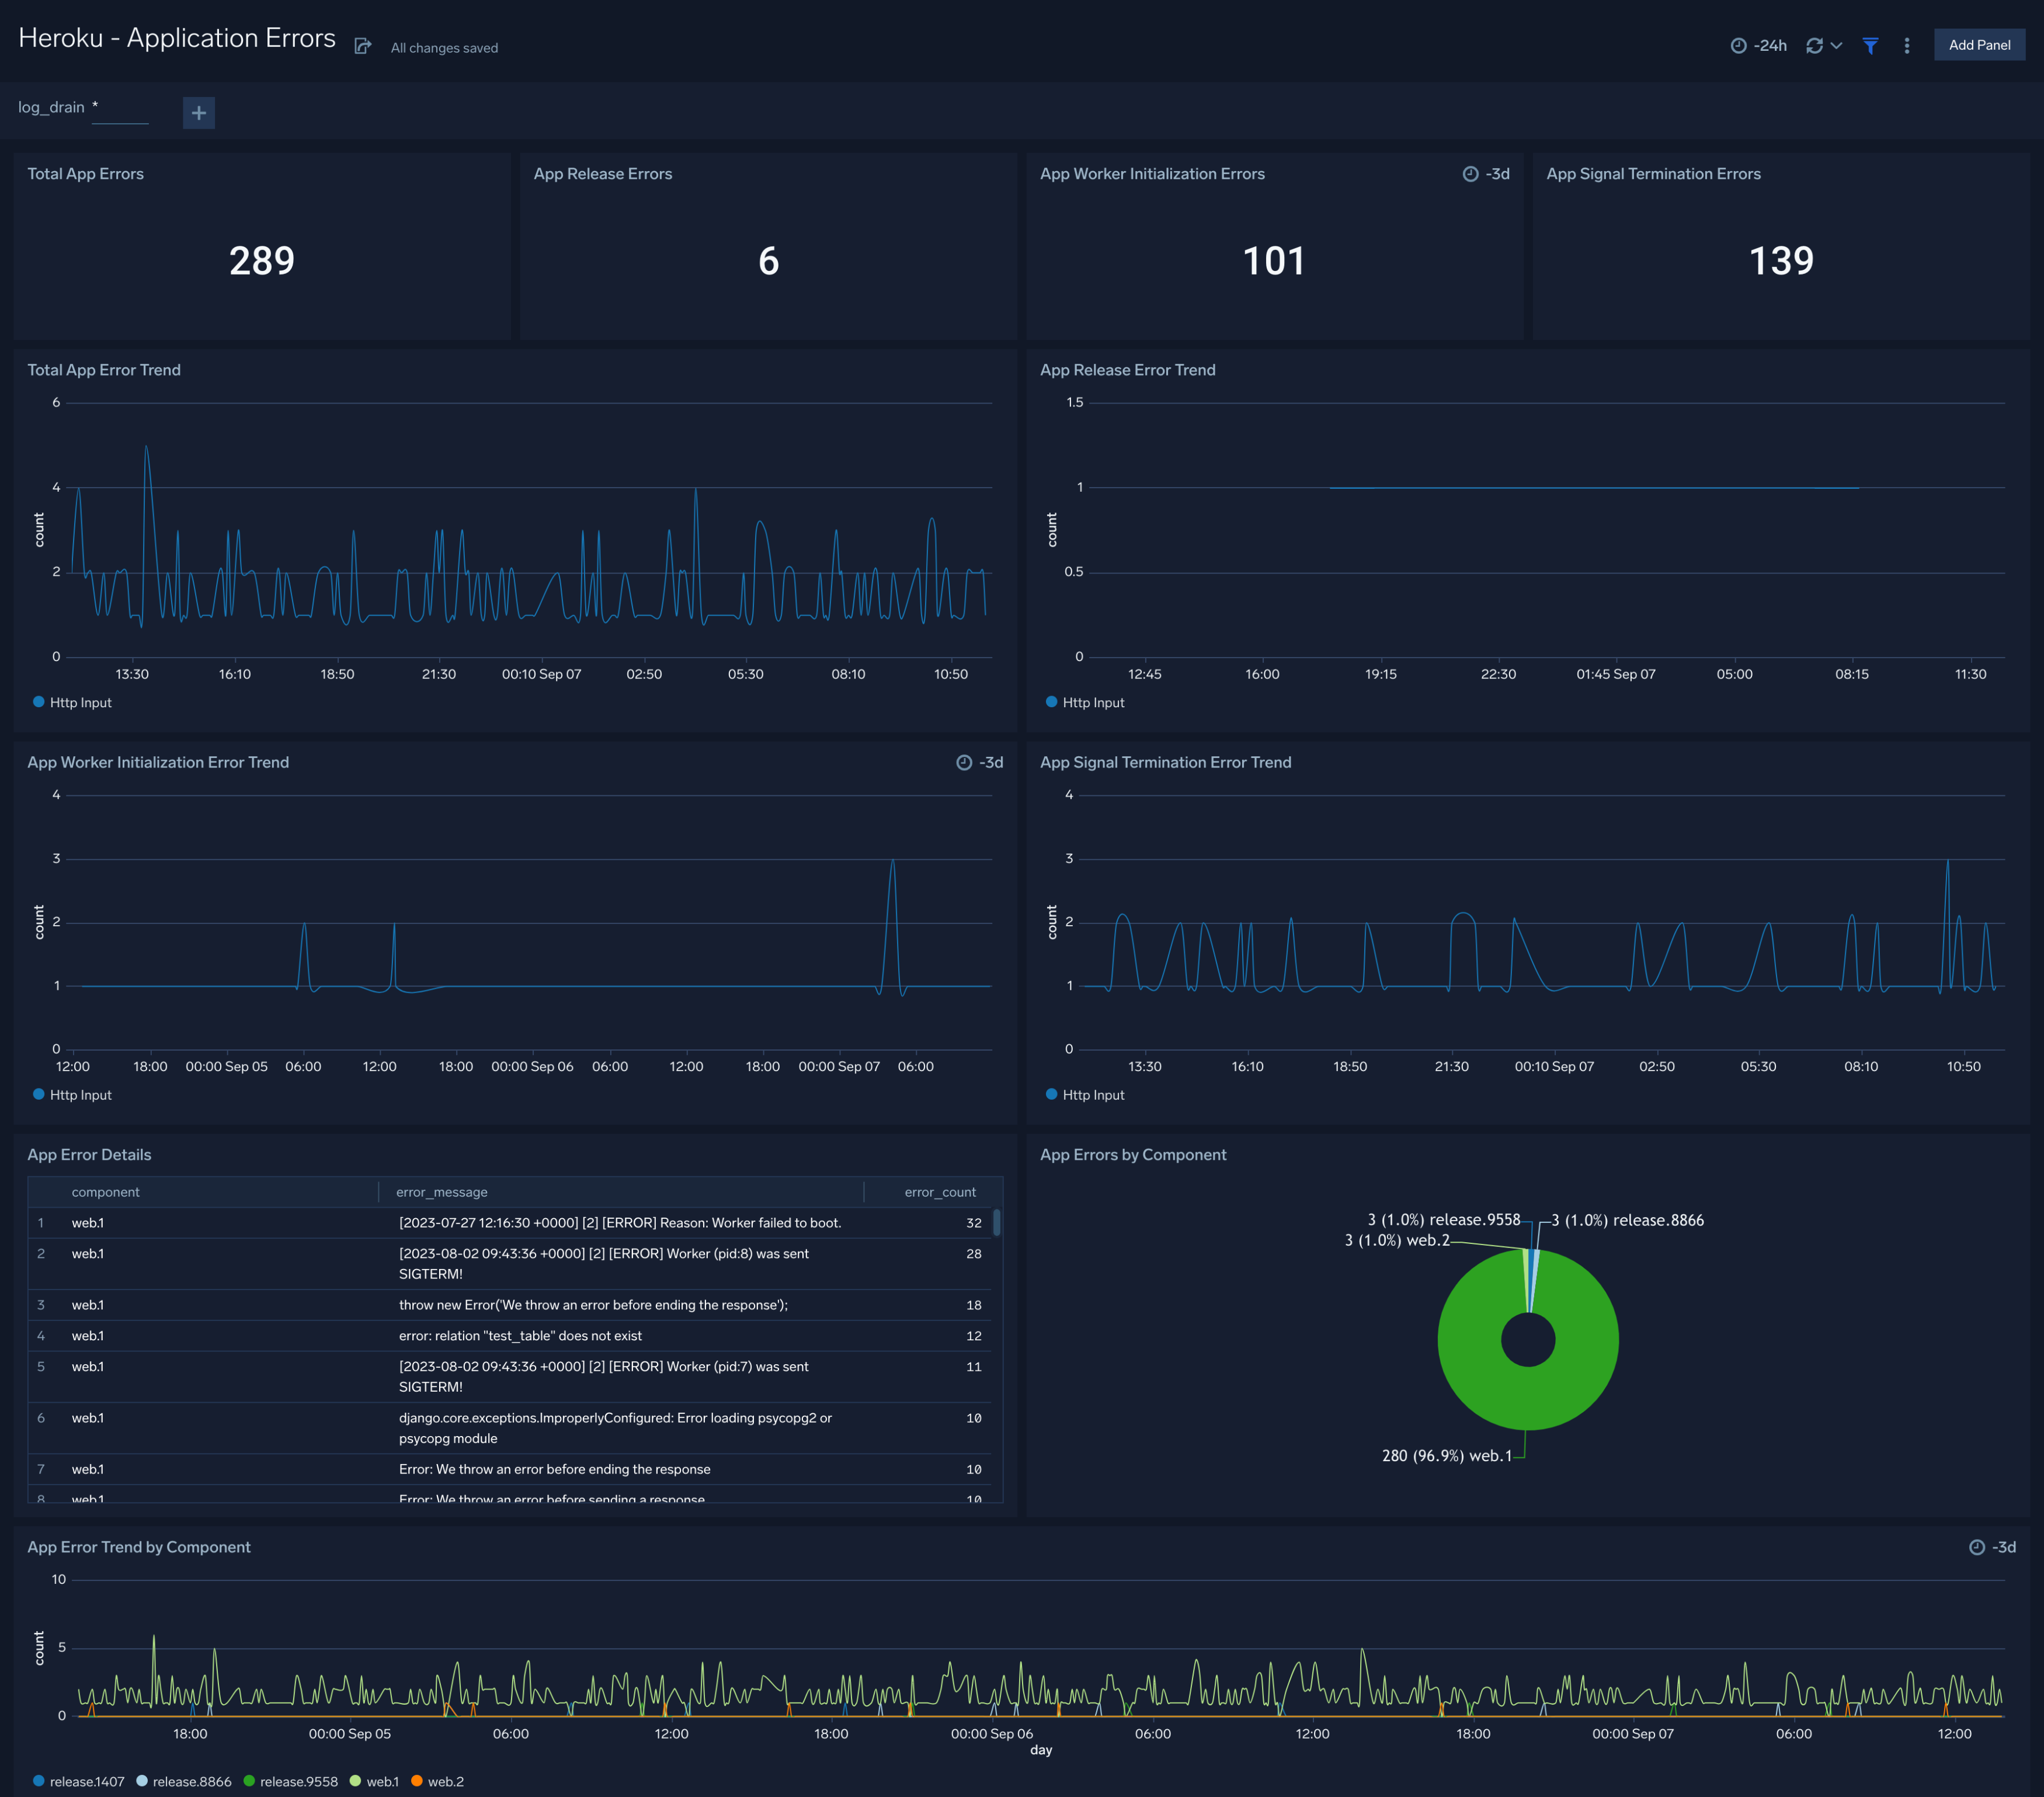
- Total App Errors. Shows the count of total Heroku application errors.
- App Release Errors. Shows the count of total Heroku application errors that occurred during application releases.
- App Worker Initialization Errors. Shows the count of Heroku application errors resulting due to failed app worker boot up.
- App Signal Termination Errors. Shows the count of Heroku application errors resulting due to app signal termination requests. When a process receives a SIGTERM signal, it means that an external entity or another process is requesting the process to terminate gracefully.
- Total App Error Trend. Shows the count of total Heroku application errors over a period of time.
- App Release Error Trend. Shows the count of total Heroku application release errors over a period of time.
- App Worker Initialization Error Trend. Shows the count of Heroku application errors resulting due to failed app worker boot up over a period of time.
- App Signal Termination Error Trend. Shows the count of Heroku application errors resulting due to app signal termination requests over a period of time.
- App Error Details. Shows the count of different types of error messages for different Heroku components.
- App Errors by Component. Shows the distribution of application errors for different Heroku components.
- App Error Trend by Component. Shows the count of application errors for different Heroku components over a period of time.