MongoDB Atlas

The Sumo Logic app for MongoDB Atlas allows you to monitor database operations, performance KPIs and provides visibility into the security posture of your clusters with the following dashboard types:
- Operations Dashboard. For monitoring database operations and cluster health.
- Performance Dashboard. For insights into slow queries, database and hardware metrics.
- Security Dashboard. For visibility into user logins, audit events, project and organizational activity, incoming threats, and IOCs.
MongoDB Atlas is a global cloud database service designed specifically for cloud-based applications. MongoDB Atlas runs in AWS, Azure, or GCP environments, with guaranteed availability, scalability, and compliance with data security and privacy standards.
The MongoDB Atlas app supports MongoDB Version 3.4 and above.
Log and metric types
MongoDB Atlas uses logs and metrics. MongoDB Atlas logs are in JSON format and metrics are in Carbon 2.0 format. The Sumo Logic app for MongoDB Atlas uses five types of logs and two types of metrics.
Sample log messages
MongoDB Atlas logs are all in JSON format and metrics are in Carbon2.0 format. The MongoDB Atlas utilizes five types of logs and two types of metrics. This section provides examples of the log types utilized by the MongoDB Atlas app.
The Sumo Logic mongodbatlas collector enhances logs by adding a few metadata fields. For this reason, the raw logs from the MongoDB Atlas API may differ in format.
Some logs are not available for some cluster tier. Check the MongoDB docs. Some log types like for mongos instances are available for shared cluster only.
Sample Logs (Database, Audit, Alerts, Organization Events, Project Events (click here to expand)
{
  "t":{
    "$date":"2022-07-27T17:04:49.286+00:00"
  },
  "s":"I",
  "c":"REPL_HB",
  "id":23974,
  "ctx":"ReplCoord-432",
  "msg":"Heartbeat failed after max retries",
  "attr":{
    "target":"atlas-11varv-shard-00-02.uv8kc.mongodb.net:27017",
    "maxHeartbeatRetries":2,
    "error":{
      "code":6,
      "codeName":"HostUnreachable",
      "errmsg":"Error connecting to atlas-11varv-shard-00-02.uv8kc.mongodb.net:27017 (192.168.253.14:27017) :: caused by :: Connection refused"
    }
  },
  "project_id":"62dea24636af817c353dafa4",
  "hostname":"mongo6cluster-shard-00-01.uv8kc.mongodb.net",
  "cluster_name":"mongo6cluster",
  "created":"2022-07-27T17:04:49.286+00:00"
}
For more information, see MongoDB Atlas Administration API docs.
{
  "atype":"authenticate",
  "ts":{
    "$date":"2019-07-03T16:08:50.256+0000"
  },
  "local":{
    "ip":"192.168.253.201",
    "port":27017
  },
  "remote":{
    "ip":"192.168.254.91",
    "port":49592
  },
  "users":[
    {
      "user":"mms-monitoring-agent",
      "db":"admin"
    }
  ],
  "roles":[
    {
      "role":"clusterMonitor",
      "db":"admin"
    }
  ],
  "param":{
    "user":"mms-monitoring-agent",
    "db":"admin",
    "mechanism":"SCRAM-SHA-1"
  },
  "result":0,
  "project_id":"5cd0343ff2a30b3880beddb0",
  "hostname":"m10awstestcluster-shard-01-02-snvkl.mongodb.net",
  "cluster_name":"m10awstestcluster",
  "created":"2019-07-03T16:08:50.256+0000"
}
For more information, see MongoDB Atlas Administration API docs.
{
  "alertConfigId":"5cf9c324f2a30b3783a1dd28",
  "clusterName":"M10AWSTestCluster",
  "created":"2019-06-07T01:52:28Z",
  "currentValue":{
    "number":5.142857142857142,
    "units":"RAW"
  },
  "eventTypeName":"OUTSIDE_METRIC_THRESHOLD",
  "groupId":"5cd0343ff2a30b3880beddb0",
  "hostnameAndPort":"m10awstestcluster-shard-00-01-snvkl.mongodb.net:27017",
  "id":"5cf9c35cd5ec1376c01e81e5",
  "lastNotified":"2019-06-07T02:28:38Z",
  "links":[
    {
      "href":"https://cloud.mongodb.com/api/public/v1.0/groups/5cd0343ff2a30b3880beddb0/alerts/5cf9c35cd5ec1376c01e81e5",
      "rel":"self"
    }
  ],
  "metricName":"CONNECTIONS_PERCENT",
  "replicaSetName":"M10AWSTestCluster-shard-0",
  "resolved":"2019-06-07T02:28:29Z",
  "status":"CLOSED",
  "typeName":"HOST_METRIC",
  "updated":"2019-06-07T02:28:29Z"
}
For more information, see MongoDB Atlas Administration API docs.
{"clusterName": "Mongo6Cluster", "created": "2022-07-25T14:17:22Z", "eventTypeName": "CLUSTER_READY", "groupId": "62dea24636af817c353dafa4", "id": "62dea5f2eeed4a46dc259c7c", "isGlobalAdmin": false, "links": [{"href": "https://cloud.mongodb.com/api/atlas/v1.0/groups/62dea24636af817c353dafa4/events/62dea5f2eeed4a46dc259c7c", "rel": "self"}]}

{"created": "2022-07-25T14:16:31Z", "eventTypeName": "ADD_HOST_AUDIT", "groupId": "62dea24636af817c353dafa4", "hostname": "atlas-11varv-shard-00-00.uv8kc.mongodb.net", "id": "62dea5bf3ed8bc7aac32e072", "isGlobalAdmin": false, "links": [{"href": "https://cloud.mongodb.com/api/atlas/v1.0/groups/62dea24636af817c353dafa4/events/62dea5bf3ed8bc7aac32e072", "rel": "self"}], "port": 27016, "userAlias": "mongo6cluster-shard-00-00.uv8kc.mongodb.net"}
For more information, see MongoDB Atlas Administration API docs.
Sample metrics
Here are some examples of the metric types utilized by the MongoDB Atlas app.
Sample process metrics and disk metrics (click here to expand)
Process metrics
CACHE_DIRTY_BYTES
CACHE_USED_BYTES
CONNECTIONS
CURSORS_TOTAL_OPEN
CURSORS_TOTAL_TIMED_OUT
DATABASE_AVERAGE_OBJECT_SIZE
DB_STORAGE_TOTAL
DB_DATA_SIZE_TOTAL
EXTRA_INFO_PAGE_FAULTS
GLOBAL_LOCK_CURRENT_QUEUE_TOTAL
MEMORY_RESIDENT
MEMORY_VIRTUAL
MEMORY_MAPPED
NETWORK_BYTES_IN
NETWORK_BYTES_OUT
NETWORK_NUM_REQUESTS
OPCOUNTER_CMD
OPCOUNTER_QUERY
OPCOUNTER_UPDATE
OPCOUNTER_DELETE
OPCOUNTER_GETMORE
OPCOUNTER_INSERT
OP_EXECUTION_TIME_READS
OP_EXECUTION_TIME_WRITES
OP_EXECUTION_TIME_COMMANDS
OPLOG_MASTER_LAG_TIME_DIFF
OPLOG_SLAVE_LAG_MASTER_TIME
QUERY_EXECUTOR_SCANNED
QUERY_EXECUTOR_SCANNED_OBJECTS
QUERY_TARGETING_SCANNED_PER_RETURNED
QUERY_TARGETING_SCANNED_OBJECTS_PER_RETURNED
SYSTEM_NORMALIZED_CPU_USER
SYSTEM_NORMALIZED_CPU_KERNEL
SYSTEM_NORMALIZED_CPU_IOWAIT
PROCESS_CPU_USER
PROCESS_CPU_KERNEL
SYSTEM_NORMALIZED_CPU_STEAL
"projectId=5cd0343ff2a30b3880beddb0 hostId=m10awstestcluster-shard-00-00-snvkl.mongodb.net:27016 processId=m10awstestcluster-shard-00-00-snvkl.mongodb.net:27016 metric=ASSERT_REGULAR units=SCALAR_PER_SECOND cluster_name=m10awstestcluster 0.0 1564207269
For more information, see https://docs.atlas.mongodb.com/refer...-measurements/.
Disk metrics
DISK_PARTITION_IOPS_READ
DISK_PARTITION_IOPS_WRITE
DISK_PARTITION_LATENCY_READ
DISK_PARTITION_LATENCY_WRITE
DISK_PARTITION_SPACE_PERCENT_FREE
DISK_PARTITION_SPACE_PERCENT_USED
projectId=5cd0343ff2a30b3880beddb0 partitionName=nvme1n1 hostId=m10awstestcluster-shard-01-02-snvkl.mongodb.net:27017 processId=m10awstestcluster-shard-01-02-snvkl.mongodb.net:27017 metric=DISK_PARTITION_IOPS_READ units=SCALAR_PER_SECOND cluster_name=m10awstestcluster 0.0 1564207300
For more information, see https://docs.atlas.mongodb.com/refer...-measurements/.
Sample queries
This sample query is from the MongoDB Atlas Audit dashboard > Recent Audit Events panel.
(_sourceCategory="Labs/mongodbatlas6/logs" ) | json "atype", "local.ip", "remote.ip", "users","result", "project_id", "hostname", "cluster_name", "param" as atype, local_ip, remote_ip, users, result, project_id, hostname, cluster_name, param
| json field=param "db", "ns" as database1, database2 nodrop
| parse field=database2 "*.*" as database2, collection nodrop
| if (isBlank(database1), database2, database1) as database
| where atype matches /create|add|grant|drop|remove|revoke|shutdown|rename|update|authenticate|authcheck/
| first(_messageTime) as latest_event_date group by atype, project_id, hostname, cluster_name,  database, collection, users, local_ip, remote_ip
| sort by latest_event_date
Collecting logs and metrics for the MongoDB Atlas app
This section explains how to collect logs from MongoDB Atlas for mongo version 6.0 and ingest them into Sumo Logic for use with the MongoDB Atlas app predefined dashboards and searches. Most of the panels for this app work for logs coming in from mongo version 4.4 and 5.
Sumo Logic provides a solution which pulls logs and metrics from MongoDB Atlas with API calls. You can configure the log types to be collected, and the logs and metrics are then forwarded to Sumo Logic’s HTTP endpoint.
By default, the collection starts from the current date and time, but this setting is also configurable. For more information, see the Advanced Configuration options.
Step 1: Acquire Authentication Info from MongoDB Atlas Portal
This section shows you how to acquire MongoDB Atlas portal authentication information. Generate programmatic API Keys with project owner permissions using the instructions in the Atlas documentation. Then, copy the public key and private key. These serve the same function as a username and API Key, respectively.
- Generate programmatic API Keys with project owner permissions using the instructions in the Atlas documentation. Then, copy the public key and private key. These serve the same function as a username and API Key respectively.
- Specify the API key Organization Member permissions, under Organization > Access Manager > API Keys, as shown in the following example.
- Go to Project Settings > Access Manager > API Keys and then click on Invite To Project to add the API key created above for this project as shown in the following example.
- Specify Project Data Access Read Only permission, under Project Settings > Access Manager > API Keys, as shown in the following example.
- Go to your project, click Settings, and copy the Project ID, as shown in the following example.
- Go to your organization by using context dropdown at the top, click Settings, and copy the Organization ID.
- Enable Database Auditing for the Atlas project for which you want to monitor logs, as described in this Atlas document. Leave Database Auditing set to ON, as shown in the following example.
Step 2: Add a Hosted Collector and HTTP Source
This section demonstrates how to add a hosted Sumo Logic collector and HTTP Logs and Metrics source, to collect logs for MongoDB Atlas. When you configure the HTTP Source, make sure to save the HTTP Source Address URL. You will need this later to configure the configuration file.
- Do one of the following:
- If you already have a Sumo Logic Hosted Collector, identify the one you want to use; or
- Create a new Hosted Collector as described in Configure a Hosted Collector.
- Add two HTTP sources, one for logs and another for metrics.
- Go to the source you created for ingesting logs, navigate to Timestamp Format > Advanced Options, and click Specify a format.
- Enter the following information in the respective fields for the log source:
- Timestamp Locator:
\"created\":(.*) - Format:
yyyy-MM-dd'T'HH:mm:ss.SSS'Z'
- Timestamp Locator:
- Click Add.
- Enter the following information in the respective fields for the metric source:
- Timestamp Locator:
\"created\":(.*) - Format:
yyyy-MM-dd'T'HH:mm:ss'Z'
- Timestamp Locator:
- Click Add.
Step 3: Configure Collection for MongoDB Atlas
In this section, we explore various mechanisms to collect database logs, events, metrics and alerts from MongoDB Atlas and send them to Sumo Logic, where they are shown in dashboards as part of the MongoDB Atlas app. You can configure Sumo Logic’s MongoDB Atlas collector in Amazon Web Services (AWS) using the AWS Lambda service, or by running a script on a Linux machine as a cron job. Choose the method that is best suited for you:
- AWS Lambda-based collection via a Serverless Application Model (SAM) application
- Script-based collection from a Linux machine
A single instance of the collector is responsible for collecting logs from a single project. Refer to Configure Collection for Multiple Projects if you have multiple projects.
Step 3A: Deploy the Sumo Logic MongoDB Atlas SAM application
In this section, you deploy the SAM application, which creates the necessary resources in your AWS account. To deploy the Sumo Logic MongoDB Atlas SAM application, do the following:
- Go to https://serverlessrepo.aws.amazon.com/applications.
- Search for sumologic-mongodb-atlas, select the Show apps that create custom IAM roles or resource policies check box, and click the app link when it appears.
- When the Sumo Logic app page appears, click Deploy.
- In the AWS Lambda > Functions > Application Settings panel, specify the following parameters in the corresponding text fields:
- HTTPLogsEndpoint: Copy and paste the URL for the HTTP Logs source from this Step 2.
- HTTPMetricsEndpoint: Copy and paste the URL for the HTTP Metrics source from Step 2.
- OrganizationID: Copy and paste the Organization ID from Step 1.
- ProjectID: Copy and paste the Project ID from Step 1.
- Private API Key: Copy and paste the Private Key from Step 1.
- Public API Key: Copy and paste the Public Key from Step 1.
- Click Deploy.
- Search for Lambda in the AWS console, select Functions tab and open the function just created.
- Go to the Configuration > Permissions tab of the function, and click on the Execution role name link to open up the IAM window containing all the permission policies.
- Click on Add permissions > Create inline policy. Choose JSON and copy this policy statement:
{
  "Version":"2012-10-17",
  "Statement":[
    {
      "Effect":"Allow",
      "Action":[
        "ec2:DescribeNetworkInterfaces",
        "ec2:CreateNetworkInterface",
        "ec2:DeleteNetworkInterface",
        "ec2:DescribeInstances",
        "ec2:AttachNetworkInterface"
      ],
      "Resource":"*"
    }
  ]
} - Click on Review policy, and provide an appropriate name. Then click on Create policy. Some users might already have these permissions enabled.
- We then follow these steps to create elastic IP/IPs for the lambda function and add a VPC to our function. We note down the elastic IPs.
- We go to the mongo console, click on Organization Access > Access Manager > API Keys, and click on ‘...’ of the API Key as mentioned in step 2. Then click on Edit Permissions.
- Click Next > Add Access List Entry. Enter the elastic IPs noted above and, then click Save to save the elastic IPs, and click on Done to apply the settings.
The lambda function should be working now in sending logs to Sumo. You can check the CloudWatch logs in Monitor > Logs to see the logs of the function.
Step 3B: Configure Collection for Multiple Projects (optional)
This section shows you how to configure collection for multiple projects, assuming you are already collecting Atlas data for one project. This task requires that you do the following:
- Stop the collection of OrgEvents in the second SAM app deployment, because these events are global and are already captured by first collector.
- Change the
DBNAMEso that state (keys) maintained (bookkeeping) in the database (key value store) are not in conflict.
To configure collection for multiple projects, do the following:
- Deploy the MongoDB Atlas SAM application with the configuration for a new project.
- After the deployment is complete, change the database name by adding environment variable (
DBNAME) in AWS Lambda, as shown in the following example. - From the Lambda console, go to the mongodbatlas.yaml file and comment out
EVENTS_ORG, as shown in the following example. This prevents the collection of org events, because they are already being collected by the first collector.
Step 3C: Configure Script-Based Collection for MongoDB Atlas
This section shows you how to configure script-based log collection for the Sumo Logic MongoDB Atlas app. The sumologic-mongodb-atlas script is compatible with python 3.11 and python 2.7, and has been tested on Ubuntu 18.04 LTS.
This task makes the following assumptions:
- You've successfully added a hosted collector and HTTP source, and copied the configuration parameters (ProjectID, OrganizationID, PublicKey and PrivateKey) from MongoDB Atlas console, as described in Add a Hosted Collector and HTTP Source.
- You're logged into the user account with which you will install the collector. If not, use the following command to switch to that account:
sudo su <username>.
- Configure/install the script on a Linux machine.
- For Python 3, use:
pip3 install sumologic-mongodb-atlas - For operating systems where the default python is not Python 3, use:
/usr/bin/python3 -m sumomongodbatlascollector.main
- For Python 3, use:
- To deploy the script on a Linux machine, do the following:
- If pip is not already installed, follow the instructions in the pip documentation to download and install pip.
- Log in to a Linux machine (compatible with either Python 3.11 or Python 2.7.
- Do one of the following:
- For Python 2, run the following command:
pip install sumologic-mongodb-atlas - For Python 3, run the following command:
pip3 install sumologic-mongodb-atlas
- For Python 2, run the following command:
- Create a
mongodbatlas.yamlconfiguration file in the home directory and fill in the parameters as shown in the following example.mongodbatlas.yamlSumoLogic:
HTTP_LOGS_ENDPOINT: <Paste the HTTP Logs source URL from step 2.>
HTTP_METRICS_ENDPOINT: <Paste the HTTP Metrics source URL from step 2.>
MongoDBAtlas:
ORGANIZATION_ID: <Paste the Organization ID from step 1.>
PROJECT_ID: <Paste the Project ID from step 1.>
PRIVATE_API_KEY: <Paste the Private Key from step 1.>
PUBLIC_API_KEY: <Paste the Public Key from step 1.> - Create a cron job to run the collector every 5 minutes, (use the
crontab -eoption). Do one of the following:- For Python 2, add the following line to your crontab:
*/5 * * * * /usr/bin/python -m sumomongodbatlascollector.main > /dev/null 2>&1 - For Python 3, add the following line to your crontab:
*/5 * * * * /usr/bin/python3 -m sumomongodbatlascollector.main > /dev/null 2>&1
- For Python 2, add the following line to your crontab:
- Configuring collection for multiple projects (assuming you are already collecting Atlas data for one project). This task requires that you do the following:
- Stop the collection of OrgEvents in the second SAM app deployment because these events are global and are already captured by first collector.
- Change the
DBNAMEso that state (keys) maintained (bookkeeping) in the database (key value store) are not in conflict.- Configure the script on a Linux machine, then go to your configuration file.
- Change the
DB_NAMEand comment outEVENTS_ORGas shown in the following example.
SumoLogic:
  LOGS_SUMO_ENDPOINT: <Paste the URL for the HTTP Logs source from step 2.>
  METRICS_SUMO_ENDPOINT: <Paste the URL for the HTTP Metrics source from step 2.>

MongoDBAtlas:
  ORGANIZATION_ID: <Paste the Organization ID from step 1.>
  PROJECT_ID: <Paste the Project ID from step 1.>
  PRIVATE_KEY: <Paste the Private Key from step 1.>
  PUBLIC_KEY: <Paste the Public Key from step 1.>
  LOG_TYPES:
    DATABASE
    AUDIT
    EVENTS_PROJECT
    EVENTS_ORG
    ALERTS

  METRIC_TYPES:
    PROCESS_METRICS:
      CACHE_DIRTY_BYTES
      CACHE_USED_BYTES
      CONNECTIONS
      CURSORS_TOTAL_OPEN
      CURSORS_TOTAL_TIMED_OUT
      DATABASE_AVERAGE_OBJECT_SIZE
      DB_STORAGE_TOTAL
      DB_DATA_SIZE_TOTAL
      EXTRA_INFO_PAGE_FAULTS
      GLOBAL_LOCK_CURRENT_QUEUE_TOTAL
      MEMORY_RESIDENT
      MEMORY_VIRTUAL
      MEMORY_MAPPED
      NETWORK_BYTES_IN
      NETWORK_BYTES_OUT
      NETWORK_NUM_REQUESTS
      OPCOUNTER_CMD
      OPCOUNTER_QUERY
      OPCOUNTER_UPDATE
      OPCOUNTER_DELETE
      OPCOUNTER_GETMORE
      OPCOUNTER_INSERT
      OP_EXECUTION_TIME_READS
      OP_EXECUTION_TIME_WRITES
      OP_EXECUTION_TIME_COMMANDS
      OPLOG_MASTER_LAG_TIME_DIFF
      OPLOG_SLAVE_LAG_MASTER_TIME
      QUERY_EXECUTOR_SCANNED
      QUERY_EXECUTOR_SCANNED_OBJECTS
      QUERY_TARGETING_SCANNED_PER_RETURNED
      QUERY_TARGETING_SCANNED_OBJECTS_PER_RETURNED
      SYSTEM_NORMALIZED_CPU_USER
      SYSTEM_NORMALIZED_CPU_KERNEL
      SYSTEM_NORMALIZED_CPU_IOWAIT
      PROCESS_CPU_USER
      PROCESS_CPU_KERNEL
      SYSTEM_NORMALIZED_CPU_STEAL

    DISK_METRICS:
      DISK_PARTITION_IOPS_READ
      DISK_PARTITION_IOPS_WRITE
      DISK_PARTITION_LATENCY_READ
      DISK_PARTITION_LATENCY_WRITE
      DISK_PARTITION_SPACE_PERCENT_FREE
      DISK_PARTITION_SPACE_PERCENT_USED

Collection:
  DBNAME: "newmongodbatlas"
/usr/bin/python3 -m sumomongodbatlascollector.main <path-of-second-yaml-file>
Step 4: Configure Webhooks for Alerts Collection
You configure Webhooks for real-time alerts. This section explains how to configure alert collection using Webhooks.
- Go to the MongoDBAtlas console and select Project Integrations. Click Configure under Webhook Settings.
- Copy and paste the Logs endpoint from Step 2 to set up Webhook.
- When configuring an alert, specify the Webhook as shown in the following example, and then click Save.
Advanced Configuration
This section is common for both AWS Lambda-based collection and script-based collection.
This table lists MongoDB Atlas variables that you can optionally define in the configuration file (click to expand).
| Variable | Usage |
| LOG_TYPES in MongoDBAtlas Section | DATABASE
AUDIT EVENTS_PROJECT EVENTS_ORG ALERTS Remove any one of the lines if you do not want to collect metric of that type. |
| PROCESS_METRICS in MongoDBAtlas Section | CACHE_DIRTY_BYTES CACHE_USED_BYTES CONNECTIONS CURSORS_TOTAL_OPEN CURSORS_TOTAL_TIMED_OUT DB_STORAGE_TOTAL DB_DATA_SIZE_TOTAL DATABASE_AVERAGE_OBJECT_SIZE EXTRA_INFO_PAGE_FAULTS GLOBAL_LOCK_CURRENT_QUEUE_TOTAL MEMORY_RESIDENT MEMORY_VIRTUAL MEMORY_MAPPED NETWORK_BYTES_IN NETWORK_BYTES_OUT NETWORK_NUM_REQUESTS OPCOUNTER_CMD OPCOUNTER_QUERY OPCOUNTER_UPDATE OPCOUNTER_DELETE OPCOUNTER_GETMORE OPCOUNTER_INSERT OP_EXECUTION_TIME_READS OP_EXECUTION_TIME_WRITES OP_EXECUTION_TIME_COMMANDS QUERY_EXECUTOR_SCANNED QUERY_EXECUTOR_SCANNED_OBJECTS QUERY_TARGETING_SCANNED_PER_RETURNED QUERY_TARGETING_SCANNED_OBJECTS_PER_RETURNED SYSTEM_NORMALIZED_CPU_USER SYSTEM_NORMALIZED_CPU_KERNEL SYSTEM_NORMALIZED_CPU_IOWAIT PROCESS_CPU_USER PROCESS_CPU_KERNEL SYSTEM_NORMALIZED_CPU_STEAL Remove any one of the lines if you do not want to collect metric of that type. |
| DISK_METRICS in MongoDBAtlas Section | DISK_PARTITION_IOPS_READ DISK_PARTITION_IOPS_WRITE DISK_PARTITION_UTILIZATION DISK_PARTITION_LATENCY_READ DISK_PARTITION_LATENCY_WRITE DISK_PARTITION_SPACE_FREE DISK_PARTITION_SPACE_USED Remove any one of the lines if you do not want to collect metric of that type. |
| BACKFILL_DAYS in Collection Section | Number of days before the event collection will start. If the value is 1, then events are fetched from yesterday to today. |
| PAGINATION_LIMIT in Collection Section | Number of events to fetch in a single API call. |
| LOG_FORMAT in Logging Section | Log format used by the python logging module to write logs in a file. |
| ENABLE_LOGFILE in Logging Section | Set to TRUE to write all logs and errors to a log file. |
| ENABLE_CONSOLE_LOG in Logging Section | Enables printing logs in a console. |
| LOG_FILEPATH in Logging Section | Path of the log file used when ENABLE_LOGFILE is set to TRUE. |
| NUM_WORKERS in Collection Section | Number of threads to spawn for API calls. |
| MAX_RETRY in Collection Section | Number of retries to attempt in case of request failure. |
| BACKOFF_FACTOR in Collection Section | A backoff factor to apply between attempts after the second try. If the backoff_factor is 0.1, then sleep() will sleep for [0.0s, 0.2s, 0.4s, ...] between retries. |
| TIMEOUT in Collection Section | Request time out used by the requests library. |
| LOGS_SUMO_ENDPOINT in MongoDBAtlas section | HTTP source endpoint url created in Sumo Logic for ingesting Logs. |
| METRICS_SUMO_ENDPOINT In MongoDBAtlas section | HTTP source endpoint url created in Sumo Logic for ingesting Metrics. |
Troubleshooting
This section shows you how to run the function manually and then verify that log messages are being sent from MongoDB Atlas.
To run the function manually, do the following:
- Enter one of the following commands:
- For Python 2, use this command:
python -m sumomongodbatlascollector.main - For Python 3, use this command:
python3 -m sumomongodbatlascollector.main
- For Python 2, use this command:
- Check the automatically generated logs in /tmp/sumoapiclient.log to verify whether the function is getting triggered or not.
- If you installed the collector as
rootuser and then run it as a normal user, you will see an error message similar to the following. This is because the config is not present in the home directory of the user that is running the collector. Switch torootuser and run the script again.
You can also avoid this error by running the script with config file path as first argument.
Traceback (most recent call last):
 File "/usr/local/lib/python2.7/dist-packages/sumomongodbatlascollector/main.py", line 190, in main
   ns = MongoDBAtlasCollector()
 File "/usr/local/lib/python2.7/dist-packages/sumomongodbatlascollector/main.py", line 29, in __init__
   self.config = Config().get_config(self.CONFIG_FILENAME, self.root_dir, cfgpath)
 File "/usr/local/lib/python2.7/dist-packages/sumomongodbatlascollector/common/config.py", line 22, in get_config
   self.validate_config(self.config)
 File "/usr/local/lib/python2.7/dist-packages/sumomongodbatlascollector/common/config.py", line 34, in validate_config
   raise Exception("Invalid config")
Exception: Invalid config
Installing the MongoDB Atlas app
To install the app, do the following:
- Select App Catalog.
- In the 🔎 Search Apps field, run a search for your desired app, then select it.
- Click Install App.
note
Sometimes this button says Add Integration.
- Click Next in the Setup Data section.
- In the Configure section of your respective app, complete the following fields.
- Key. Select either of these options for the data source.
- Choose Source Category and select a source category from the list for Default Value.
- Choose Custom, and enter a custom metadata field. Insert its value in Default Value.
- Key. Select either of these options for the data source.
- Click Next. You will be redirected to the Preview & Done section.
Post-installation
Once your app is installed, it will appear in your Installed Apps folder, and dashboard panels will start to fill automatically.
Each panel slowly fills with data matching the time range query and received since the panel was created. Results will not immediately be available, but will update with full graphs and charts over time.
Upgrading the MongoDB Atlas app (Optional)
To update the app, do the following:
- Select App Catalog.
- In the Search Apps field, search for and then select your app.
Optionally, you can identify apps that can be upgraded in the Upgrade available section. - To upgrade the app, click Upgrade.
- If the upgrade does not have any configuration or property changes, you will be redirected to the Preview & Done section.
- If the upgrade has any configuration or property changes, you will be redirected to Setup Data page.
- In the Configure section of your respective app, complete the following fields.
- Key. Select either of these options for the data source.
- Choose Source Category and select a source category from the list for Default Value.
- Choose Custom and enter a custom metadata field. Insert its value in Default Value.
- Key. Select either of these options for the data source.
- Click Next. You will be redirected to the Preview & Done section.
- In the Configure section of your respective app, complete the following fields.
Post-update
Your upgraded app will be installed in the Installed Apps folder, and dashboard panels will start to fill automatically.
See our Release Notes changelog for new updates in the app.
Uninstalling the MongoDB Atlas app (Optional)
To uninstall the app, do the following:
- Select App Catalog.
- In the 🔎 Search Apps field, run a search for your desired app, then select it.
- Click Uninstall.
Viewing MongoDB Atlas dashboards
All dashboards have a set of filters that you can apply to the entire dashboard. Use these filters to drill down and examine the data to a granular level.
- You can change the time range for a dashboard or panel by selecting a predefined interval from a drop-down list, choosing a recently used time range, or specifying custom dates and times. Learn more.
- If required, configure the refresh interval rate for a dashboard or panel by clicking the drop-down arrow next to the refresh icon.
- Click the funnel icon in the dashboard top menu bar to filter dashboard with Template Variables.

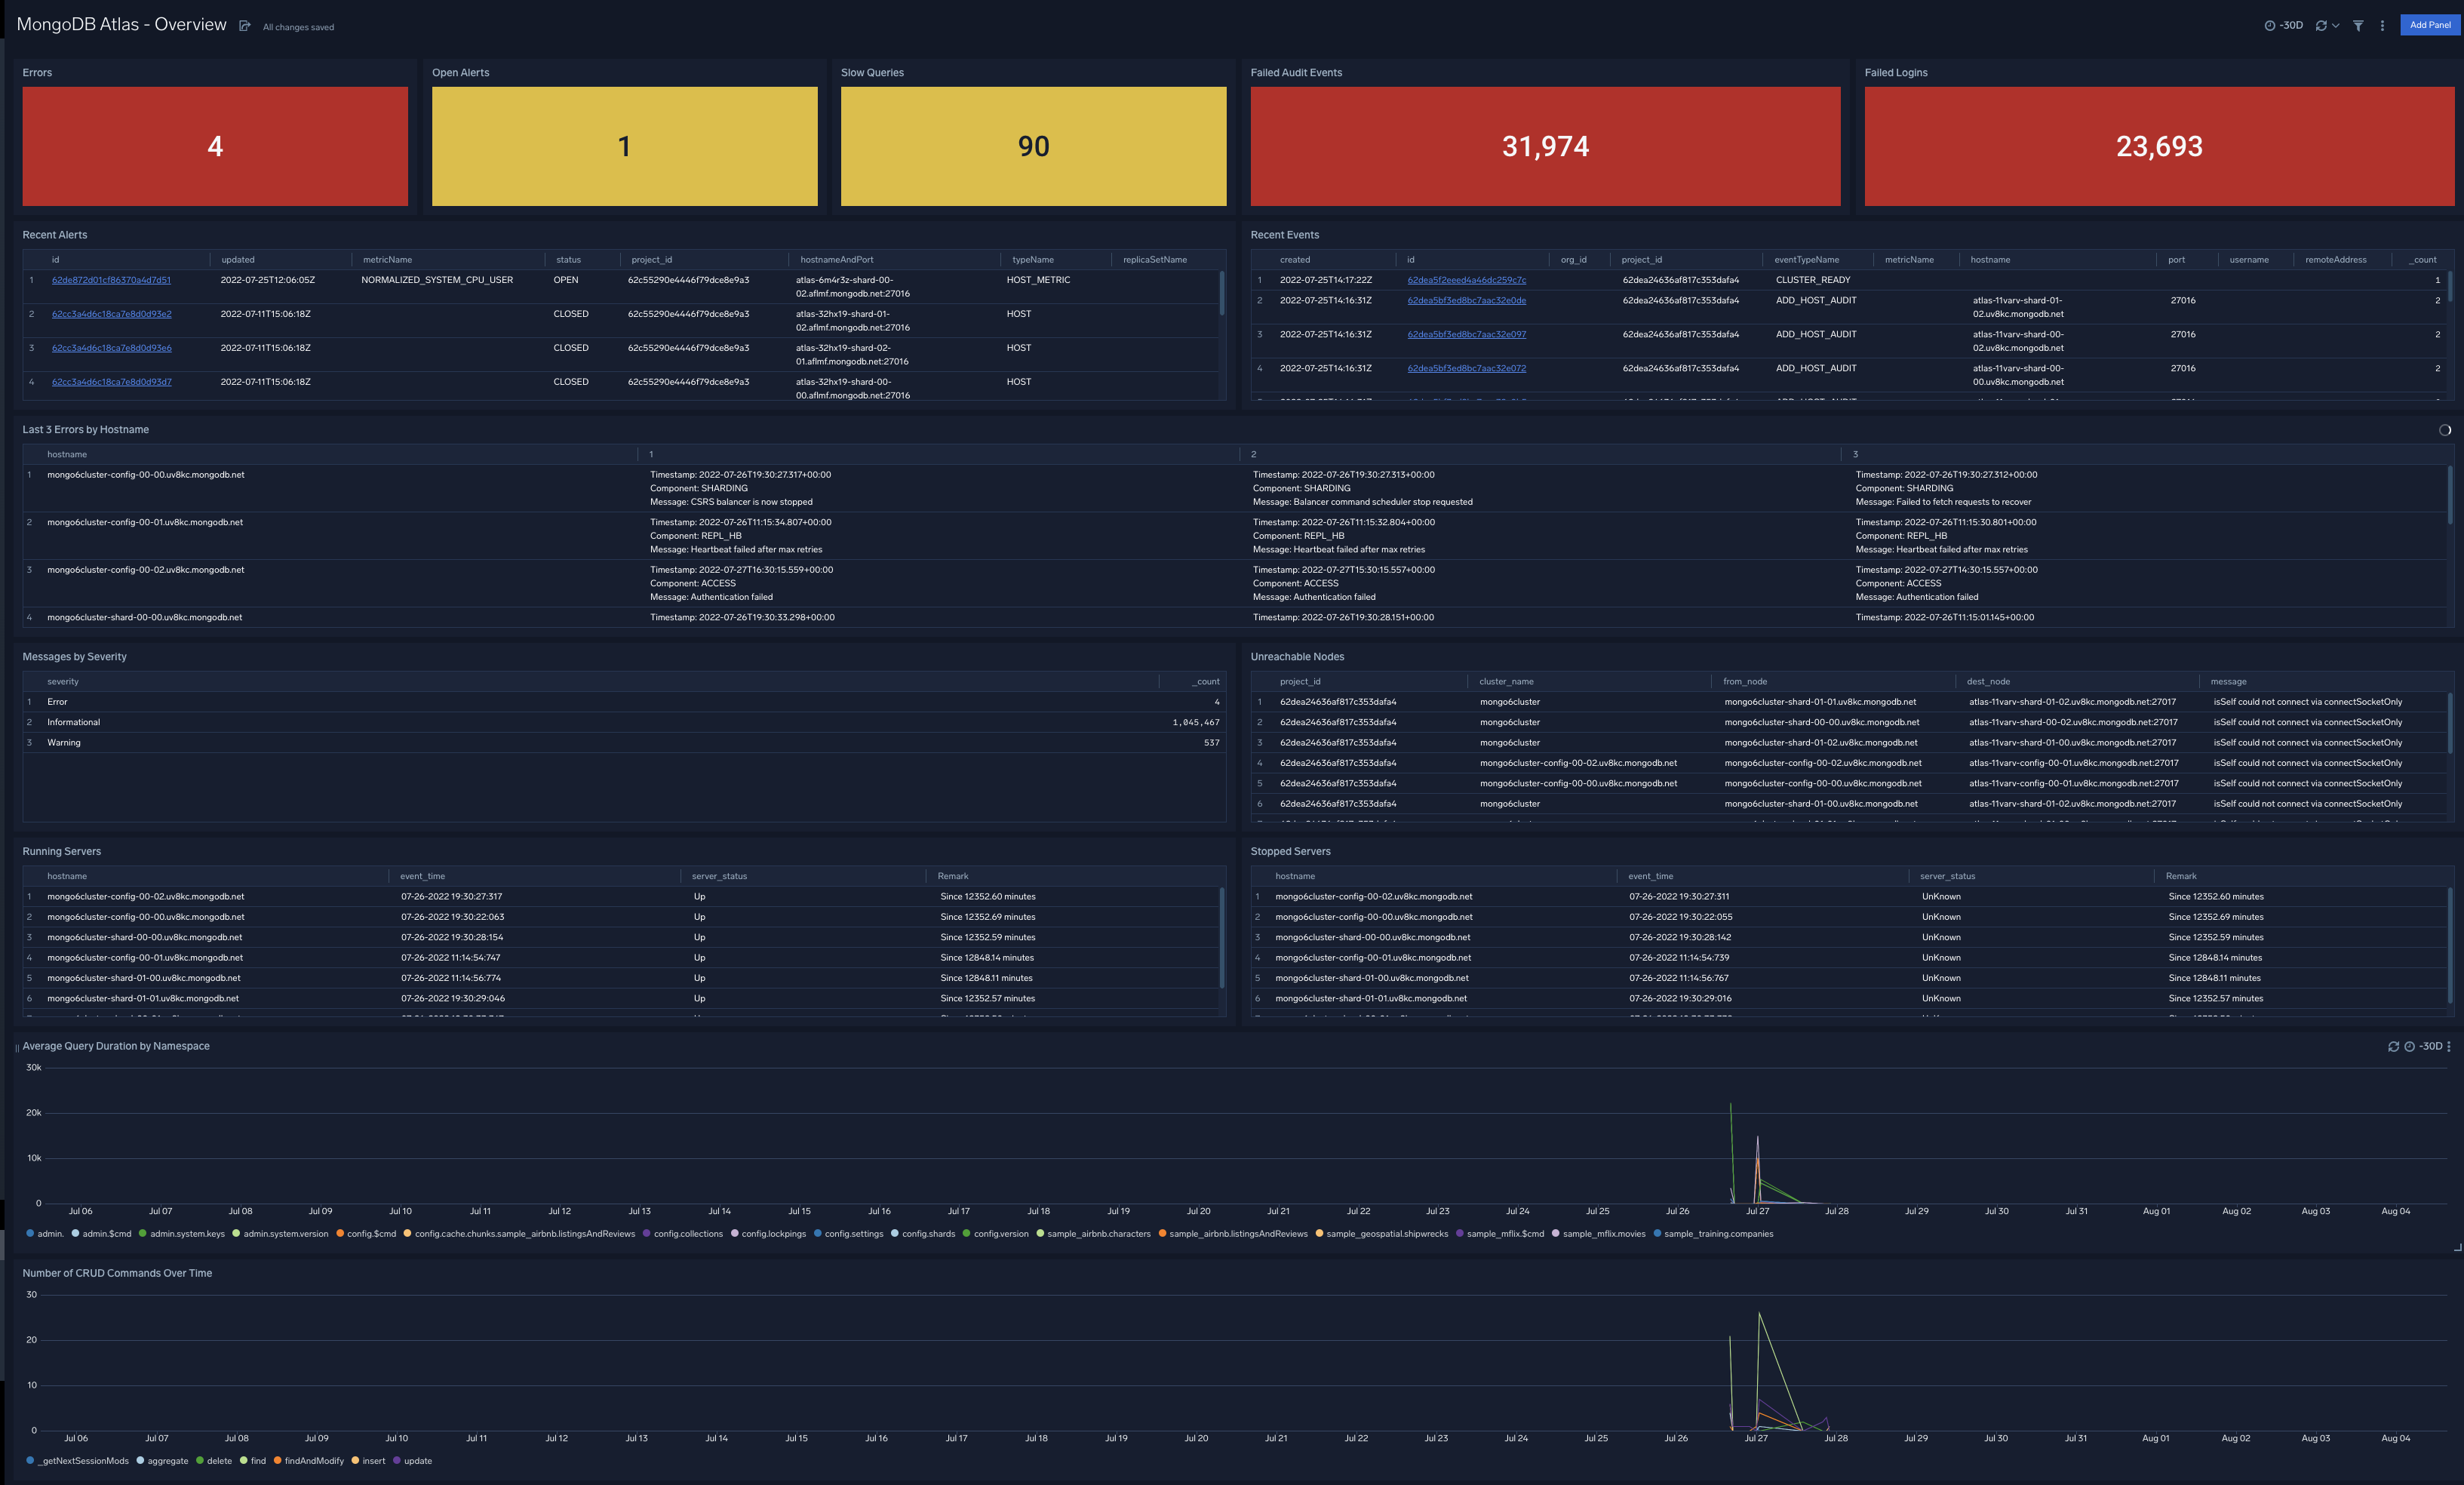
Overview
The MongoDB Atlas Overview dashboard provides an at-a-glance overview of server availability, messages, and commands. Panels display information on messages by severity and component, trends in messages by component and severity, as well as trends for database (DB) commands and create, read, update, and delete (CRUD) function commands.
Use this dashboard to:
- Identify key operational metrics. You can drill down for granular data by clicking any of the first row panels. Monitor recent events and alerts. Click on the ID links to drill-down into the MongoDB Atlas console for more details.
- Monitor unreachable nodes, running and stopped servers, and identify and fix host errors.
Security dashboards
The MongoDB Atlas Security dashboards aim to provide a comprehensive view of Atlas security and audit aspects via the Atlas audit logs, alerts, and events logs.
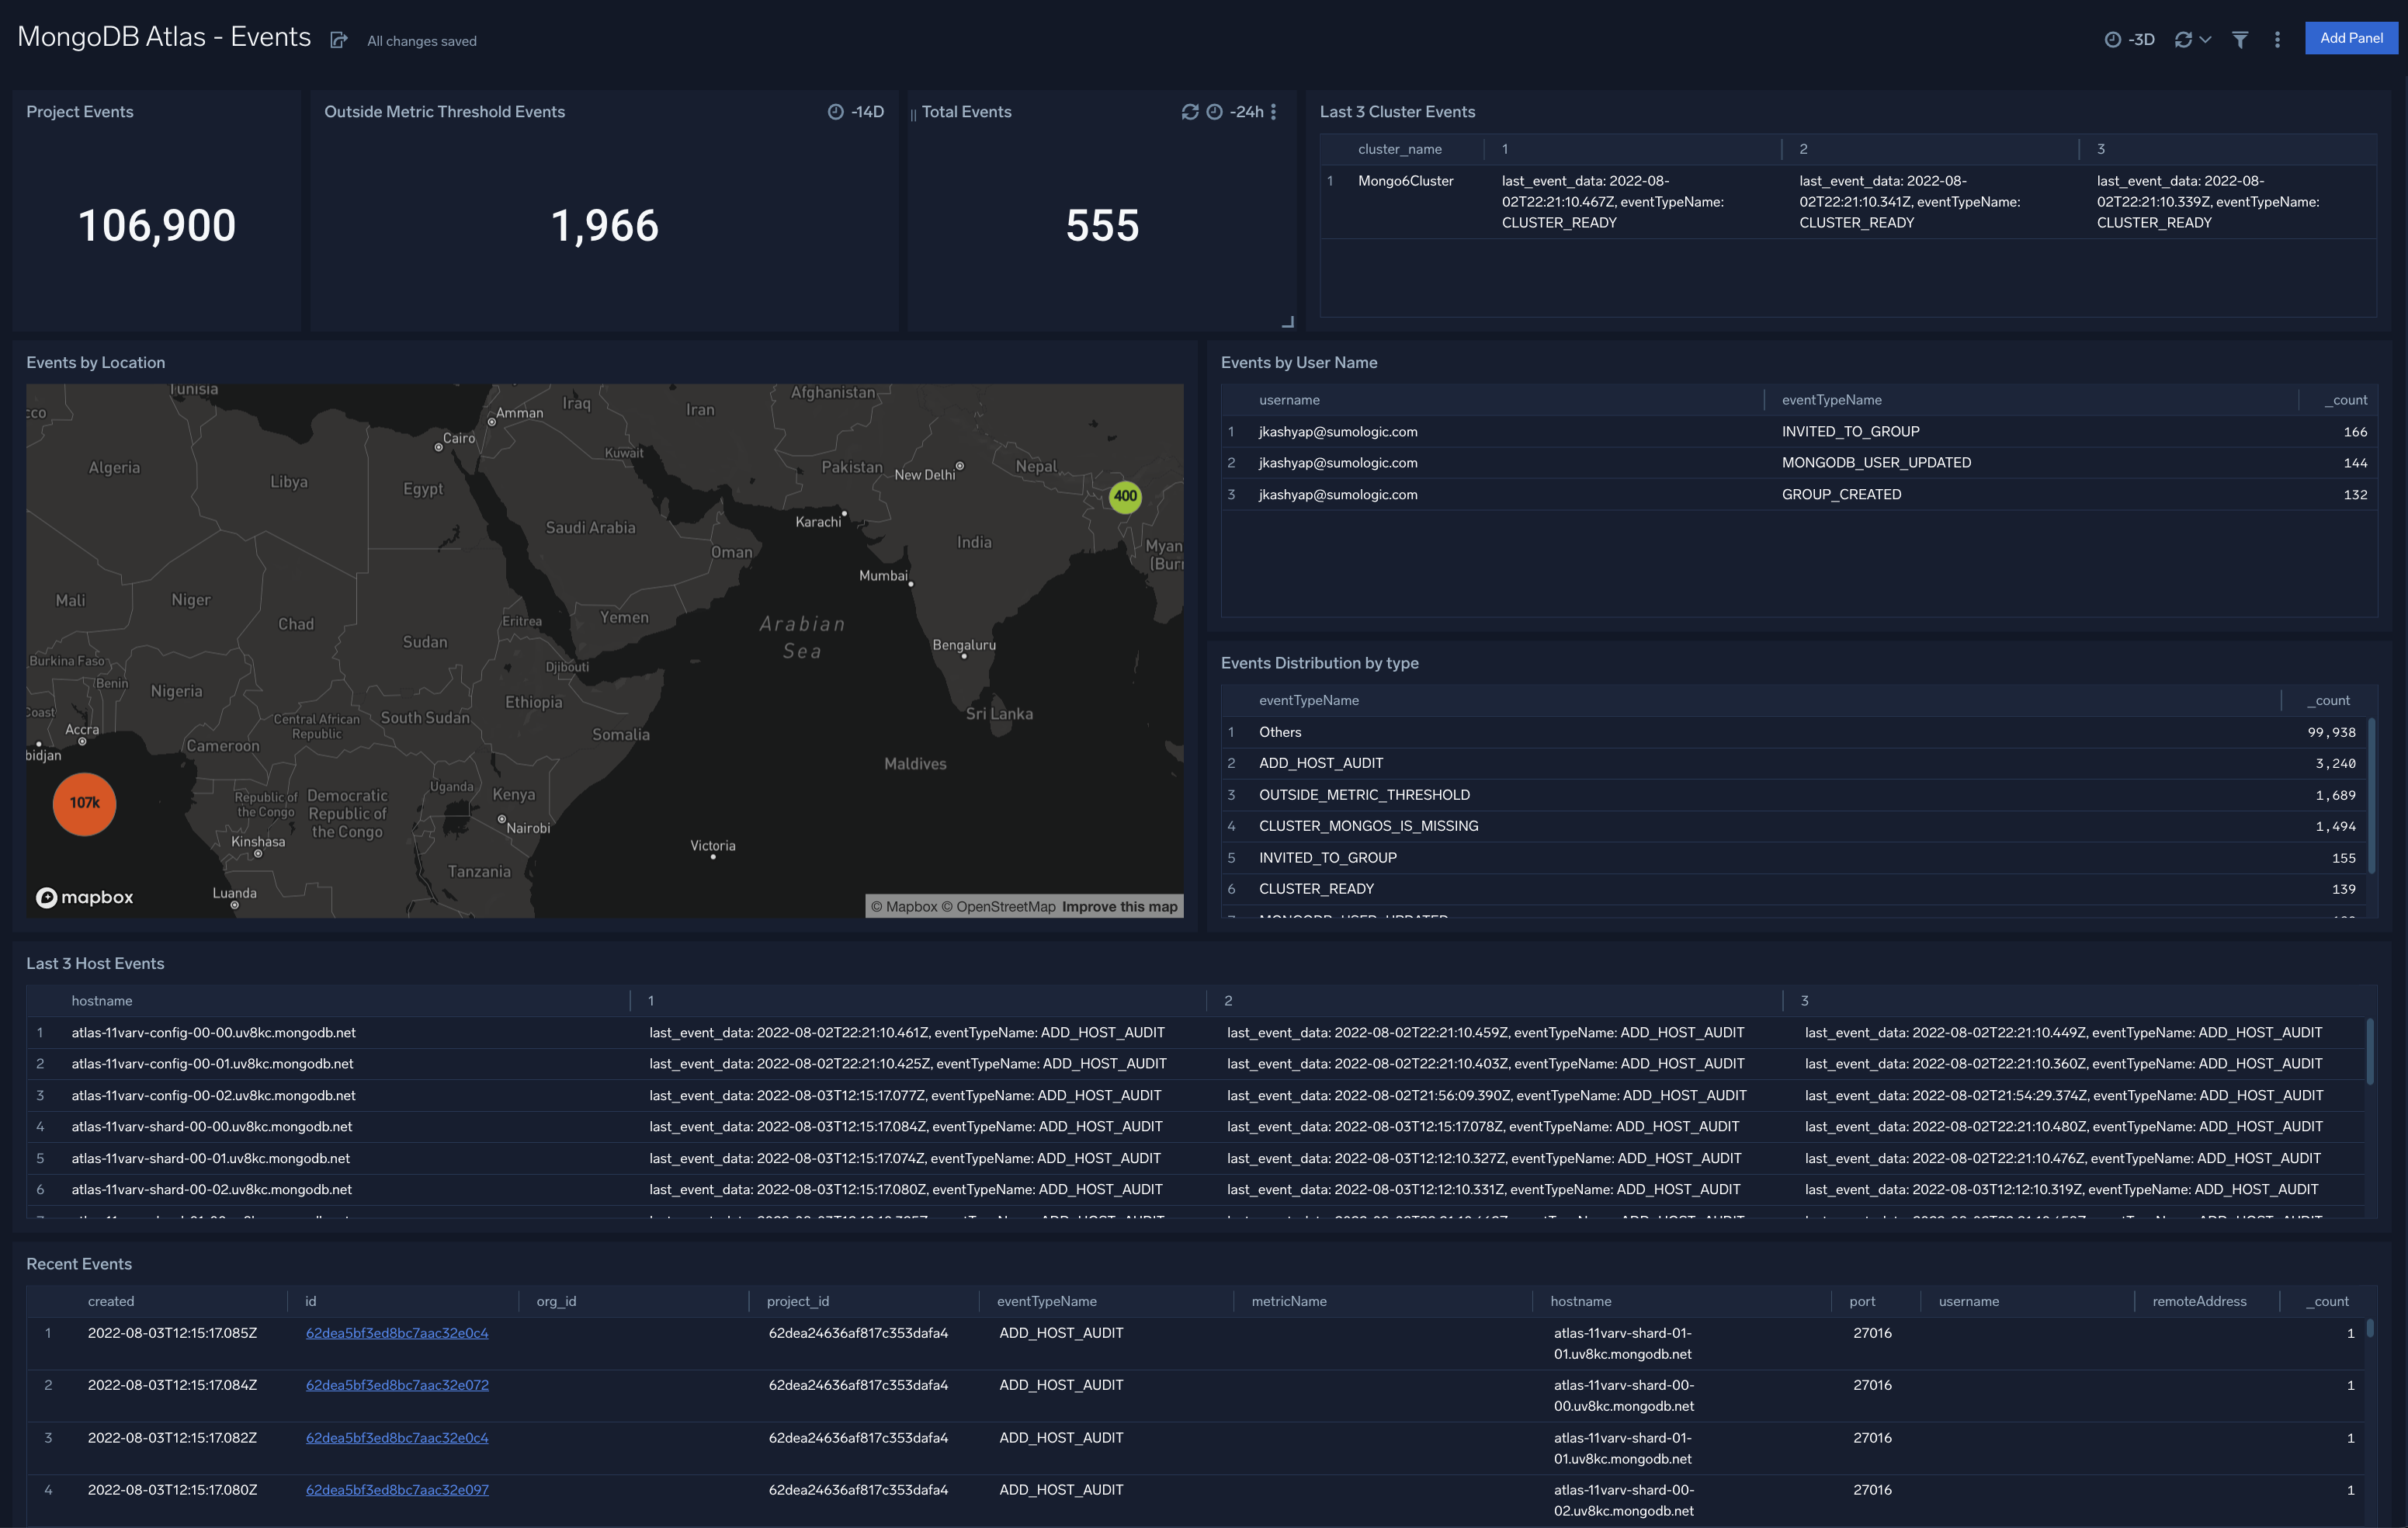
Events
The MongoDB Atlas Events dashboard provides information on Atlas project and organization-level changes. Panels show information on the type, number, location and recent events.
Use this dashboard to:
- Monitor most recent and past Atlas change events to ensure that the number and type of events are in line with expectations.
- Identify any violations in your security policies (such as users accessing Atlas without MFA).
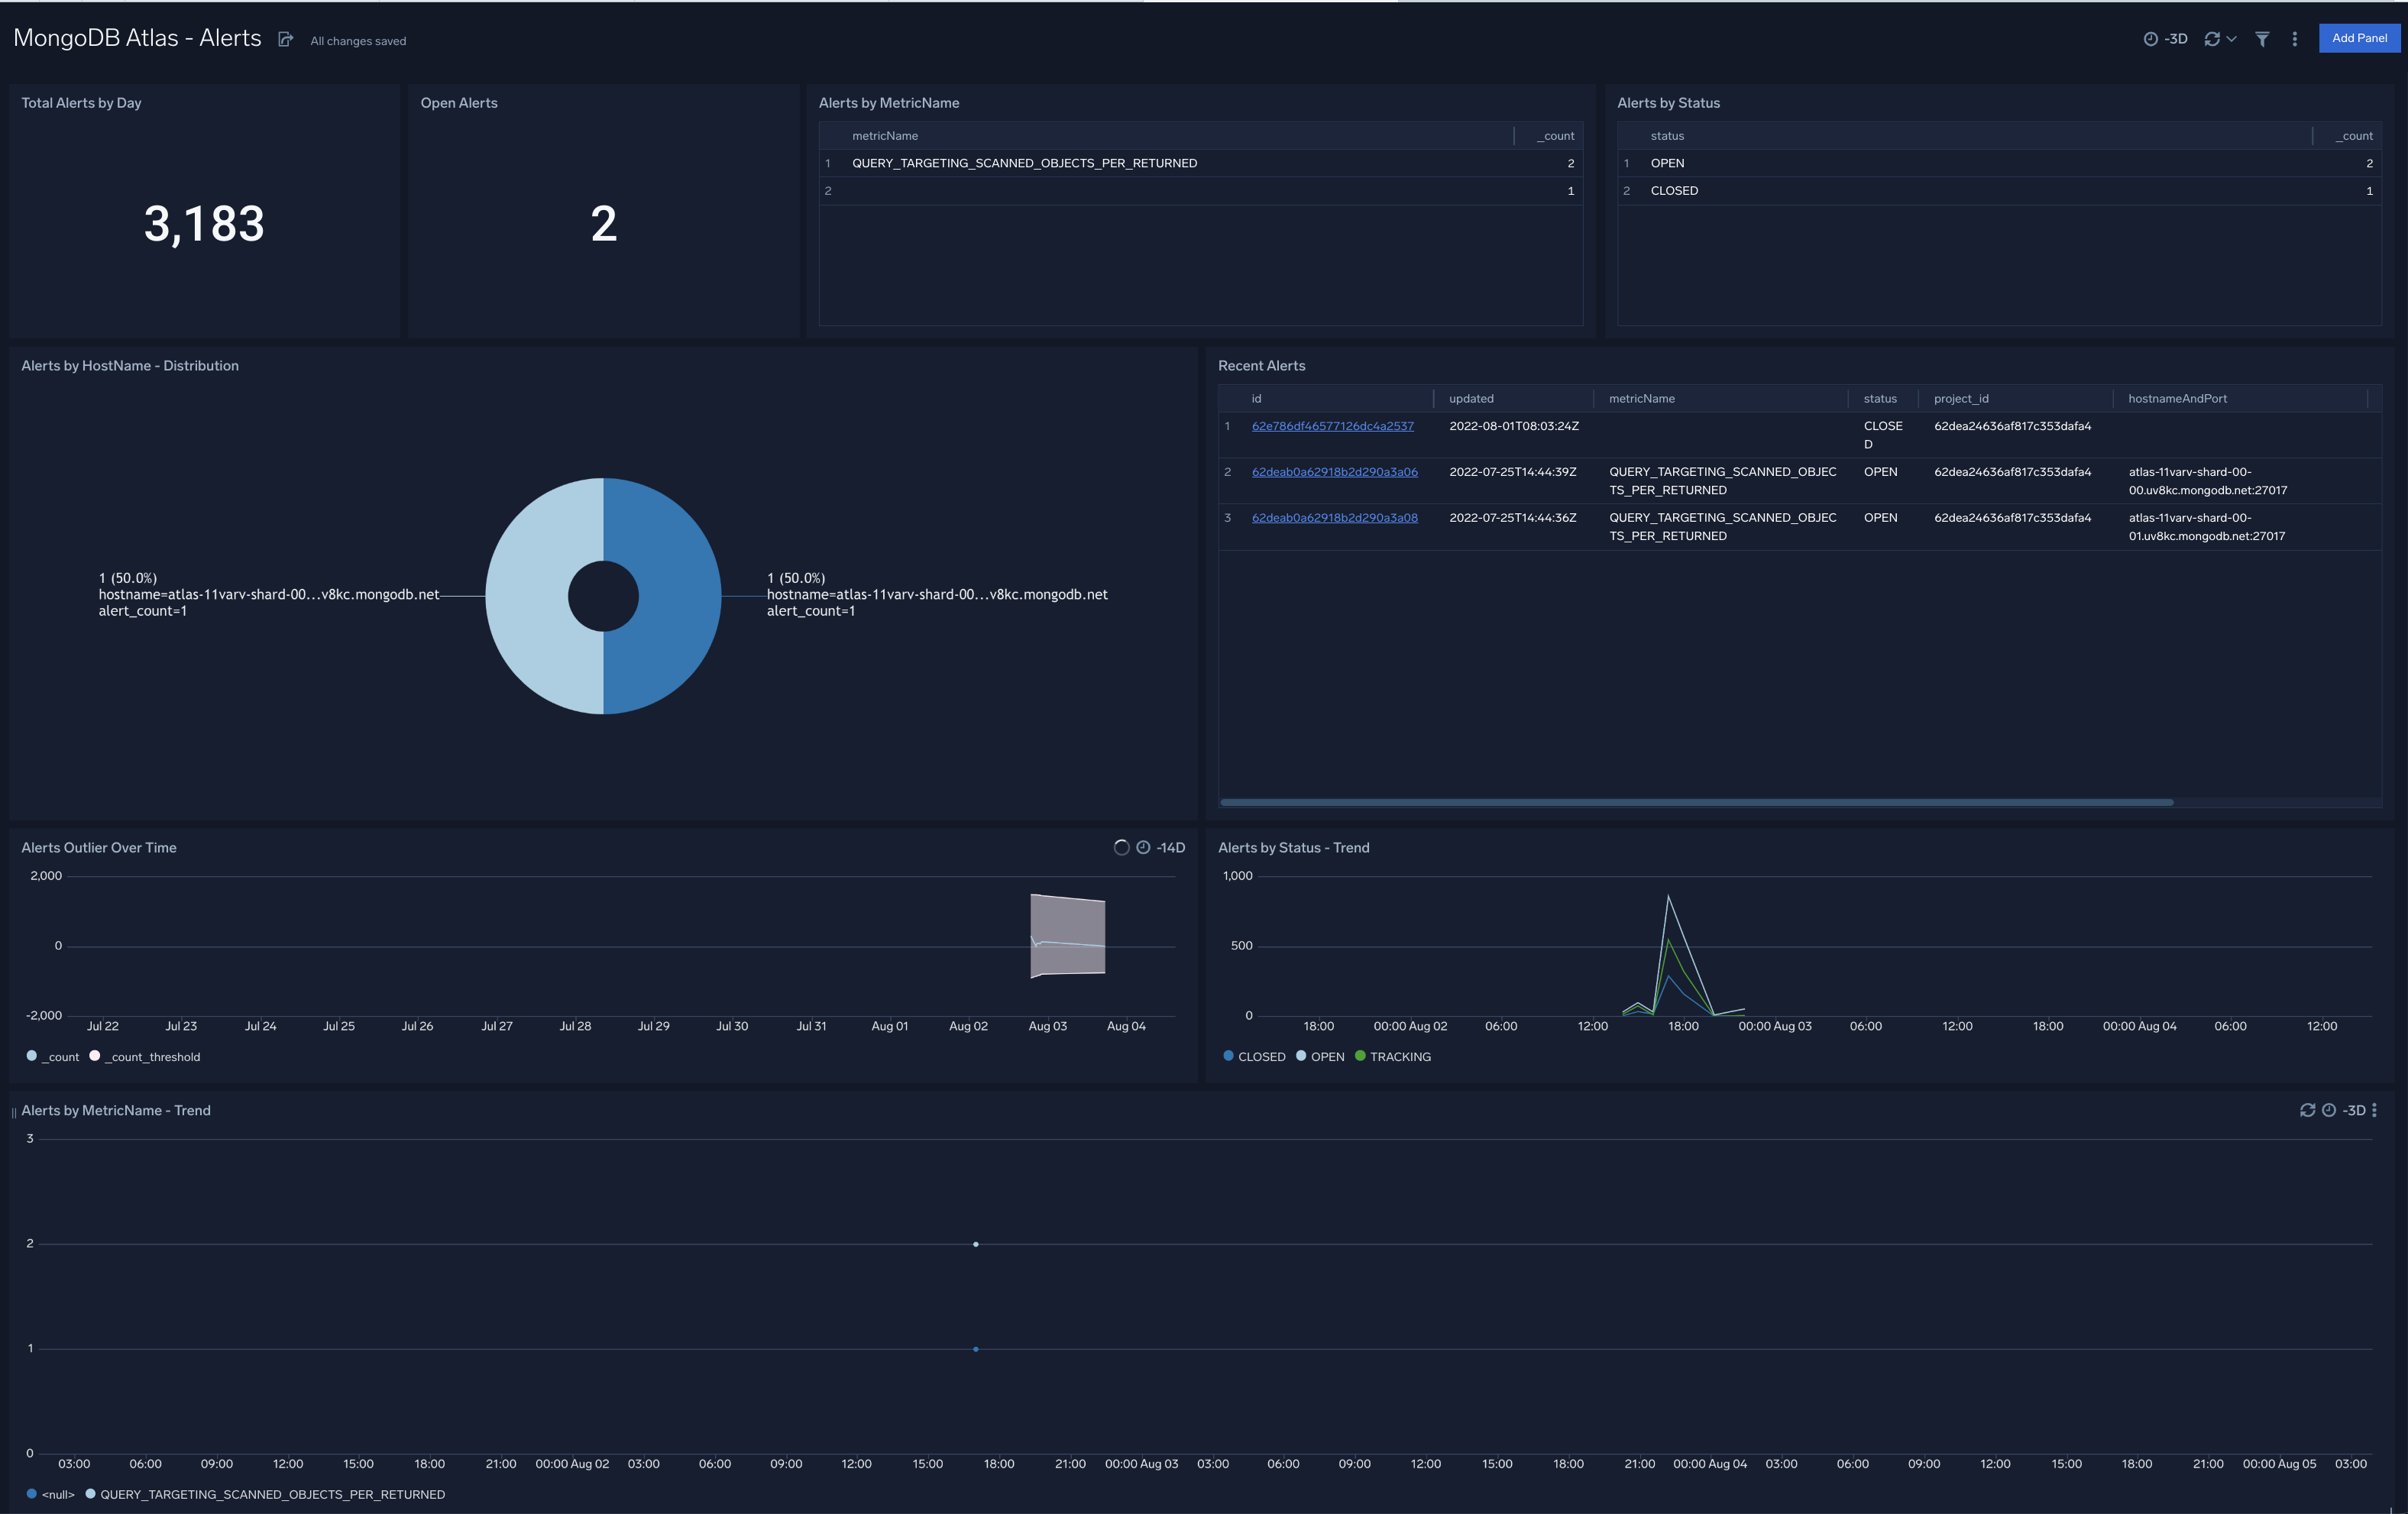
Alerts
The MongoDB Atlas Alerts dashboard provides an at-a-glance view view of alerts triggered in your Atlas environment. Panels show information around the total number and number of open alerts, recent alerts, alert types and status.
Use this dashboard to:
- Identify and address all open and recent alerts.
- Monitor unusually high number of alerts by analyzing trend graphs.
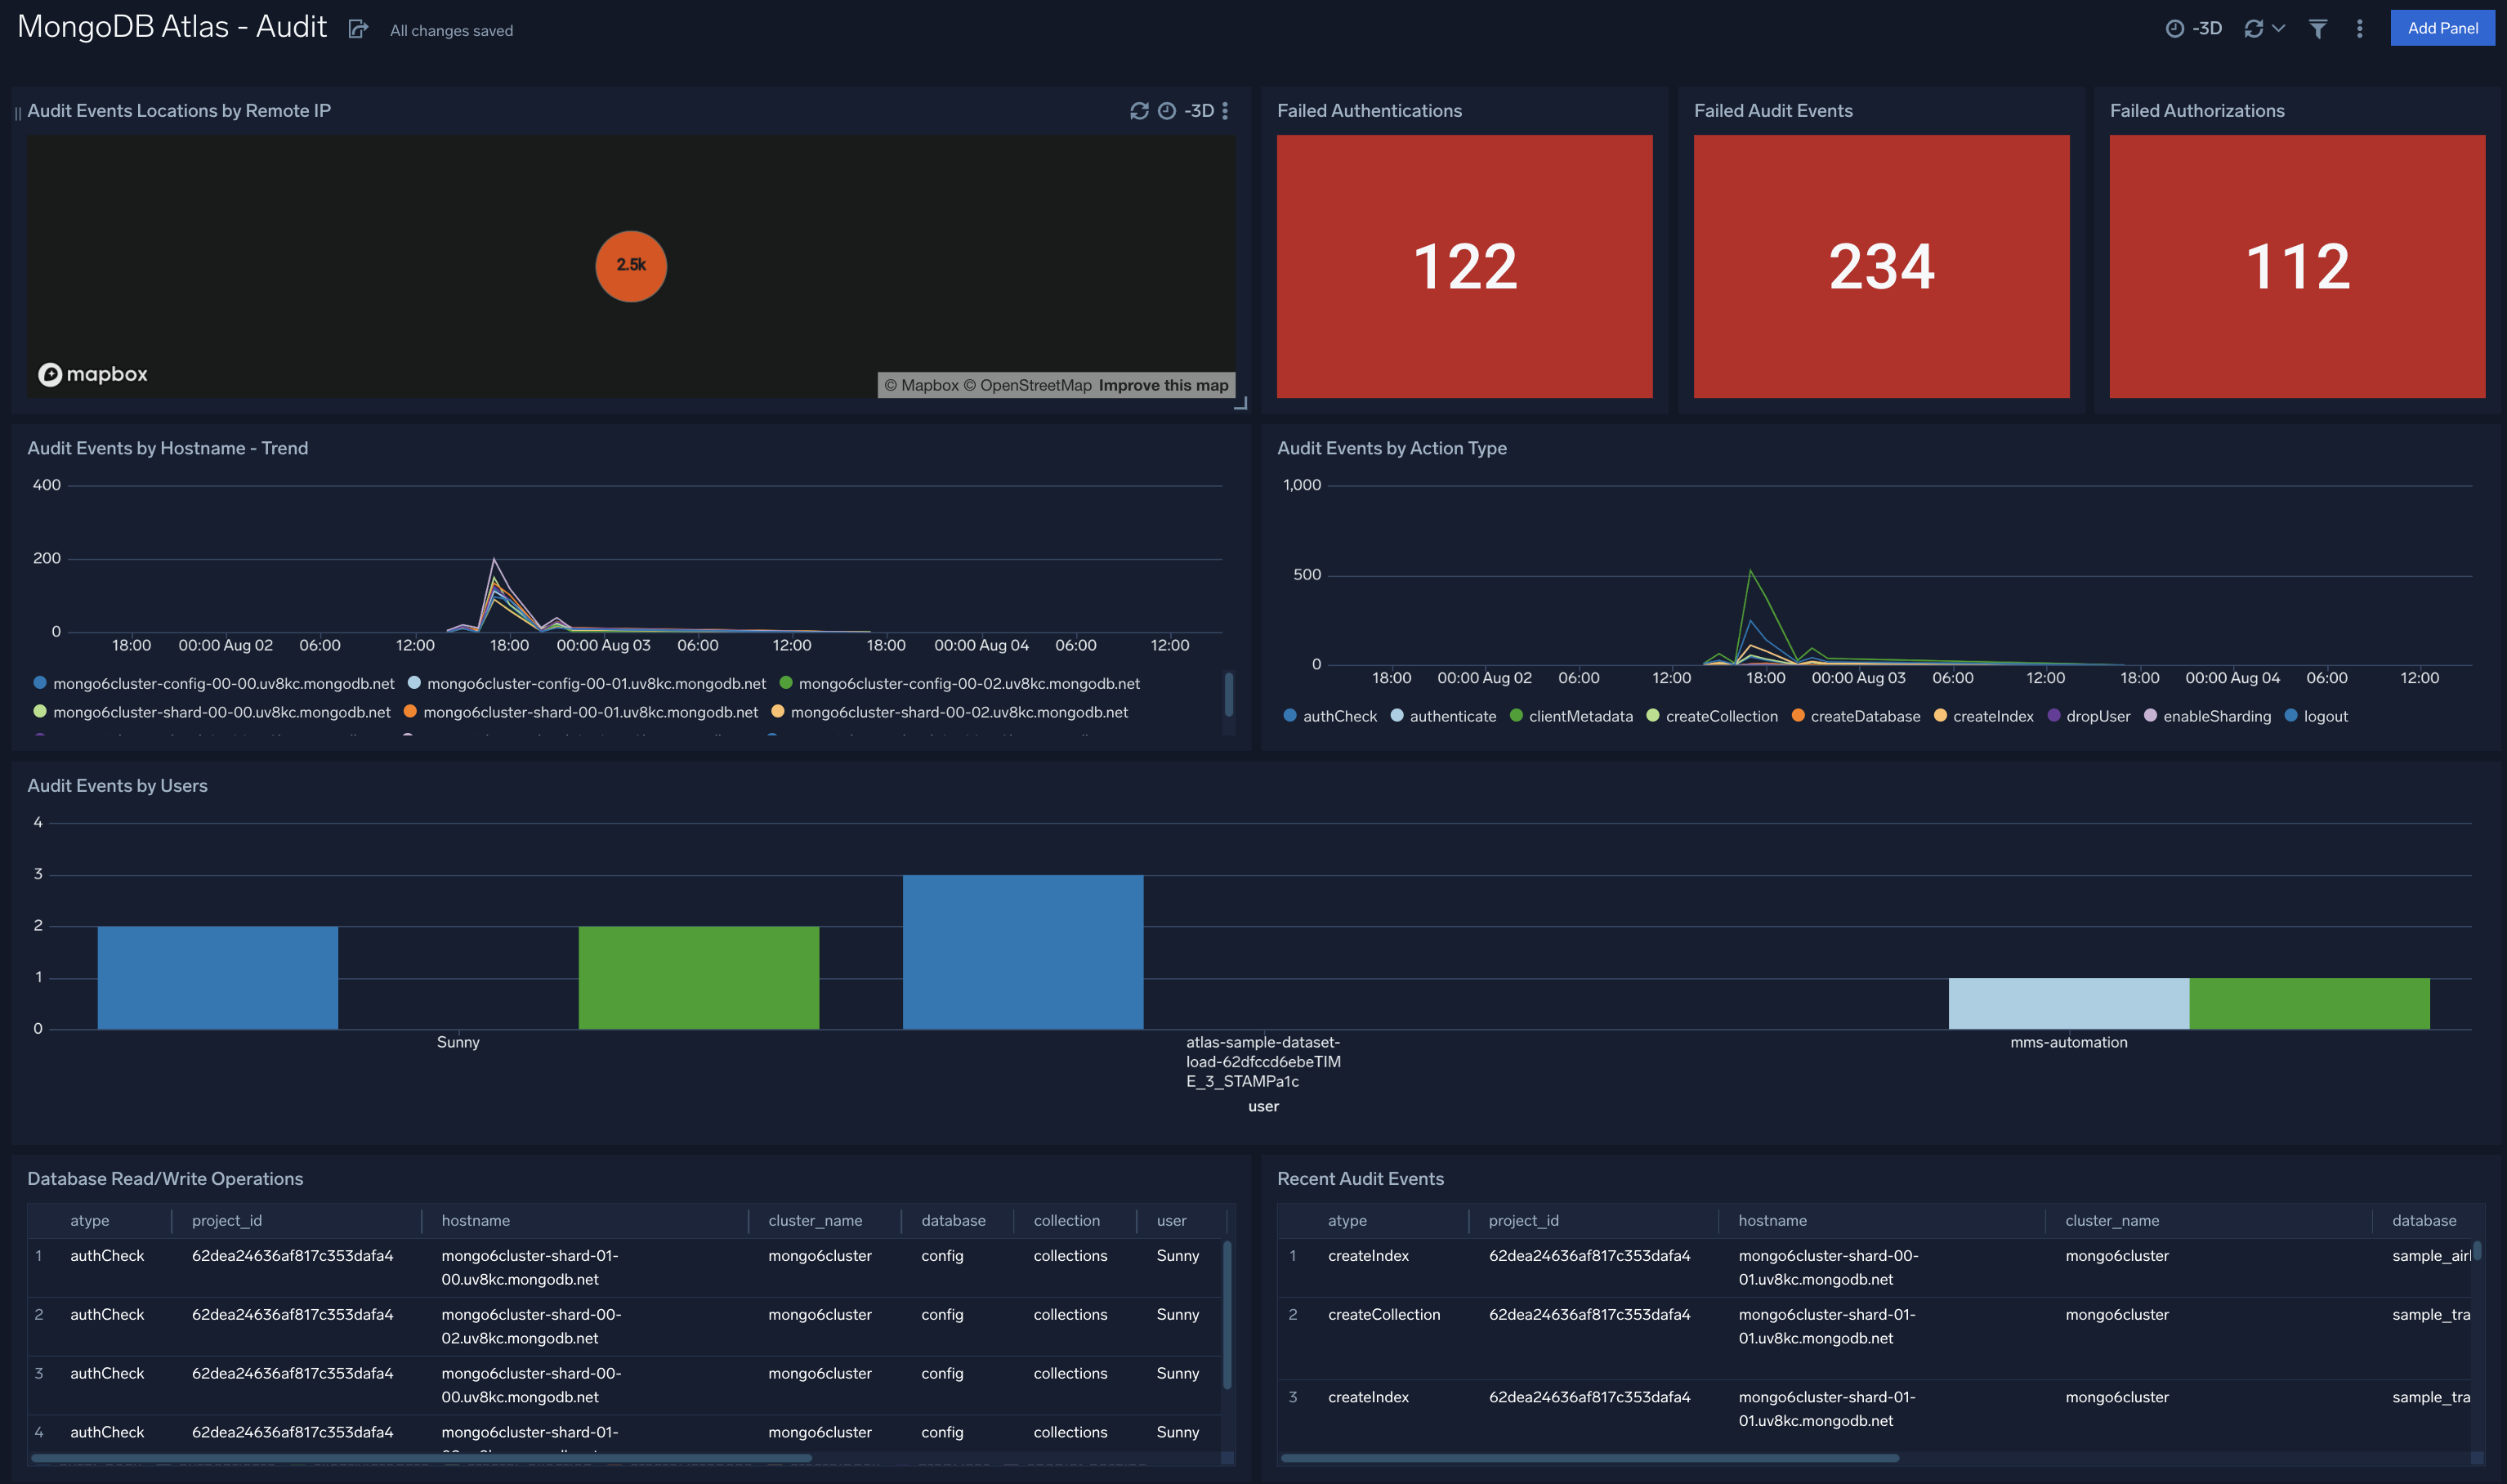
Audit
The MongoDB Atlas Audit dashboard provides information around security events in your Atlas environment such as failed authentication, authorization and audit events, audit event trends, and originating geographic locations. Panels also display details on audit events by action type and user, and recent audit events by created and deleted resources.
Use this dashboard to:
- Identify unusually high number of eventsfailed eventby analyzing trend graphs.
- Identify most affected hosts and users associated with failed audit events.
- Monitor most recent audit events and database operations to ensure they are in line with expectations.
- Track database read and write operations, spikes in failed events, as well as the users who performed the events.
Performance dashboards
Performance dashboards provide visual representations of key MongoDB Atlas metrics. You can use this data to correlate system health and performance and use Atlas logs to identify and fix the root cause of any problems. These dashboards are also provide the ability to fine tune your queries and database operations.
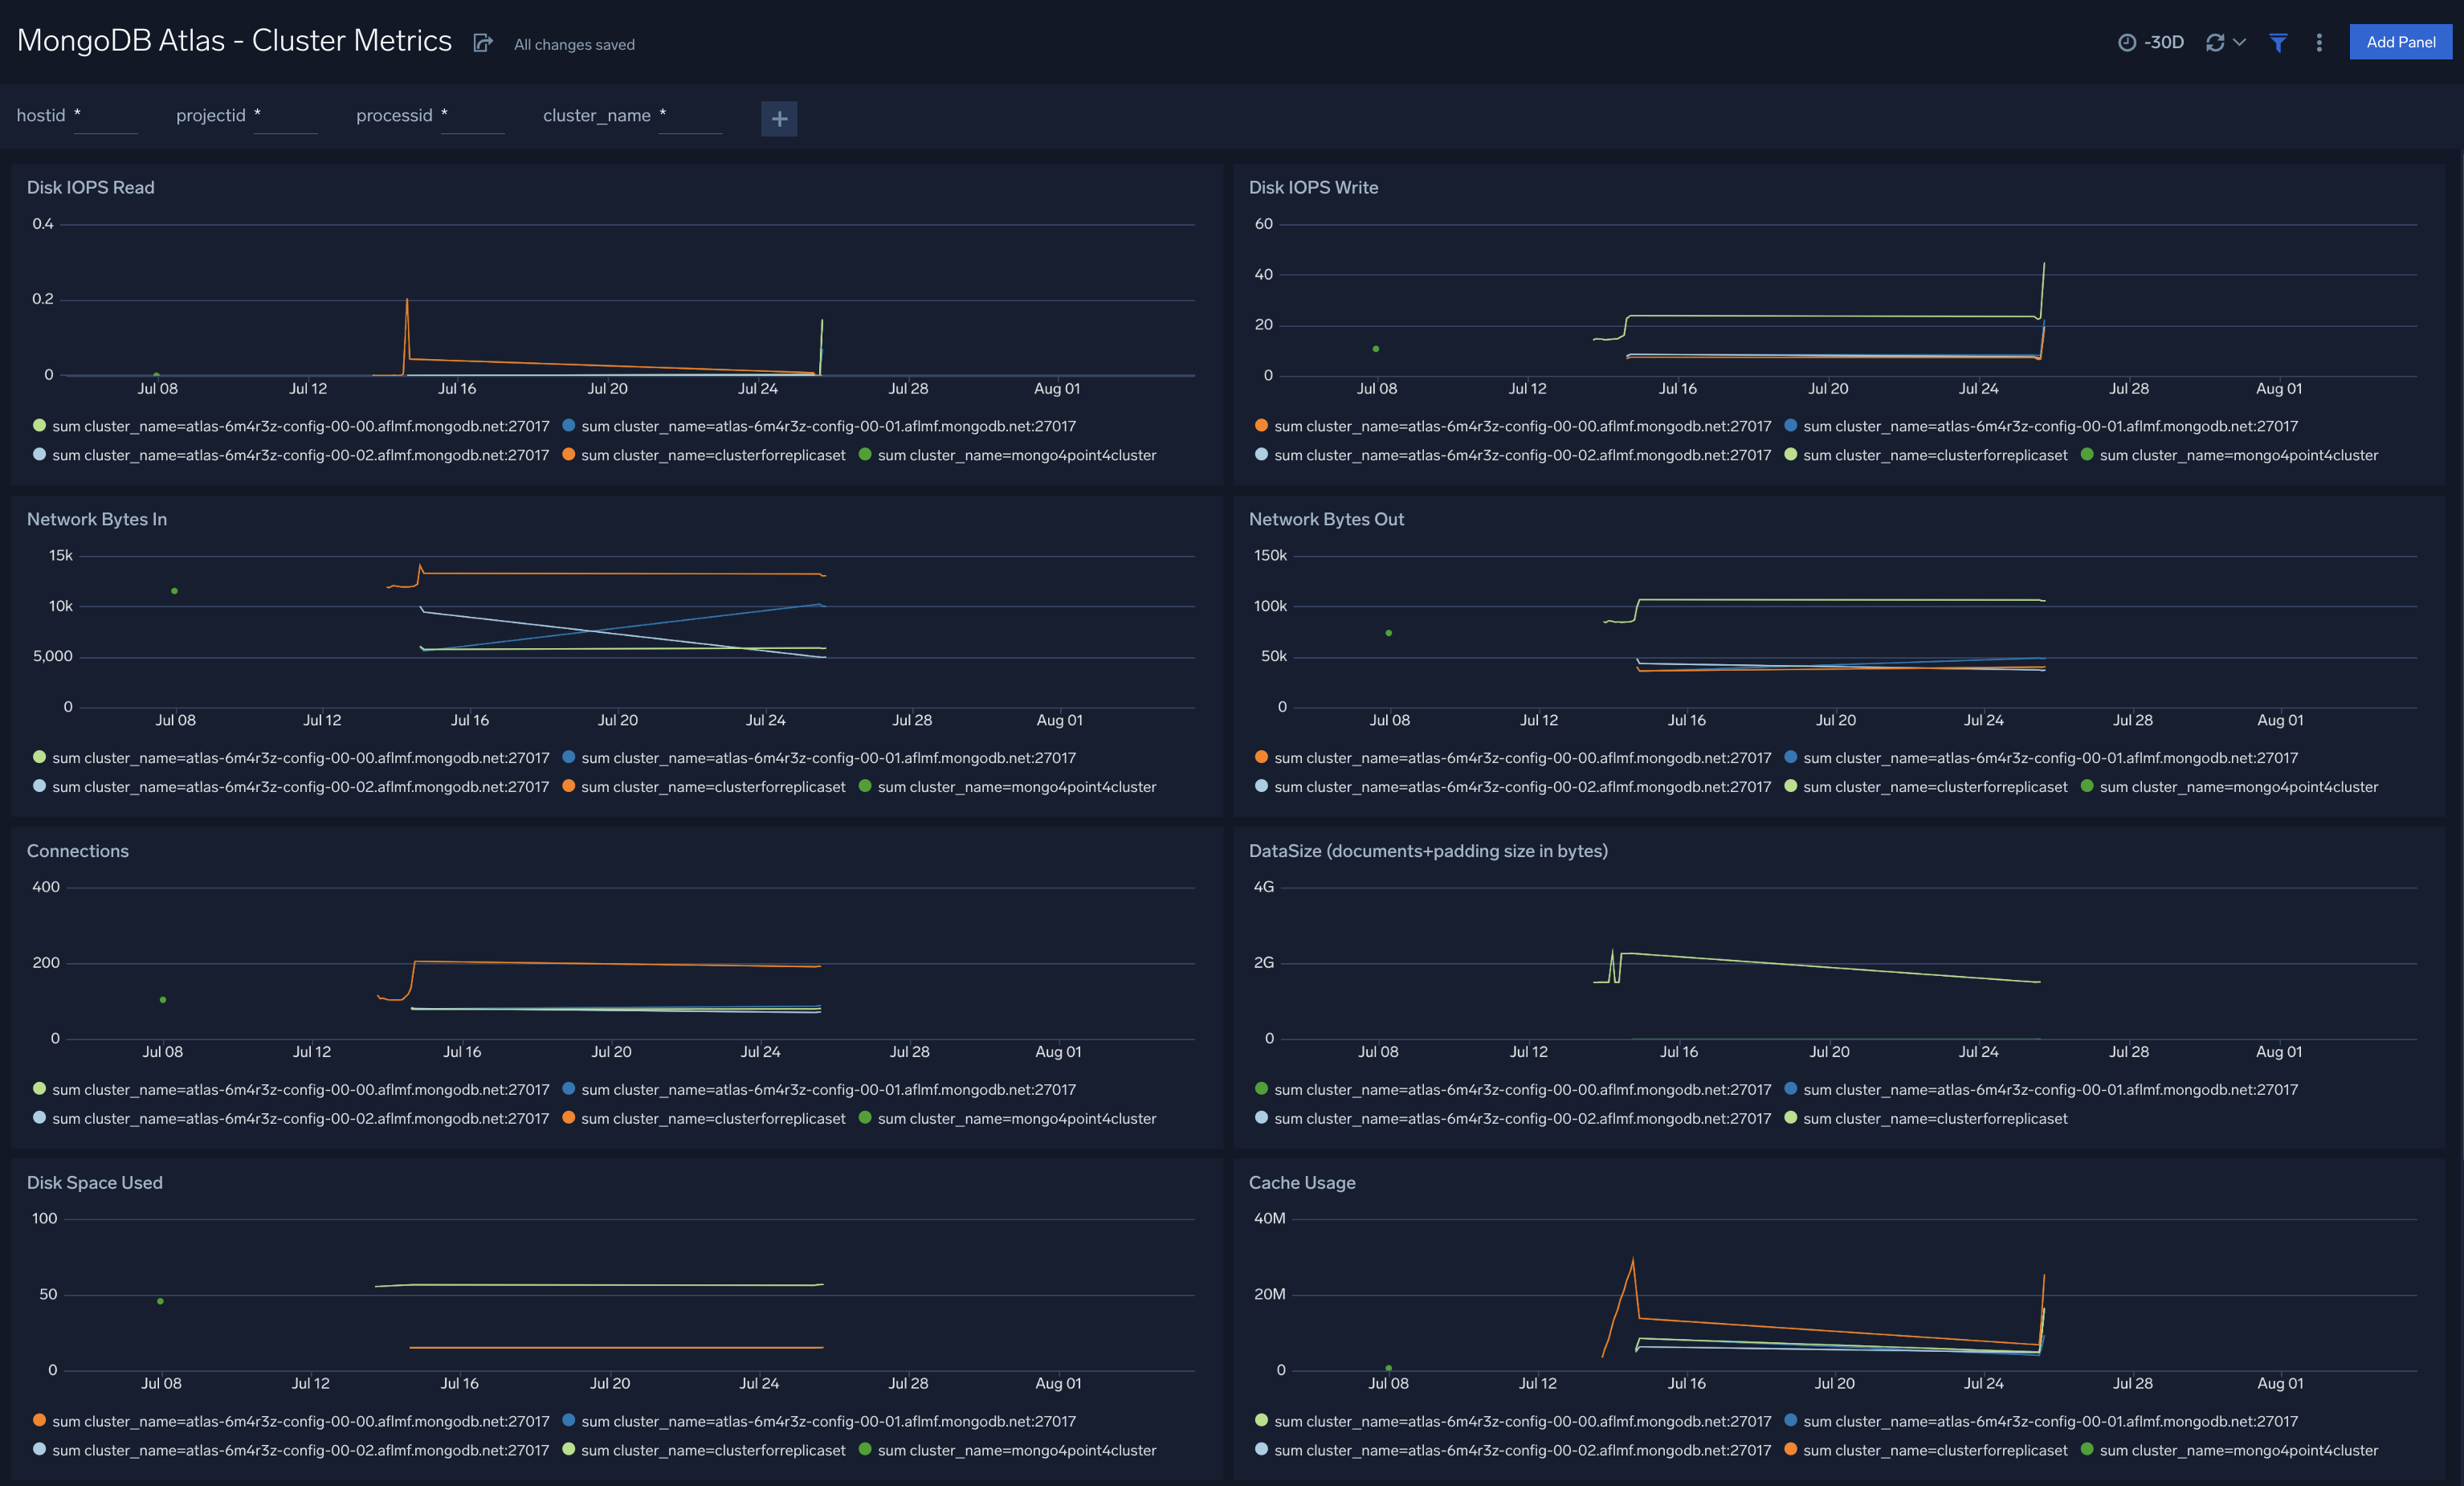
Cluster Metrics
The MongoDB Atlas - Cluster Metrics dashboard provides a high-level view of cluster performance, disk and cache usage. Panel graphs show details for read and write operations and their execution times, network traffic, connections, data sizes, and disk read and write IOPs.
Use this dashboard to:
- Identify anomalous changes in database metrics.
- Monitor resource usage and determine how to optimize your Atlas databases and clusters.
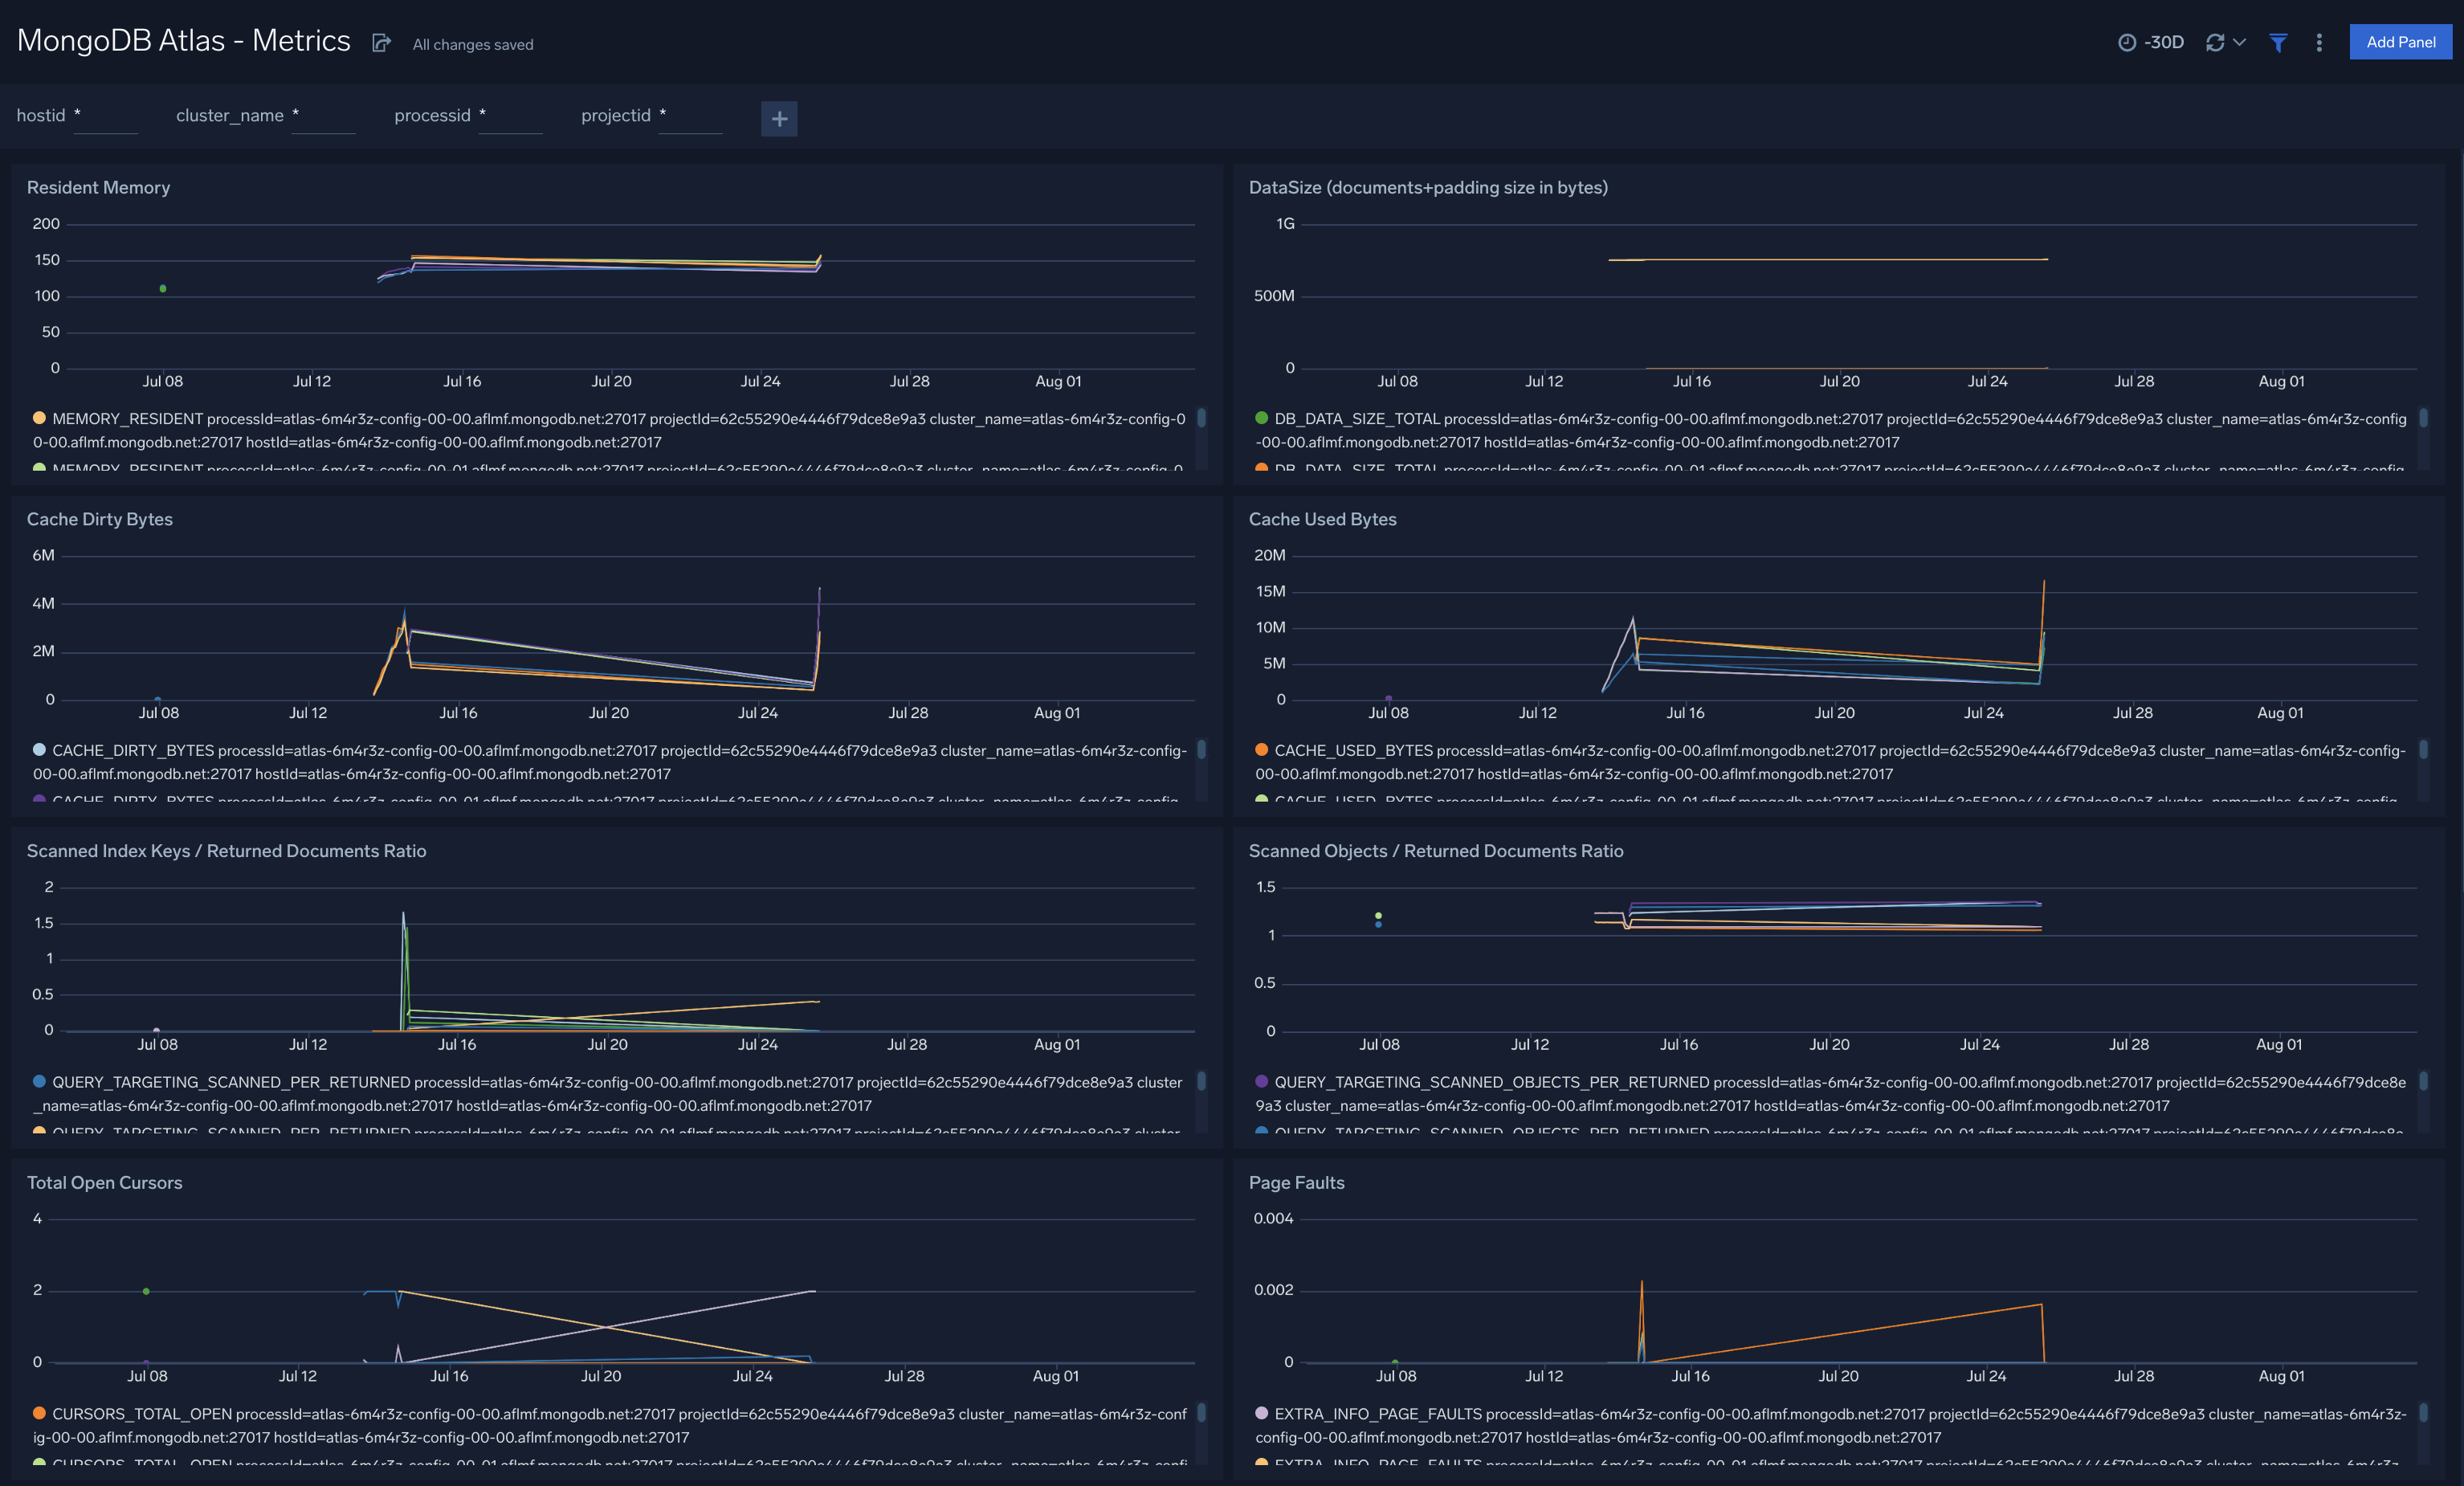
Metrics
The MongoDB Atlas Metrics dashboard provides an at-a-glance view of database performance with graphs showing memory availability, data size, cache in bytes, and returned document ratios.
Use this dashboard to:
- Determine node health based on page faults, cache dirty bytes, replication headroom, queued operations, and disk write latency.
- Monitor resource usage (cache and disk) and active connections. You can set up alerts for notification on these metrics.
- Drill-down into the underlying queries and correlate performance metrics with underlying logs to identify the root cause of performance degradations.
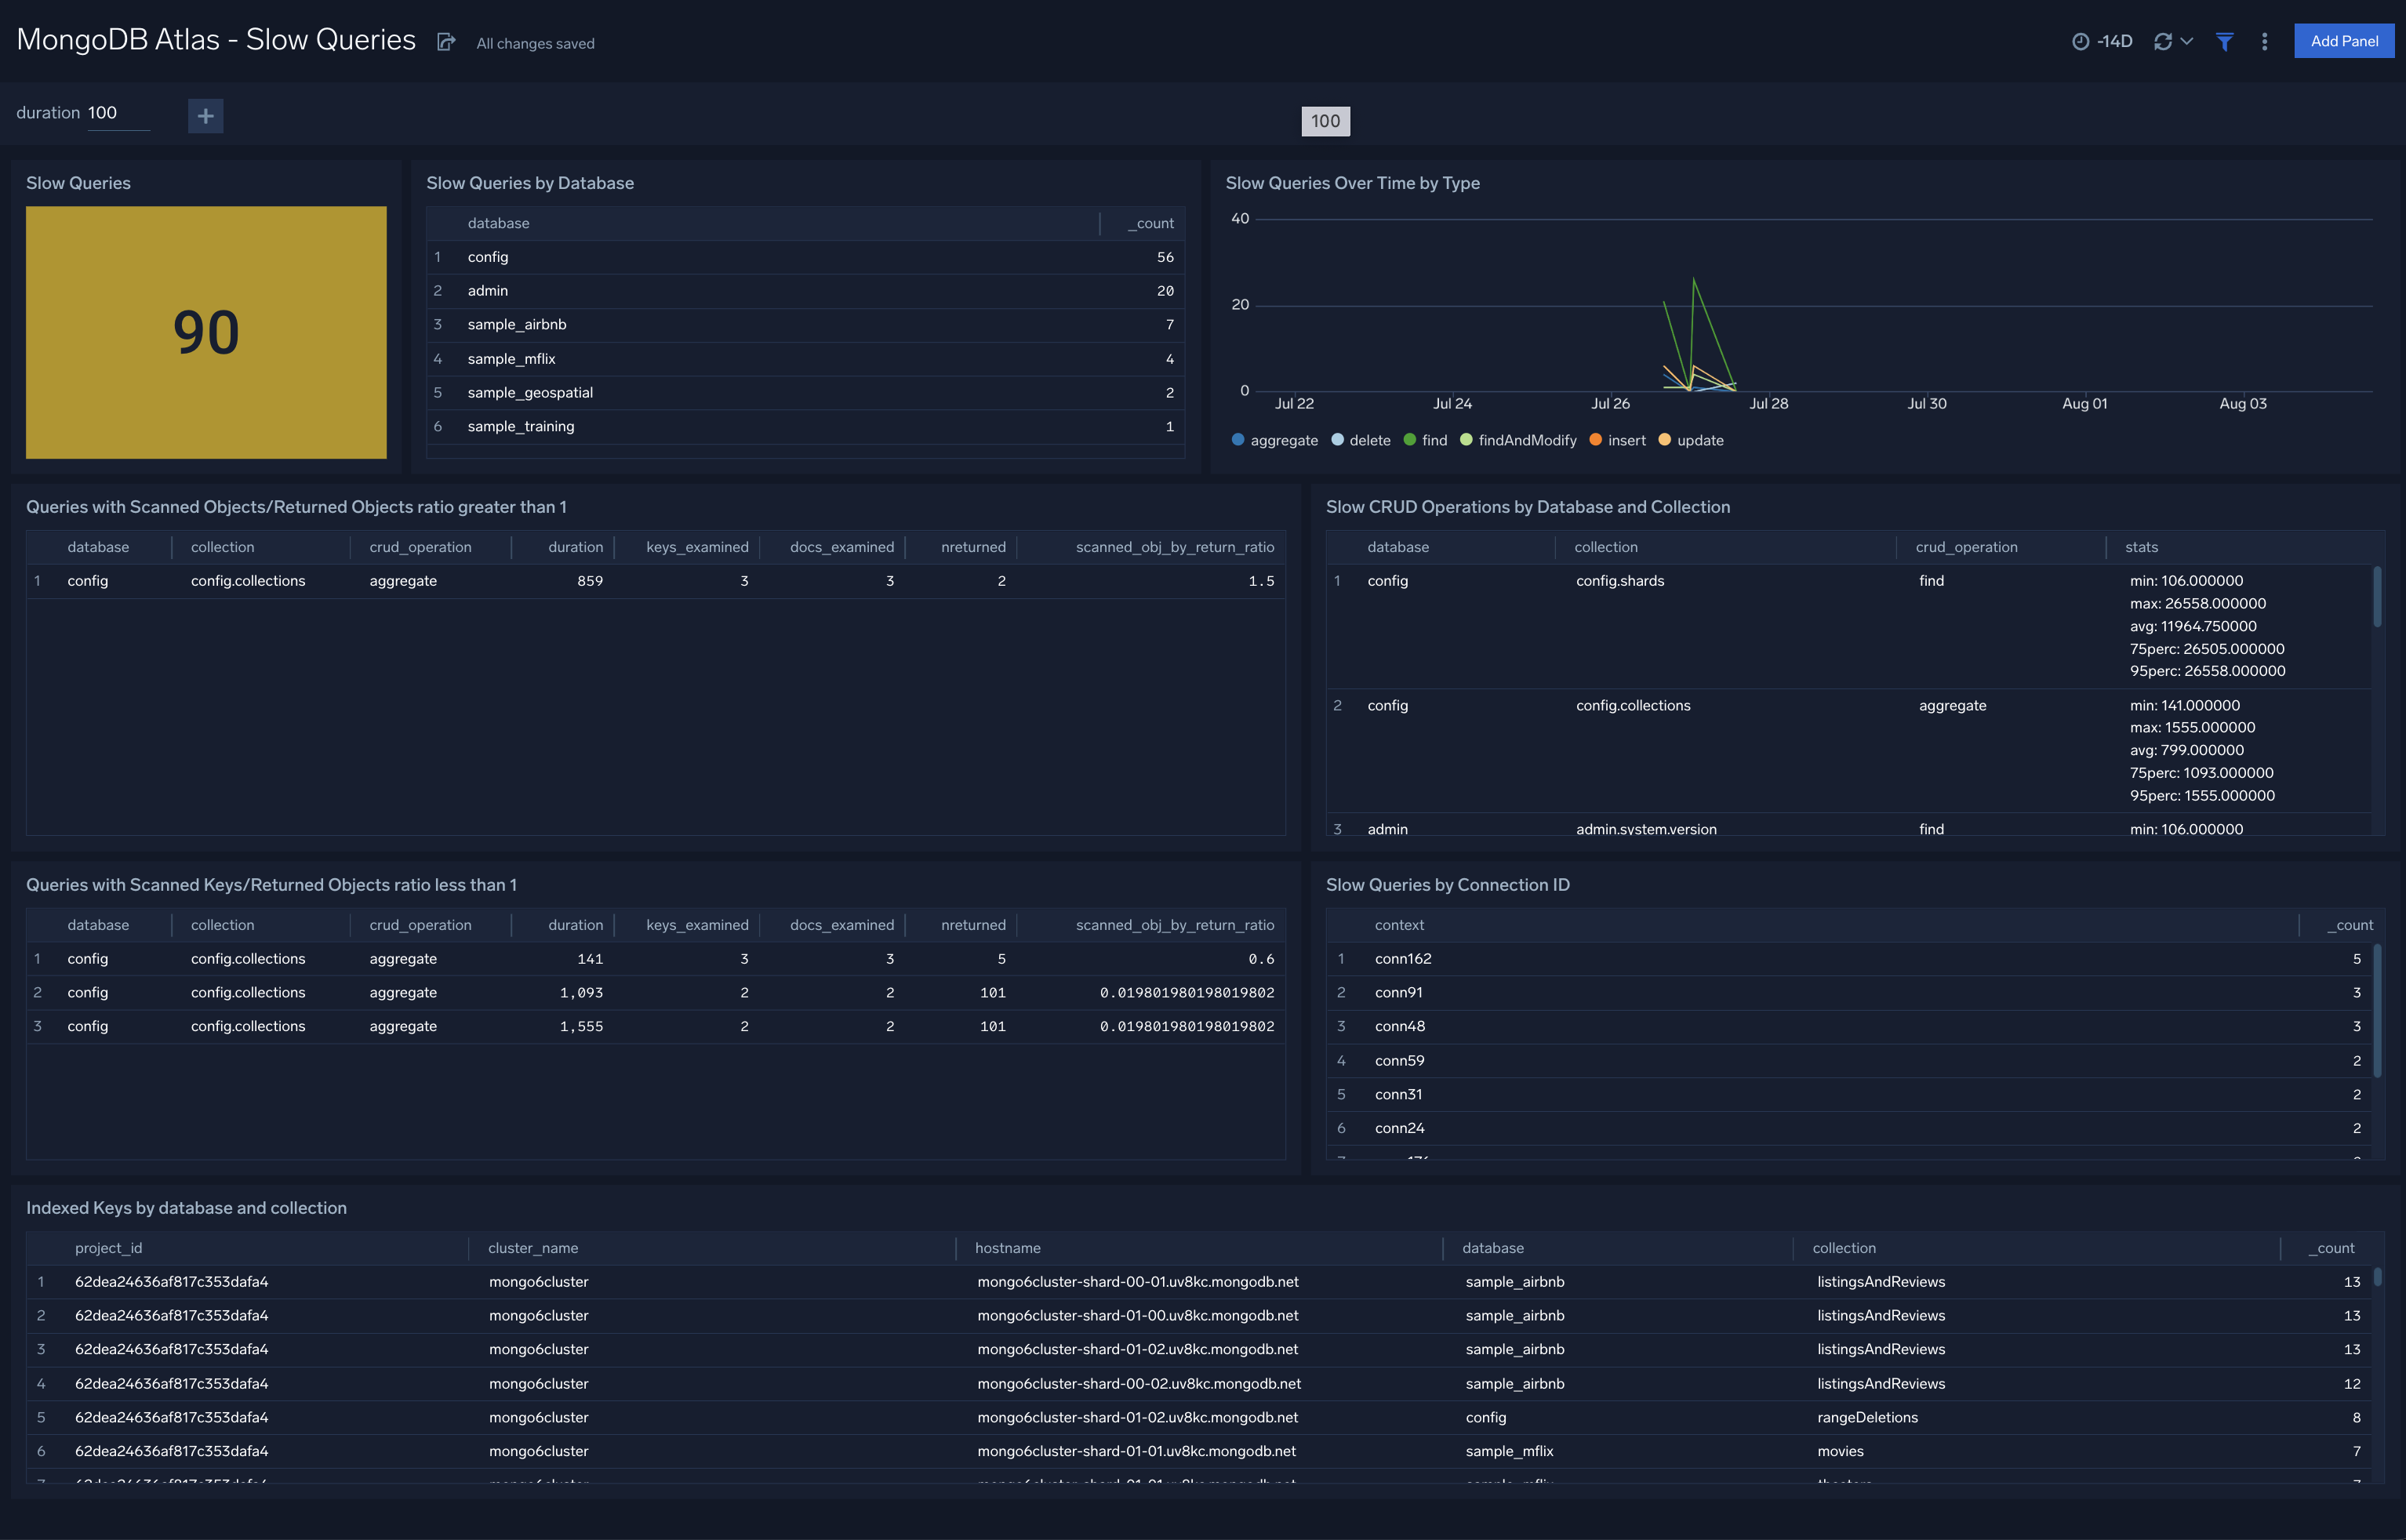
Slow Queries
The MongoDB Atlas Slow Queries dashboard provides details on the number of slow queries by type,trends, and slow server status.
Use this dashboard to:
- Identify and fix slow queries.
- Identify changes in the number and types of slow queries by analyzing trends.
- Identify databases, connections collections experiencing slow queries.
- Determine queries and operations that are using Scanned Objects/Returned objects and Keys Scanned Keys/Returned objects ratios to identify the potential fields for indexing.
Operations dashboards
The Operations dashboards monitor database operations, such as indexing, sharding, and replication. These dashboards allow you to view detailed error logs for troubleshooting and track login activities in your database including failed attempts.
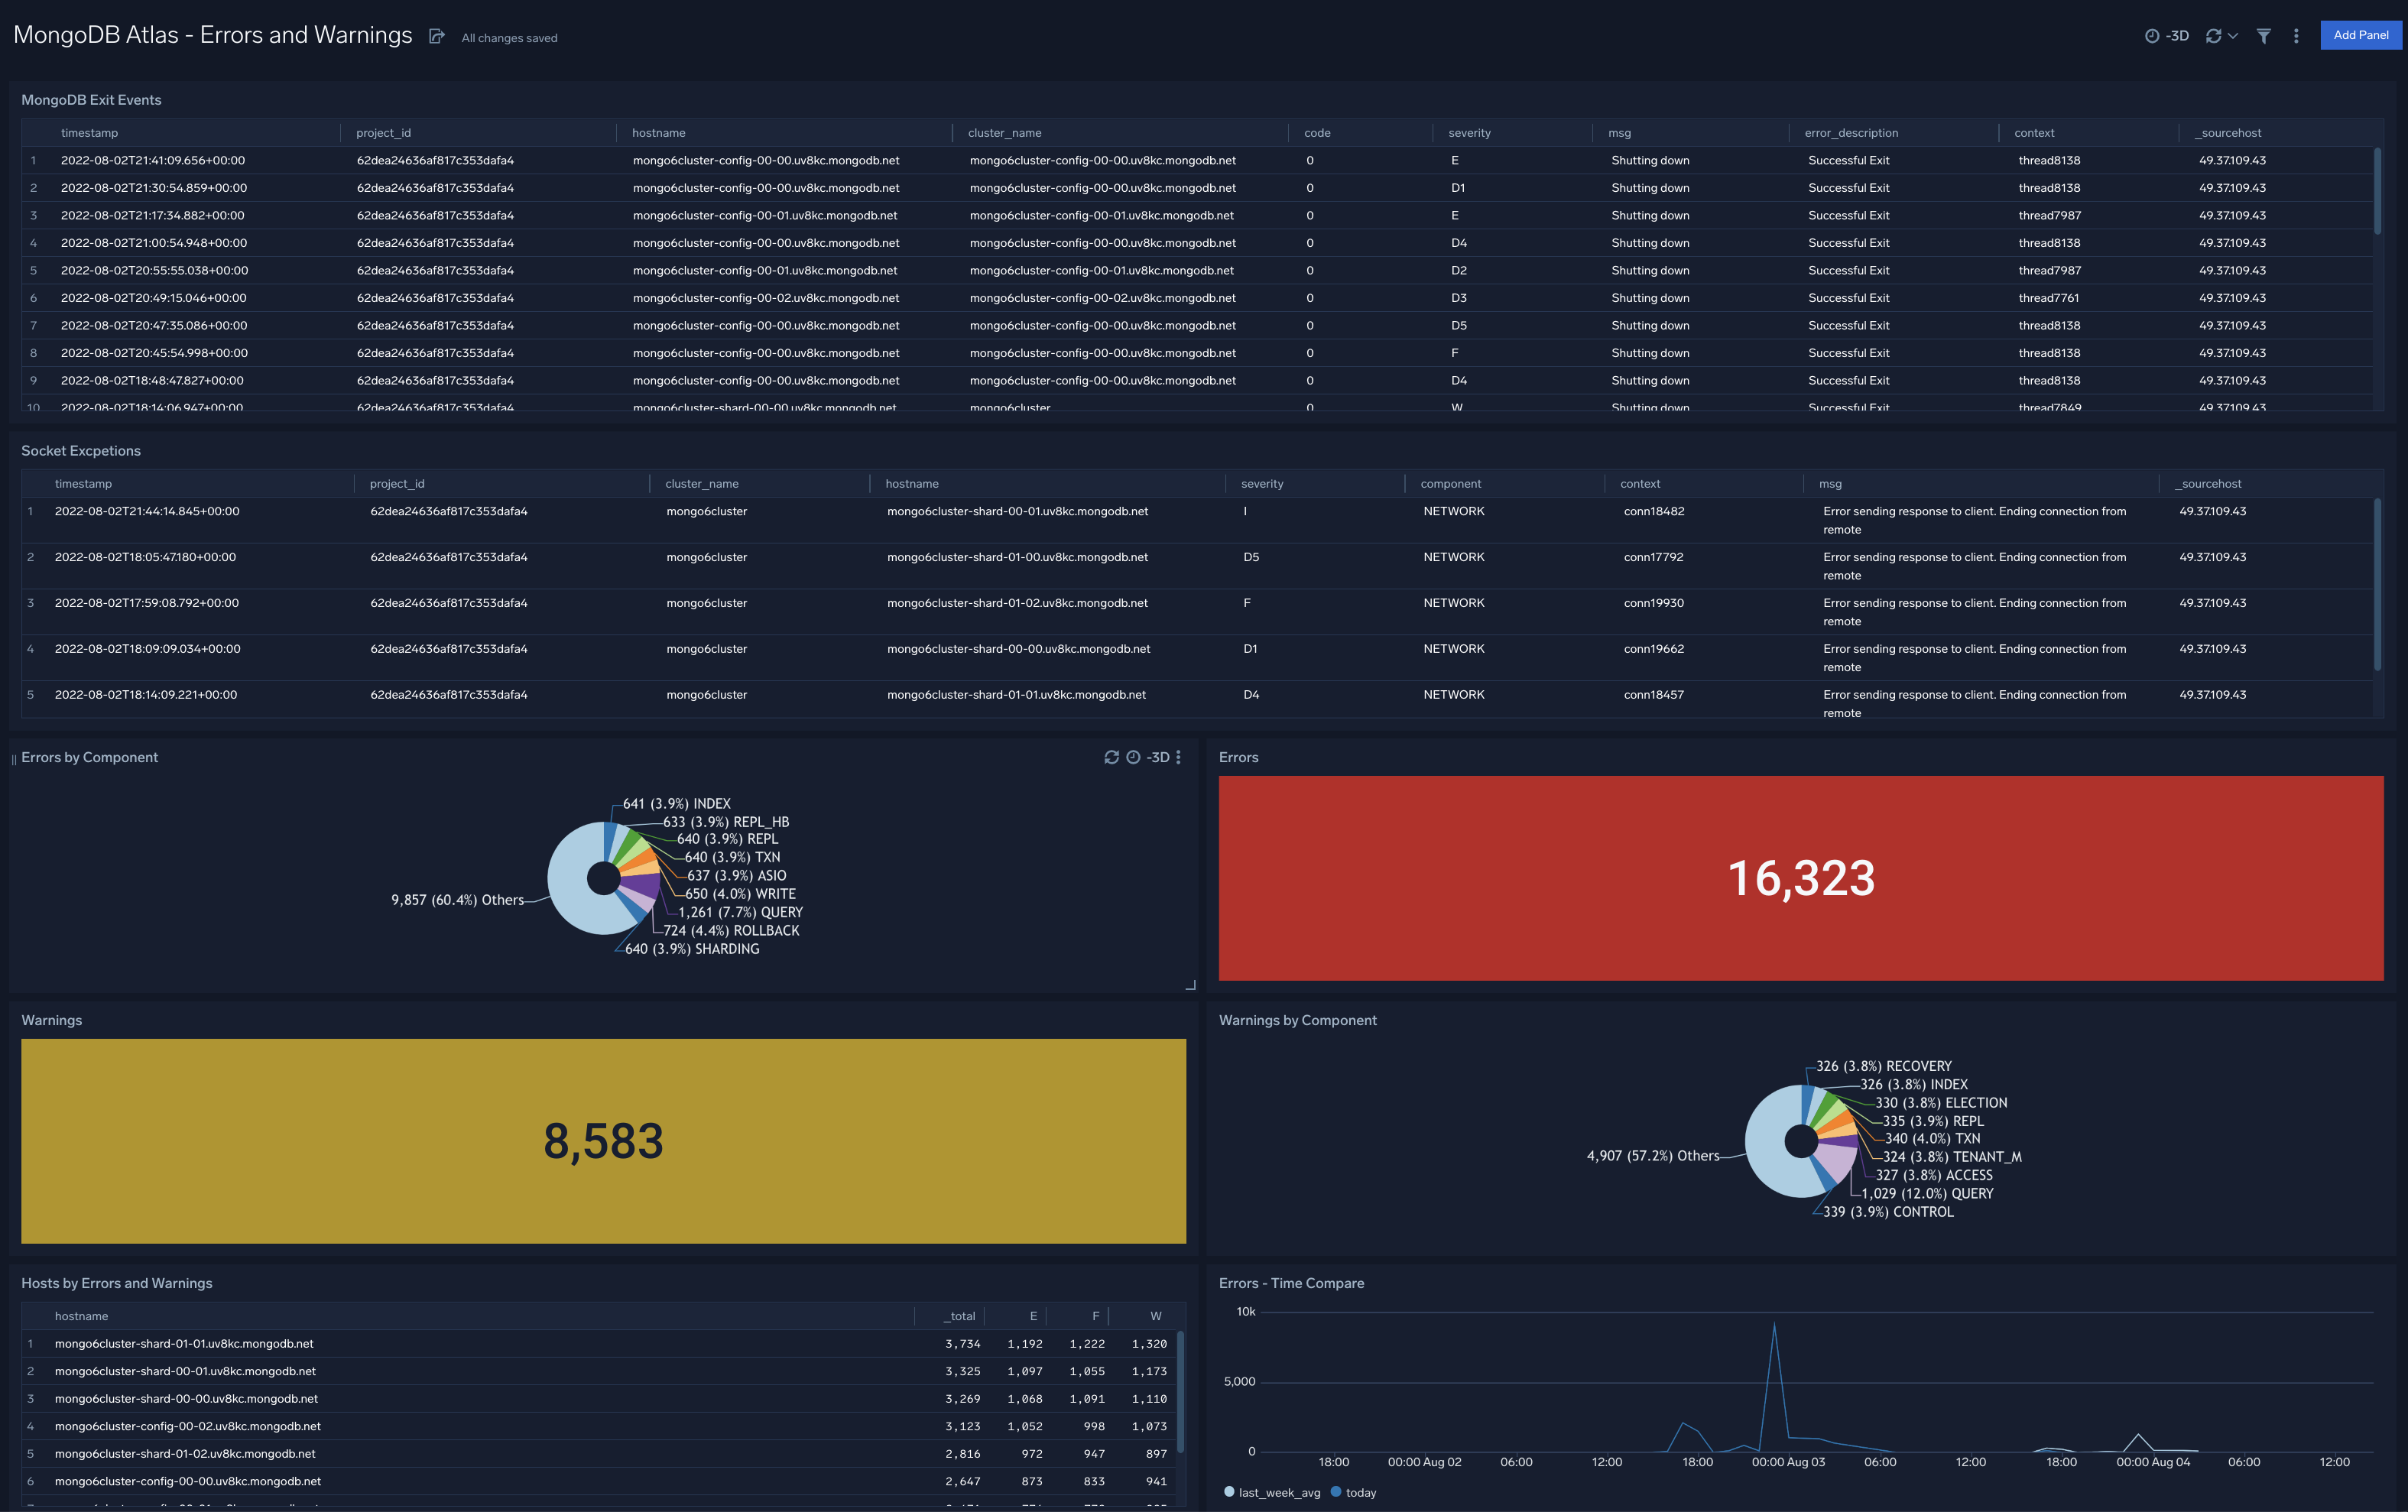
Errors and Warnings
The MongoDB Atlas Errors and Warnings dashboard provides information on errors, warnings by component, severity and type.. Panels also show information on daily error and warning summaries, socket exceptions, timeout events, and MongoDB exit events.
Use this dashboard to:
- Identify and fix errors and warnings.
- Troubleshoot problems in your cluster by analyzing errors and warnings.
- Identify hosts with most errors and correct issues accordingly.
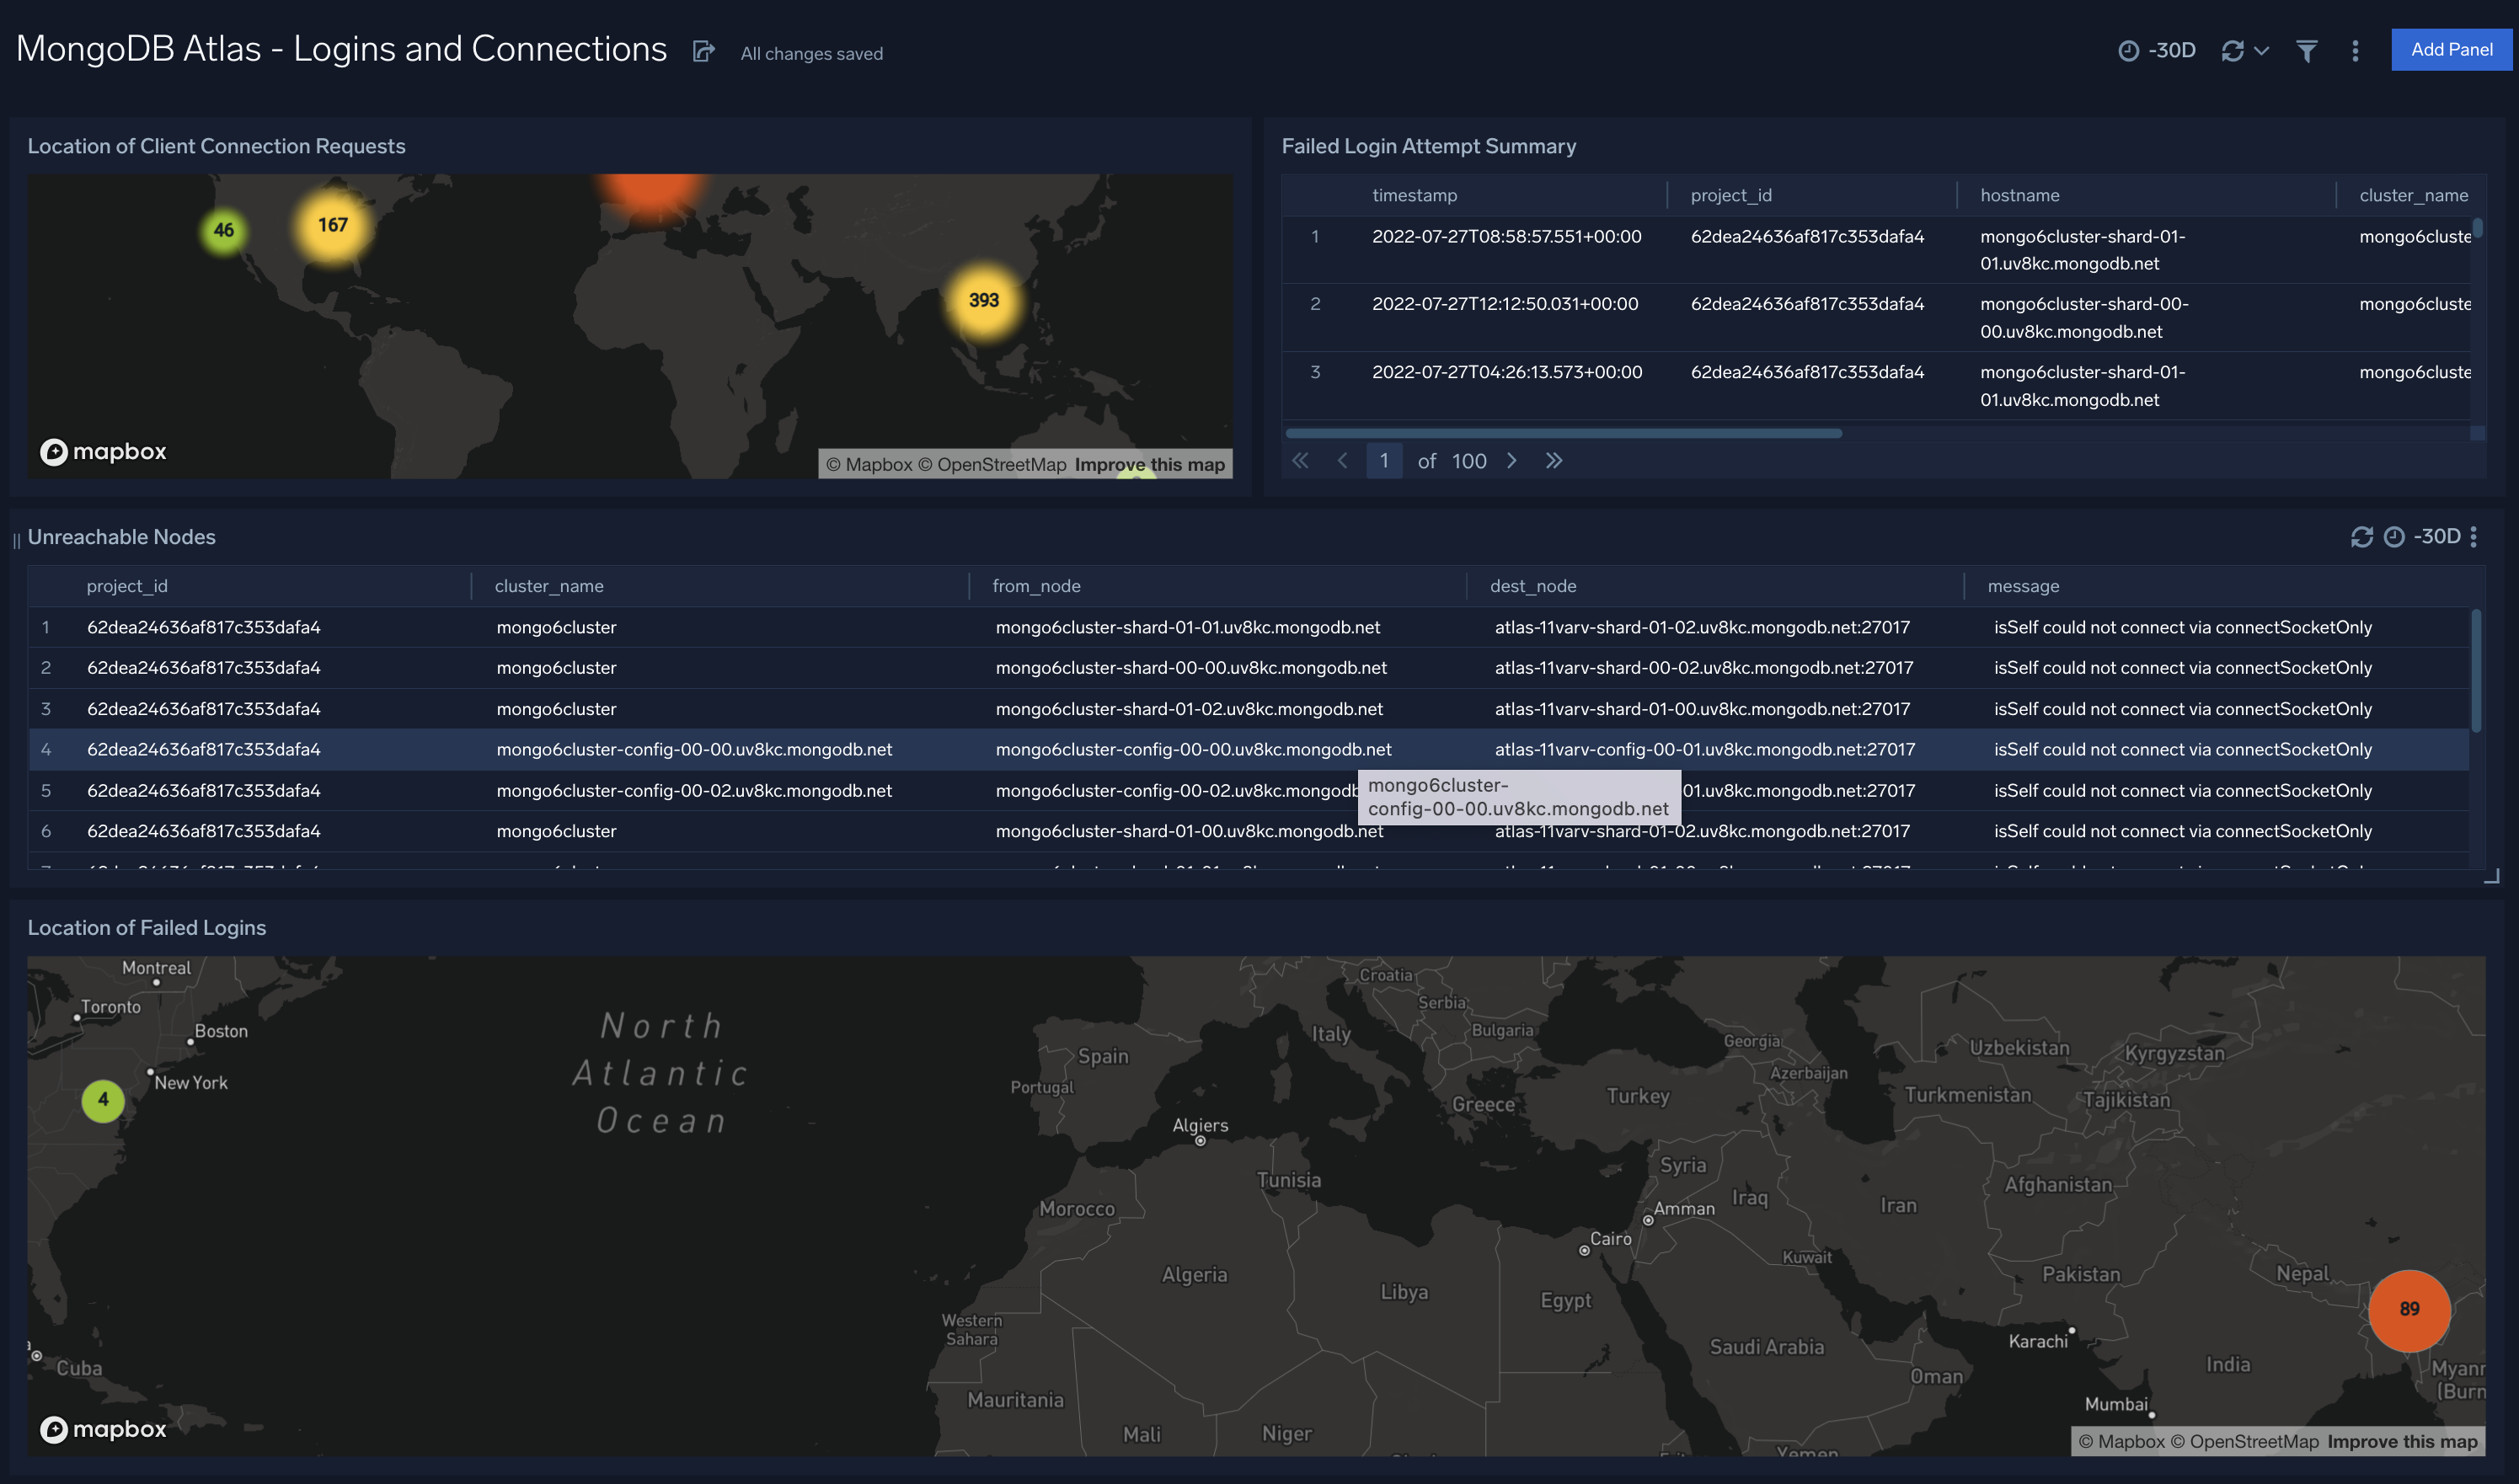
Logins and Connections
The MongoDB Atlas Logins and Connections dashboard provides a high-level view of the geographic locations of client connection requests, logins from malicious remote IPS, and geographic locations of failed logins. Panels also display information on overall failed login attempts, threat intel by remote IP, and failed logins by user.
Use this dashboard to:
- Identify requests coming in malicious remote IPs and their geographic locations and use this information to fix your firewall or WAF devices.
- Validate locations of incoming client connections are in line with expected locations.
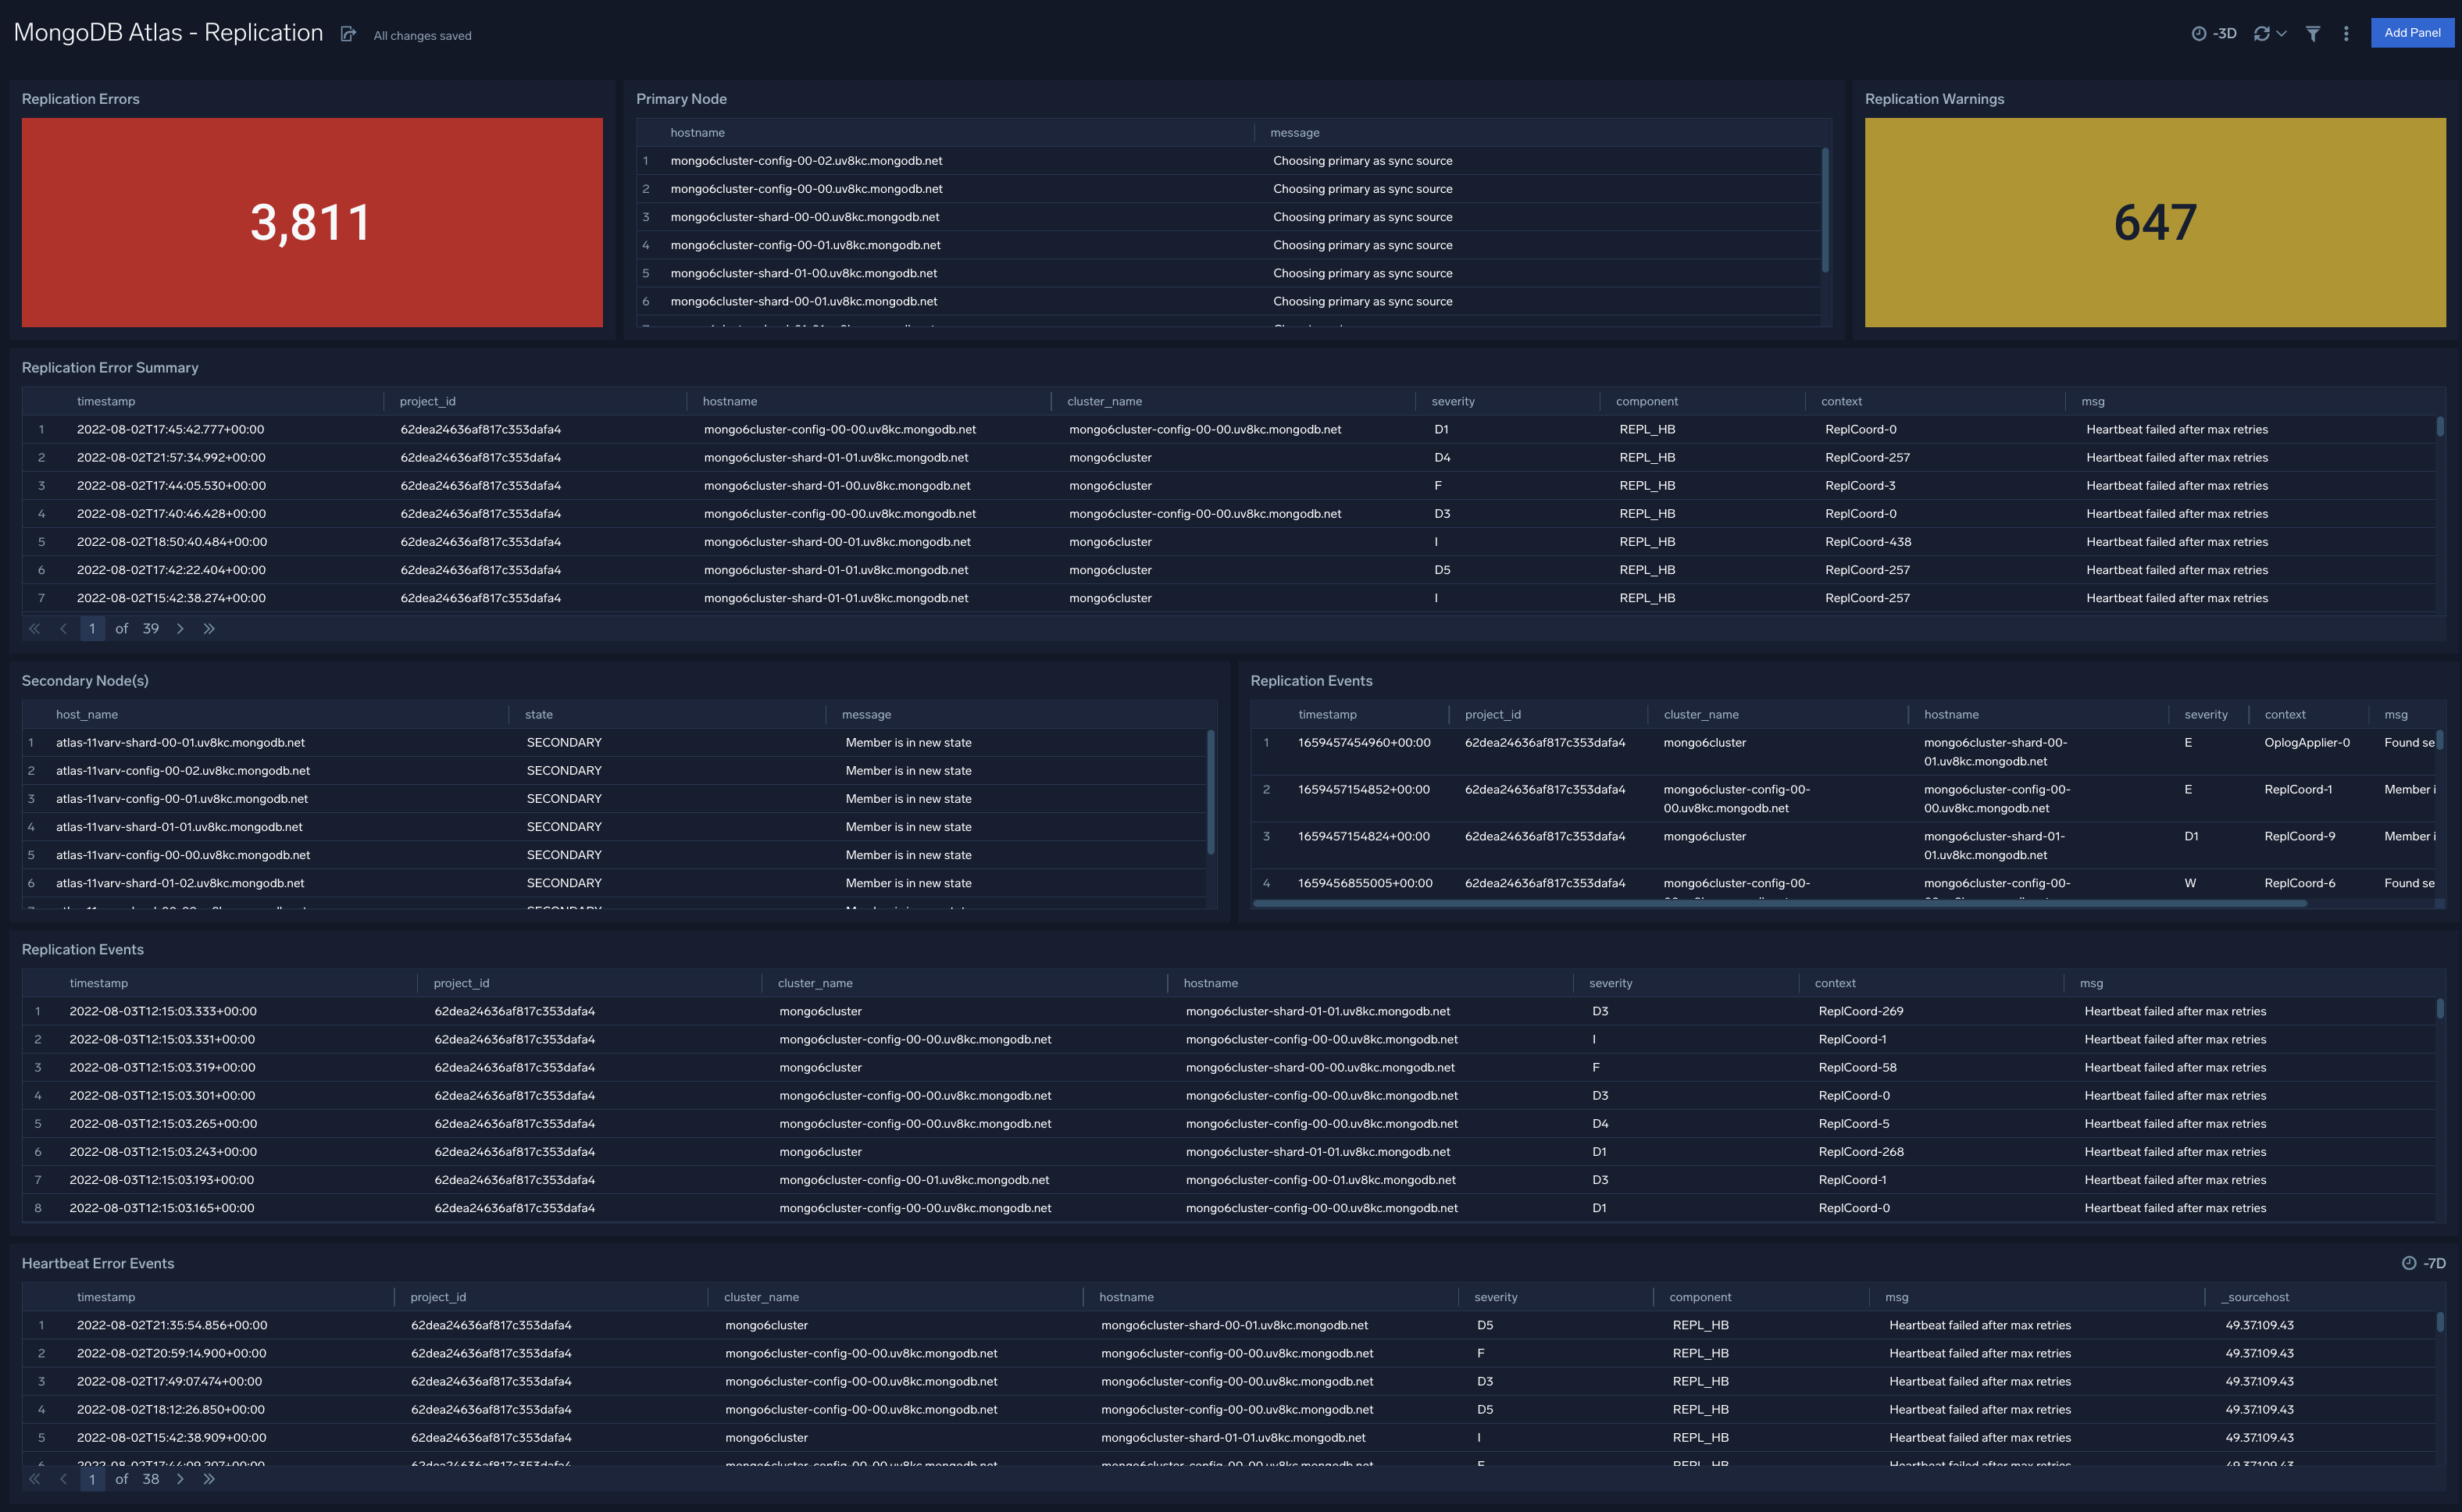
Replication
The MongoDB Atlas Replication dashboard provides information on changes in replication configurations. Panels display details on replication errors, warnings, events, as well as information around primary and secondary nodes.
Use this dashboard to:
- Identify and fix replication and availability errors.
- Monitor changes in replication lag performance.
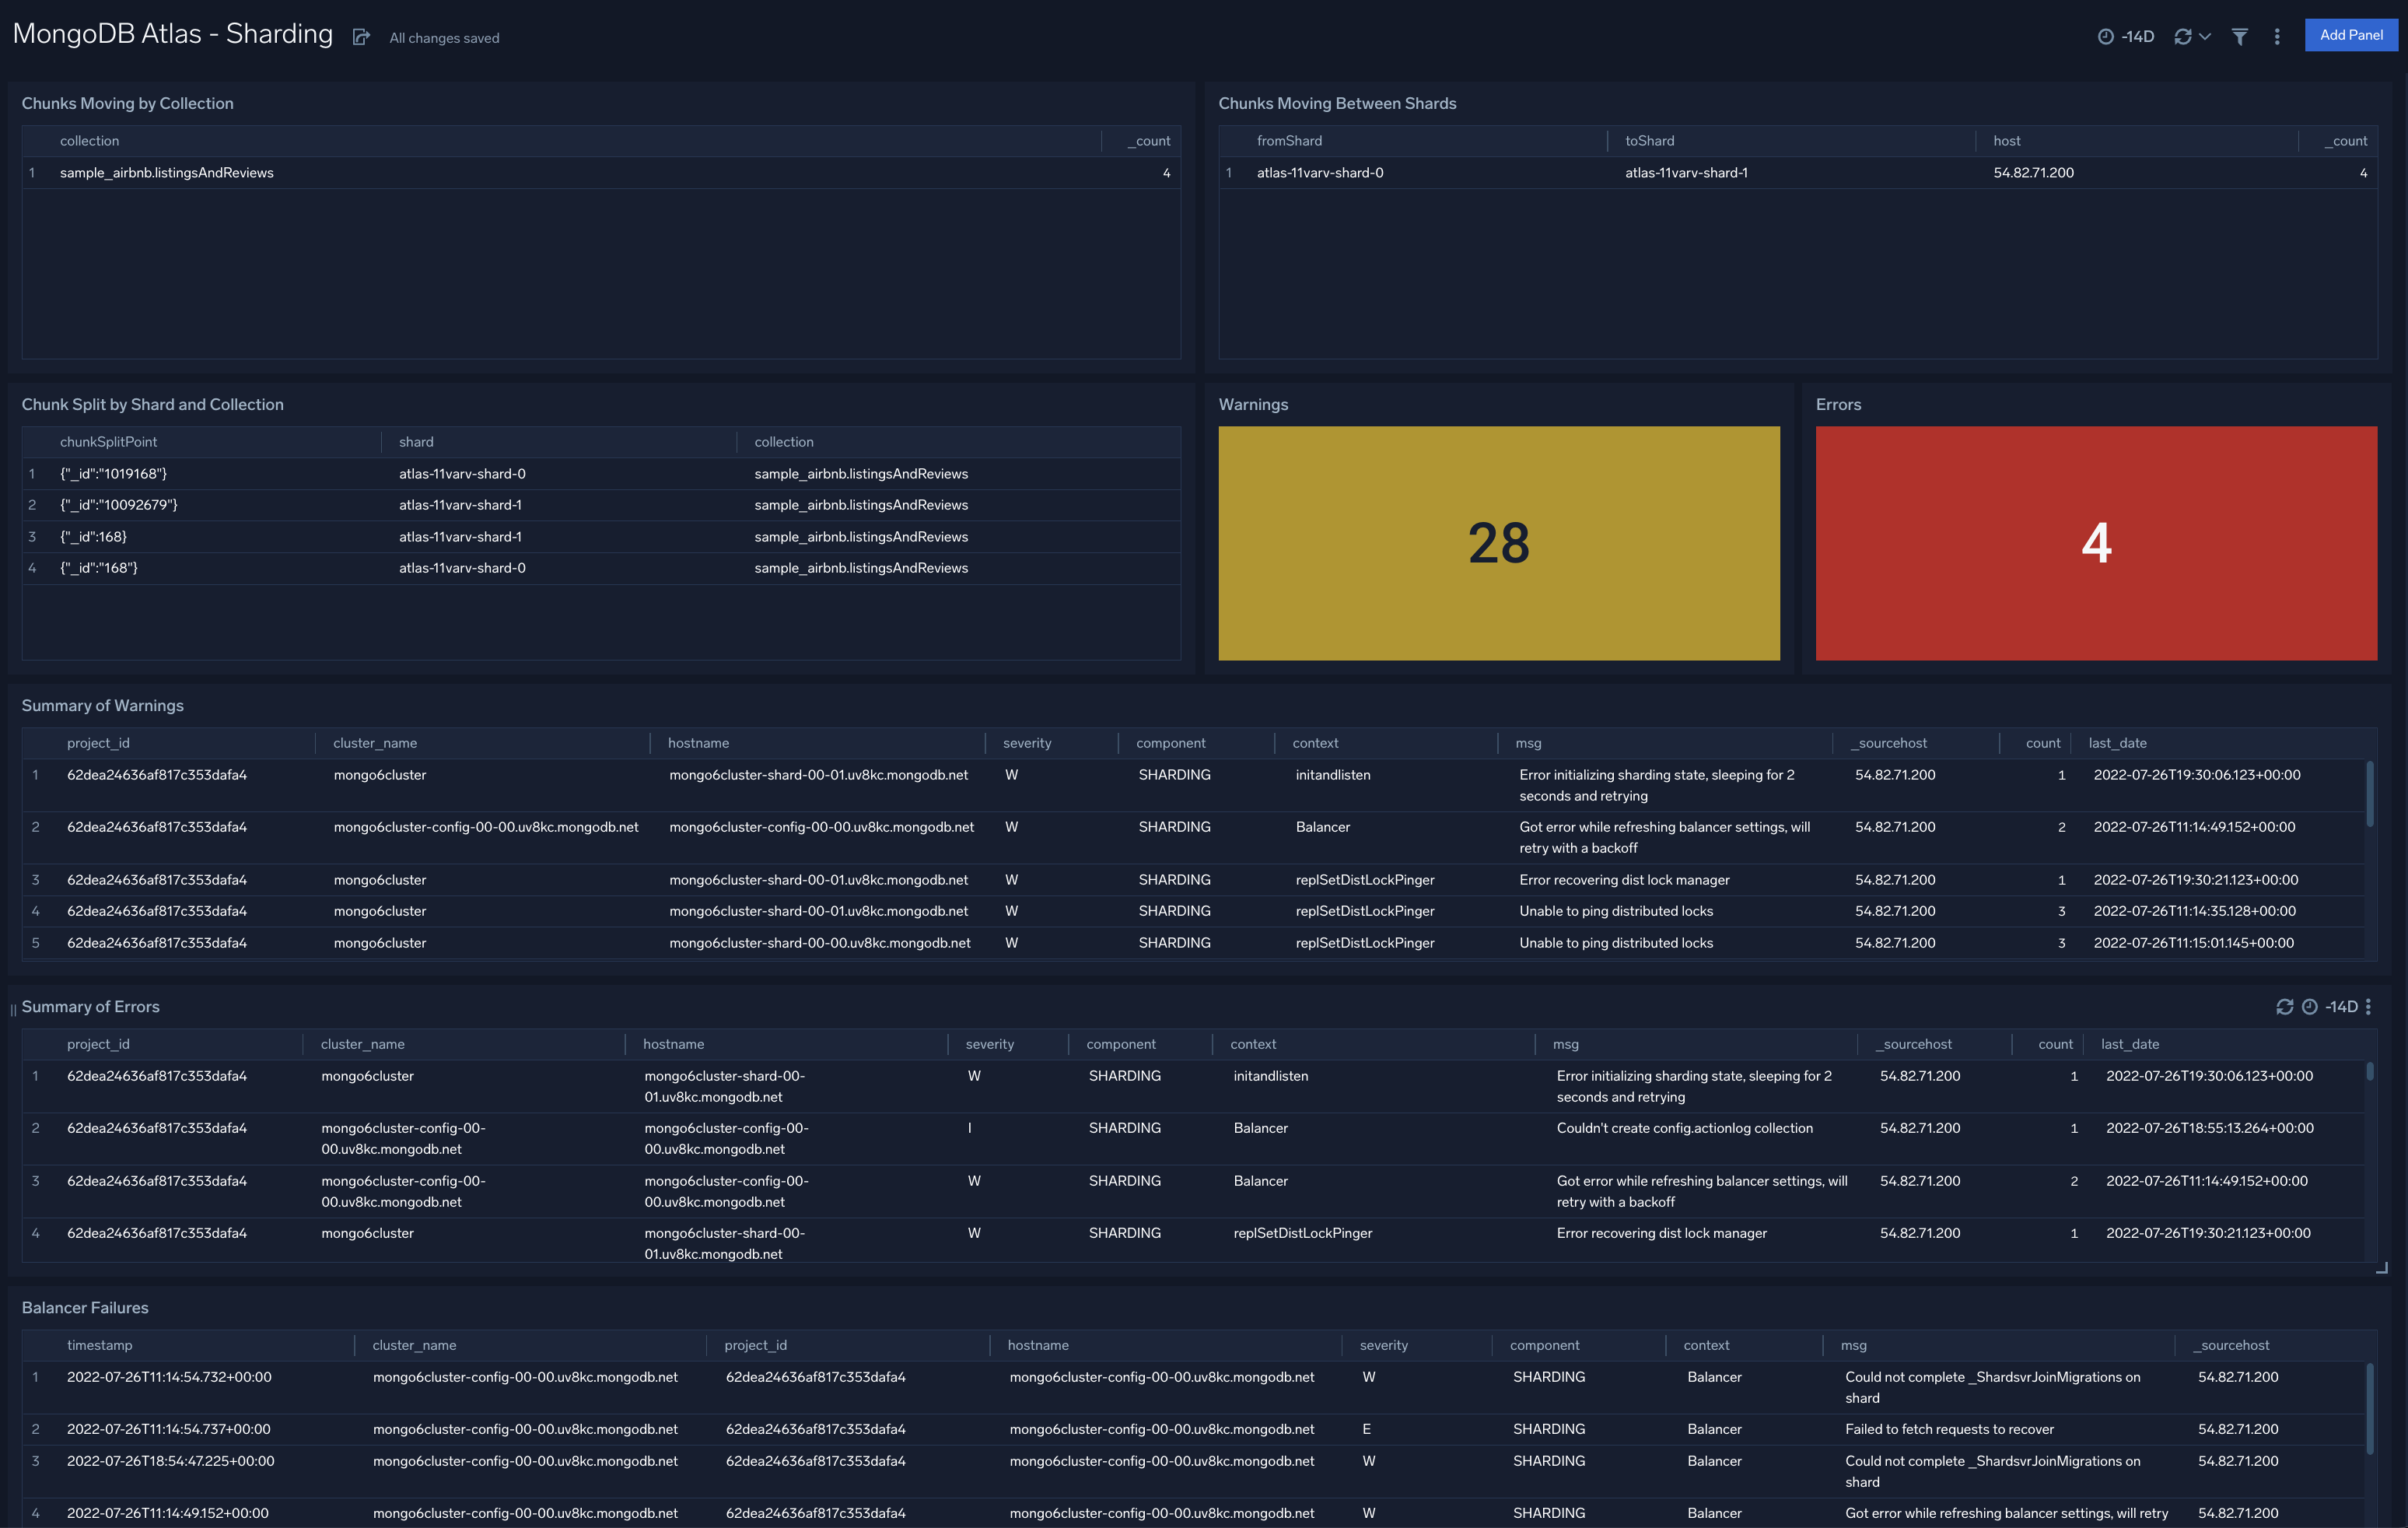
Sharding
The MongoDB Atlas Sharding dashboard provides information on Atlas cluster sharding. Panels show details on warnings, errors, chunk split failures, balancer failures, chunks moving by collection, and chunks moving between shards.
Use this dashboard to:
- Identify and fix sharding and balancing related errors and warnings.
- Track chunk move operations to ensure they are in line with expectations.