PCI Compliance for Palo Alto Networks 10
The Sumo Logic app for Payment Card Industry (PCI) Compliance for Palo Alto Networks 10 offers dashboards to monitor firewall traffic activity for compliance with PCI requirements 01, 02, and 04.
Prerequisites
You must have Palo Alto Networks Web administrative user permissions to successfully set up collection.
Log types
| Log type | Description | Supported log format | For more information |
| Traffic | Entries for the start and end of each session, including date and time; source and destination zones, addresses and ports; application name; security rule applied to the traffic flow; rule action (allow, deny, or drop); ingress and egress interface; number of bytes; and session end reason. | Syslog | Traffic Logs |
Collect Logs for PCI Compliance for Palo Alto Networks 10
This section provides instructions for configuring log collection for the Sumo Logic app for PCI Compliance for Palo Alto Networks 10, as well as sample log messages and a query example from an app dashboard. This includes the following tasks:
- Create a hosted collector with a Cloud Syslog source
- Define the destination for the logs.
- Configure syslog forwarding
- Verify logs in Palo Alto Networks
Step 1. Create a hosted collector and Cloud Syslog source
In this step you configure a hosted collector with a Cloud Syslog source that will act as Syslog server to receive logs and events from Palo Alto Networks devices.
To configure a hosted collector with a Cloud Syslog source, do the following:
- Log in to Sumo Logic and create a Hosted Collector.
- Create a Cloud Syslog Source on the hosted collector, specifying the following:
- Enter a Source Name.
- Provide a Source Category: NW/PAN/V10
- Click Save.
- Copy the Token, host URL and TCP TLS Port to a safe place. You will need this information in the tasks that follow.
Step 2. Define the destination for the logs
In this step you create a server profile where you can define the log destination. This will be the host name, port and protocol (TLS) of the Sumo Logic Cloud Syslog source.
To create a server profile specifying the log destination, do the following:
- Login to the Palo Alto Networks Web interface as an administrative user.
- Select Device tab > Server Profiles > Syslog.
- Click Add at the bottom of the screen and provide endpoint details and a profile name, such as Sumo_Logs_Profile01.
- In the Syslog Server Profile window, select the Servers tab and click Add.
- In the Servers window, specify the following information:
- In the Syslog Server Profile window, select the Custom Log Format tab, and use the following custom format for the Traffic log type:
,$receive_time,$serial,$type,$subtype,,$time_generated,$src,$dst,$natsrc,$natdst,$rule,$srcuser,$dstuser,$app,$vsys,$from,$to,$inbound_if,$outbound_if,$logset,,$sessionid,$repeatcnt,$sport,$dport,$natsport,$natdport,$flags,$proto,$action,$bytes,$bytes_sent,$bytes_received,$packets,$start,$sec,$category,,$seqno,$actionflags,$srcloc,$dstloc,,$pkts_sent,$pkts_received,$session_end_reason,$dg_hier_level_1,$dg_hier_level_2,$dg_hier_level_3,$dg_hier_level_4,$vsys_name,$device_name,$action_source,$src_uuid,$dst_uuid,$tunnelid/$imsi,$monitortag/$imei,$parent_session_id,$parent_start_time,$tunnel,$assoc_id,$chunks,$chunks_sent,$chunks_received,$rule_uuid,$http2_connection <Token from [Step 1](#step-1-create-a-hosted-collector-and-cloud-syslog-source)>
- Click OK.
- Commit the changes.
Step 3. Configure syslog forwarding
To configure syslog forwarding for each Traffic logs, follow the steps to Configure Log Forwarding as described in the Palo Networks documentation.
Step 4. Verify logs in Palo Alto Networks
In this step, you view logs using the Palo Alto Network Web interface to confirm the logs are generated on the firewall.
To verify the logs in Palo Alto Networks, do the following:
- In the Palo Alto Networks UI, select Monitor > Logs.
- Once the setup is done, log in to Sumo Logic.
- To validate that the logs are flowing to Sumo Logic, run a query using the source category you configured during Step 1, such as:
_sourceCategory = NW/PAN/V10
Sample log messages
The PCI Compliance for Palo Alto Networks 10 App uses Traffic logs.
Oct 09 10:19:15 SumPunFw07.sumotest.com 1,2019/10/09 10:19:15,001234567890002,TRAFFIC,drop,2304,2019/10/09 10:19:15,209.118.103.150,160.177.222.249,0.0.0.0,0.0.0.0,InternalServer,,,not-applicable,vsys1,inside,z1-FW-Transit,ethernet1/2,,All traffic,2019/10/09 10:19:15,0,1,63712,443,0,0,0x0,udp,deny,60,60,0,1,2019/10/09 10:19:15,0,any,0,0123456789,0x0,Netherlands,10.0.0.0-10.255.255.255,0,1,0,policy-deny,0,0,0,0,,SumPunFw07,from-policy,,,0,,0,,N/A,0,0,0,0,1202585d-b4d5-5b4c-aaa2-d80d77ba456e,0
Sample queries
This example query is from the Allowed Network Activity by Direction panel of the Accepted and Rejected Traffic dashboard.
Click to expand
_sourceCategory = Labs/PaloAltoNetworksv10 TRAFFIC allow
| csv _raw extract 1 as f1, 2 as Receive_Time, 3 as serialNum, \
4 as type, 5 as subtype, 6 as f2, 7 as LogGenerationTime, 8 as src_ip, \
9 as dest_ip, 10 as NAT_src_ip, 11 as NAT_dest_ip, 12 as ruleName, \
13 as src_user, 14 as dest_user, 15 as app, 16 as vsys, 17 as src_zone, \
18 as dest_zone, 19 as inbound_interface, 20 as outbound_interface, \
21 as LogAction, 22 as f3, 23 as SessonID, 24 as RepeatCount, \
25 as src_port, 26 as dest_port, 27 as NAT_src_port, 28 as NAT_dest_port, \
29 as flags, 30 as protocol, 31 as action, 32 as bytes, 33 as bytes_sent, \
34 as bytes_recv, 35 as Packets, 36 as StartTime, 37 as ElapsedTime, \
38 as Category, 39 as f4, 40 as seqNum, 41 as ActionFlags, 42 as src_Country, \
43 as dest_country, 44 as f5, 45 as pkts_sent, 46 as pkts_received, \
47 as session_end_reason, 48 as Device_Group_Hierarchy_l1, \
49 as Device_Group_Hierarchy_l2, 50 as Device_Group_Hierarchy_l3, \
51 as Device_Group_Hierarchy_l4, 52 as vsys_Name, 53 as DeviceName, \
54 as action_source, 55 as Source_VM_UUID, 56 as Destination_VM_UUID, \
57 as Tunnel_ID_IMSI, 58 as Monitor_Tag_IMEI, 59 as Parent_Session_ID, \
60 as parent_start_time, 61 as Tunnel, 62 as SCTP_Association_ID, \
63 as SCTP_Chunks, 64 as SCTP_Chunks_Sent, 65 as SCTP_Chunks_Received, \
66 as UUIDforrule, 67 as HTTP2Connection, 68 as AppFlapCount ,69 as PolicyID ,\
70 as LinkSwitches ,71 as SDWANCluster ,72 as SDWANDeviceType ,\
73 as SDWANClusterType ,74 as SDWANSite ,75 as DynamicUserGroupName ,\
76 as XFFAddress ,77 as SourceDeviceCategory ,78 as SourceDeviceProfile ,\
79 as SourceDeviceModel ,80 as SourceDeviceVendor ,81 as SourceDeviceOSFamily ,\
82 as SourceDeviceOSVersion ,83 as SourceHostname ,84 as SourceMACAddress ,\
85 as DestinationDeviceCategory ,86 as DestinationDeviceProfile ,\
87 as DestinationDeviceModel ,88 as DestinationDeviceVendor ,\
89 as DestinationDeviceOSFamily ,90 as DestinationDeviceOSVersion ,\
91 as DestinationHostname ,92 as DestinationMACAddress ,93 as ContainerID ,\
94 as PODNamespace ,95 as PODName ,96 as SourceExternalDynamicList ,\
97 as DestinationExternalDynamicList ,98 as HostID ,99 as UserDeviceSerialNumber ,100 as SourceDynamicAddressGroup ,101 as DestinationDynamicAddressGroup ,\
102 as SessionOwner ,103 as HighResolutionTimestamp ,104 as ASliceServiceType ,\
105 as ASliceDifferentiator
| where type = "TRAFFIC" and action="allow"
| where ((compareCIDRPrefix("172.16.0.0", src_ip, toInt(12)) or compareCIDRPrefix("192.168.0.0", src_ip, toInt(16)) or compareCIDRPrefix("10.0.0.0", src_ip, toInt(8)) and (!compareCIDRPrefix("172.16.0.0", dest_ip, toInt(12)) and !compareCIDRPrefix("192.168.0.0", dest_ip, toInt(16)) and !compareCIDRPrefix("10.0.0.0", dest_ip, toInt(8)))) or
(compareCIDRPrefix("172.16.0.0", dest_ip, toInt(12)) or compareCIDRPrefix("192.168.0.0", dest_ip, toInt(16)) or compareCIDRPrefix("10.0.0.0", dest_ip, toInt(8)) and (!compareCIDRPrefix("172.16.0.0", src_ip, toInt(12)) and !compareCIDRPrefix("192.168.0.0", src_ip, toInt(16)) and !compareCIDRPrefix("10.0.0.0", src_ip, toInt(8)))))
| if (compareCIDRPrefix("172.16.0.0", src_ip, toInt(12)) or compareCIDRPrefix("192.168.0.0", src_ip, toInt(16)) or compareCIDRPrefix("10.0.0.0", src_ip, toInt(8)), "outbound","inbound") as direction
| timeslice 5m
| count by _timeslice, direction | transpose row _timeslice column direction
Installing the PCI for Palo Alto Networks 10 app
To install the app, do the following:
- Select App Catalog.
- In the 🔎 Search Apps field, run a search for your desired app, then select it.
- Click Install App.
note
Sometimes this button says Add Integration.
- Click Next in the Setup Data section.
- In the Configure section of your respective app, complete the following fields.
- Key. Select either of these options for the data source.
- Choose Source Category and select a source category from the list for Default Value.
- Choose Custom, and enter a custom metadata field. Insert its value in Default Value.
- Key. Select either of these options for the data source.
- Click Next. You will be redirected to the Preview & Done section.
Post-installation
Once your app is installed, it will appear in your Installed Apps folder, and dashboard panels will start to fill automatically.
Each panel slowly fills with data matching the time range query and received since the panel was created. Results will not immediately be available, but will update with full graphs and charts over time.
Upgrading the PCI for Palo Alto Networks 10 app (Optional)
To update the app, do the following:
- Select App Catalog.
- In the Search Apps field, search for and then select your app.
Optionally, you can identify apps that can be upgraded in the Upgrade available section. - To upgrade the app, click Upgrade.
- If the upgrade does not have any configuration or property changes, you will be redirected to the Preview & Done section.
- If the upgrade has any configuration or property changes, you will be redirected to Setup Data page.
- In the Configure section of your respective app, complete the following fields.
- Key. Select either of these options for the data source.
- Choose Source Category and select a source category from the list for Default Value.
- Choose Custom and enter a custom metadata field. Insert its value in Default Value.
- Key. Select either of these options for the data source.
- Click Next. You will be redirected to the Preview & Done section.
- In the Configure section of your respective app, complete the following fields.
Post-update
Your upgraded app will be installed in the Installed Apps folder, and dashboard panels will start to fill automatically.
See our Release Notes changelog for new updates in the app.
Uninstalling the PCI for Palo Alto Networks 10 app (Optional)
To uninstall the app, do the following:
- Select App Catalog.
- In the 🔎 Search Apps field, run a search for your desired app, then select it.
- Click Uninstall.
Viewing PCI for Palo Alto Networks 10 dashboards
All dashboards have a set of filters that you can apply to the entire dashboard. Use these filters to drill down and examine the data to a granular level.
- You can change the time range for a dashboard or panel by selecting a predefined interval from a drop-down list, choosing a recently used time range, or specifying custom dates and times. Learn more.
- You can use template variables to drill down and examine the data on a granular level. For more information, see Filter with template variables.
- Most Next-Gen apps allow you to provide the scope at the installation time and are comprised of a key (
_sourceCategoryby default) and a default value for this key. Based on your input, the app dashboards will be parameterized with a dashboard variable, allowing you to change the dataset queried by all panels. This eliminates the need to create multiple copies of the same dashboard with different queries.
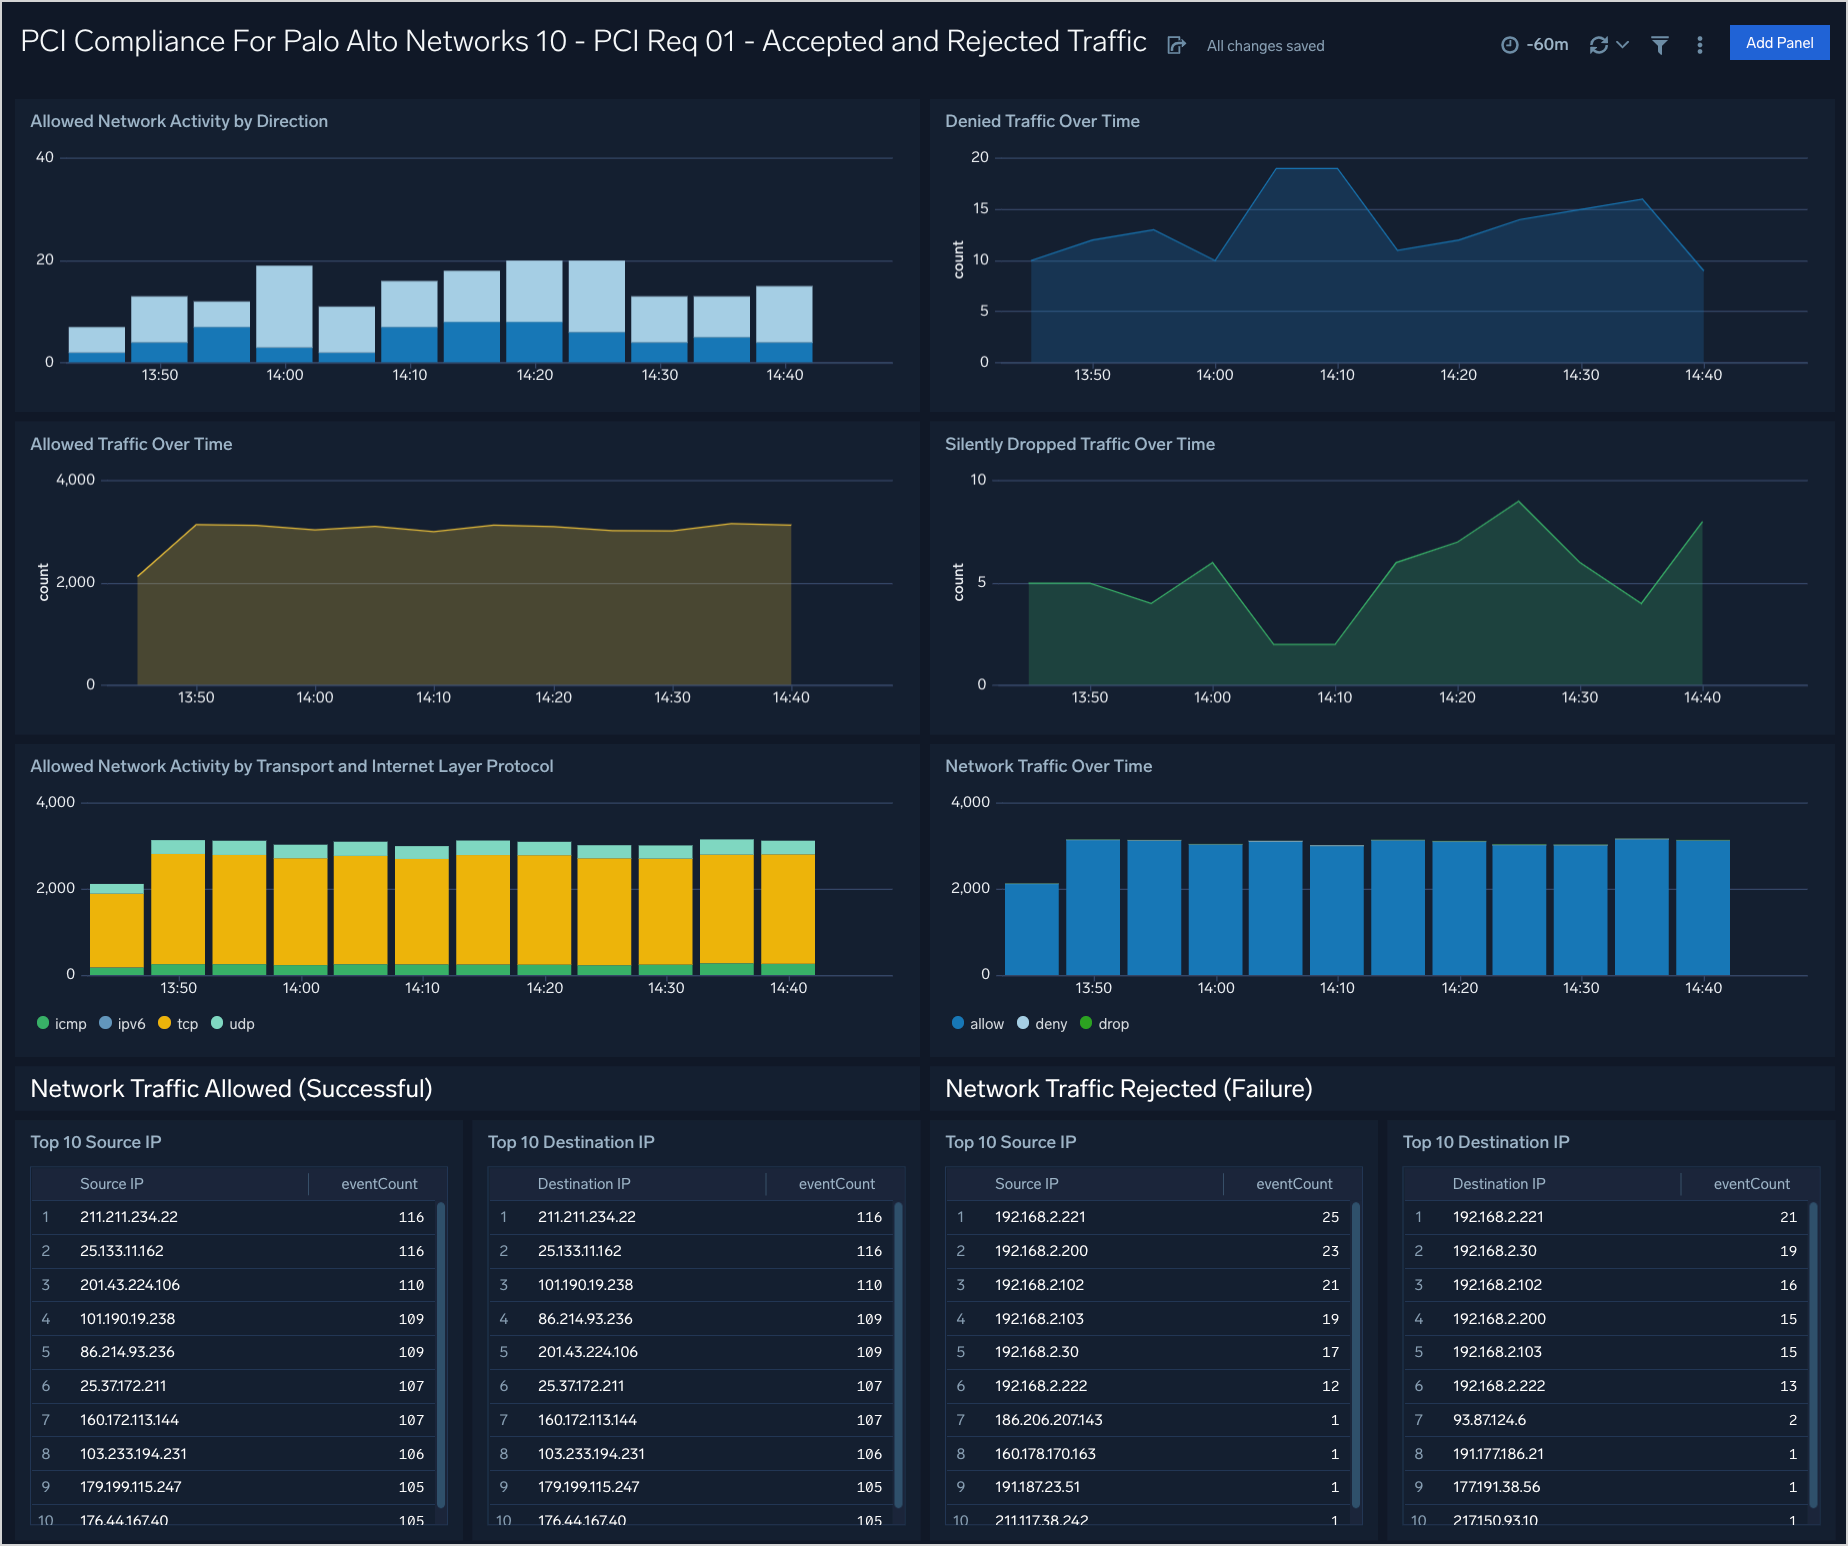
PCI Req 01 - Accepted and Rejected Traffic
Dashboard description: See analytics about accepted and rejected firewall traffic, including information about traffic direction; allowed, denied, and silently dropped traffic over time; and the top source and destination IPs for allowed and rejected traffic.
Use case: You can use this dashboard to monitor allowed and rejected traffic in accordance with PCI requirement 1. The dashboard helps you identify systems accepting or rejecting traffic, and identify inbound and outbound network connections trends.
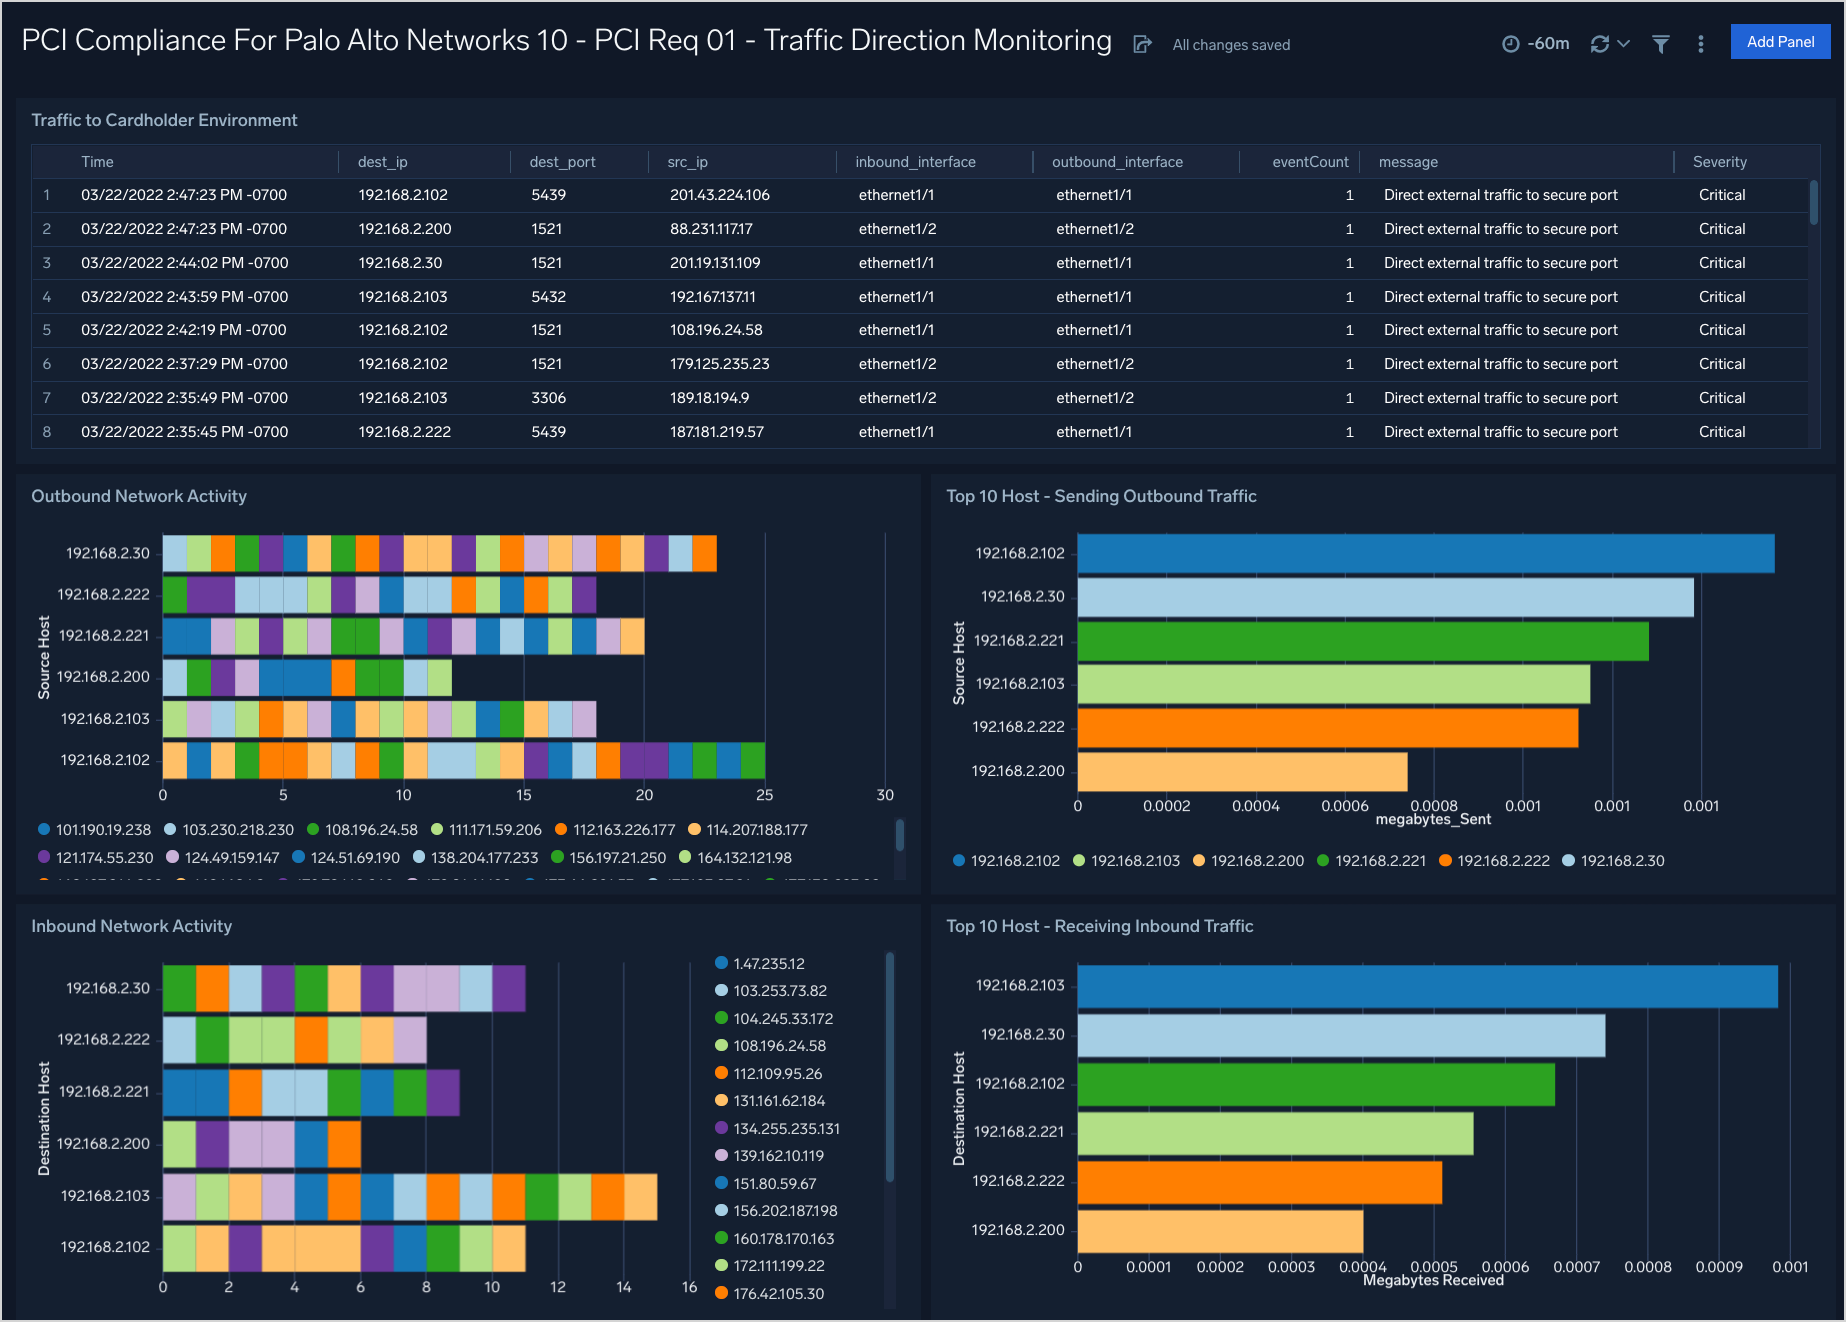
PCI Req 01 - Traffic Direction Monitoring
Dashboard description: View information about inbound and outbound traffic, including traffic to the cardholder data environment (CDE); details of inbound and outbound traffic; the top 10 hosts sending traffic; and the top 10 hosts receiving traffic.
Use case: You can use this dashboard to monitor connections made from external IPs to internal IPs. You can identify top internal IPs receiving traffic from external IPs or sending traffic to external IPs. Similarly, this dashboard helps you identify the amount of traffic generated by different IPs crossing your organization's network boundary.
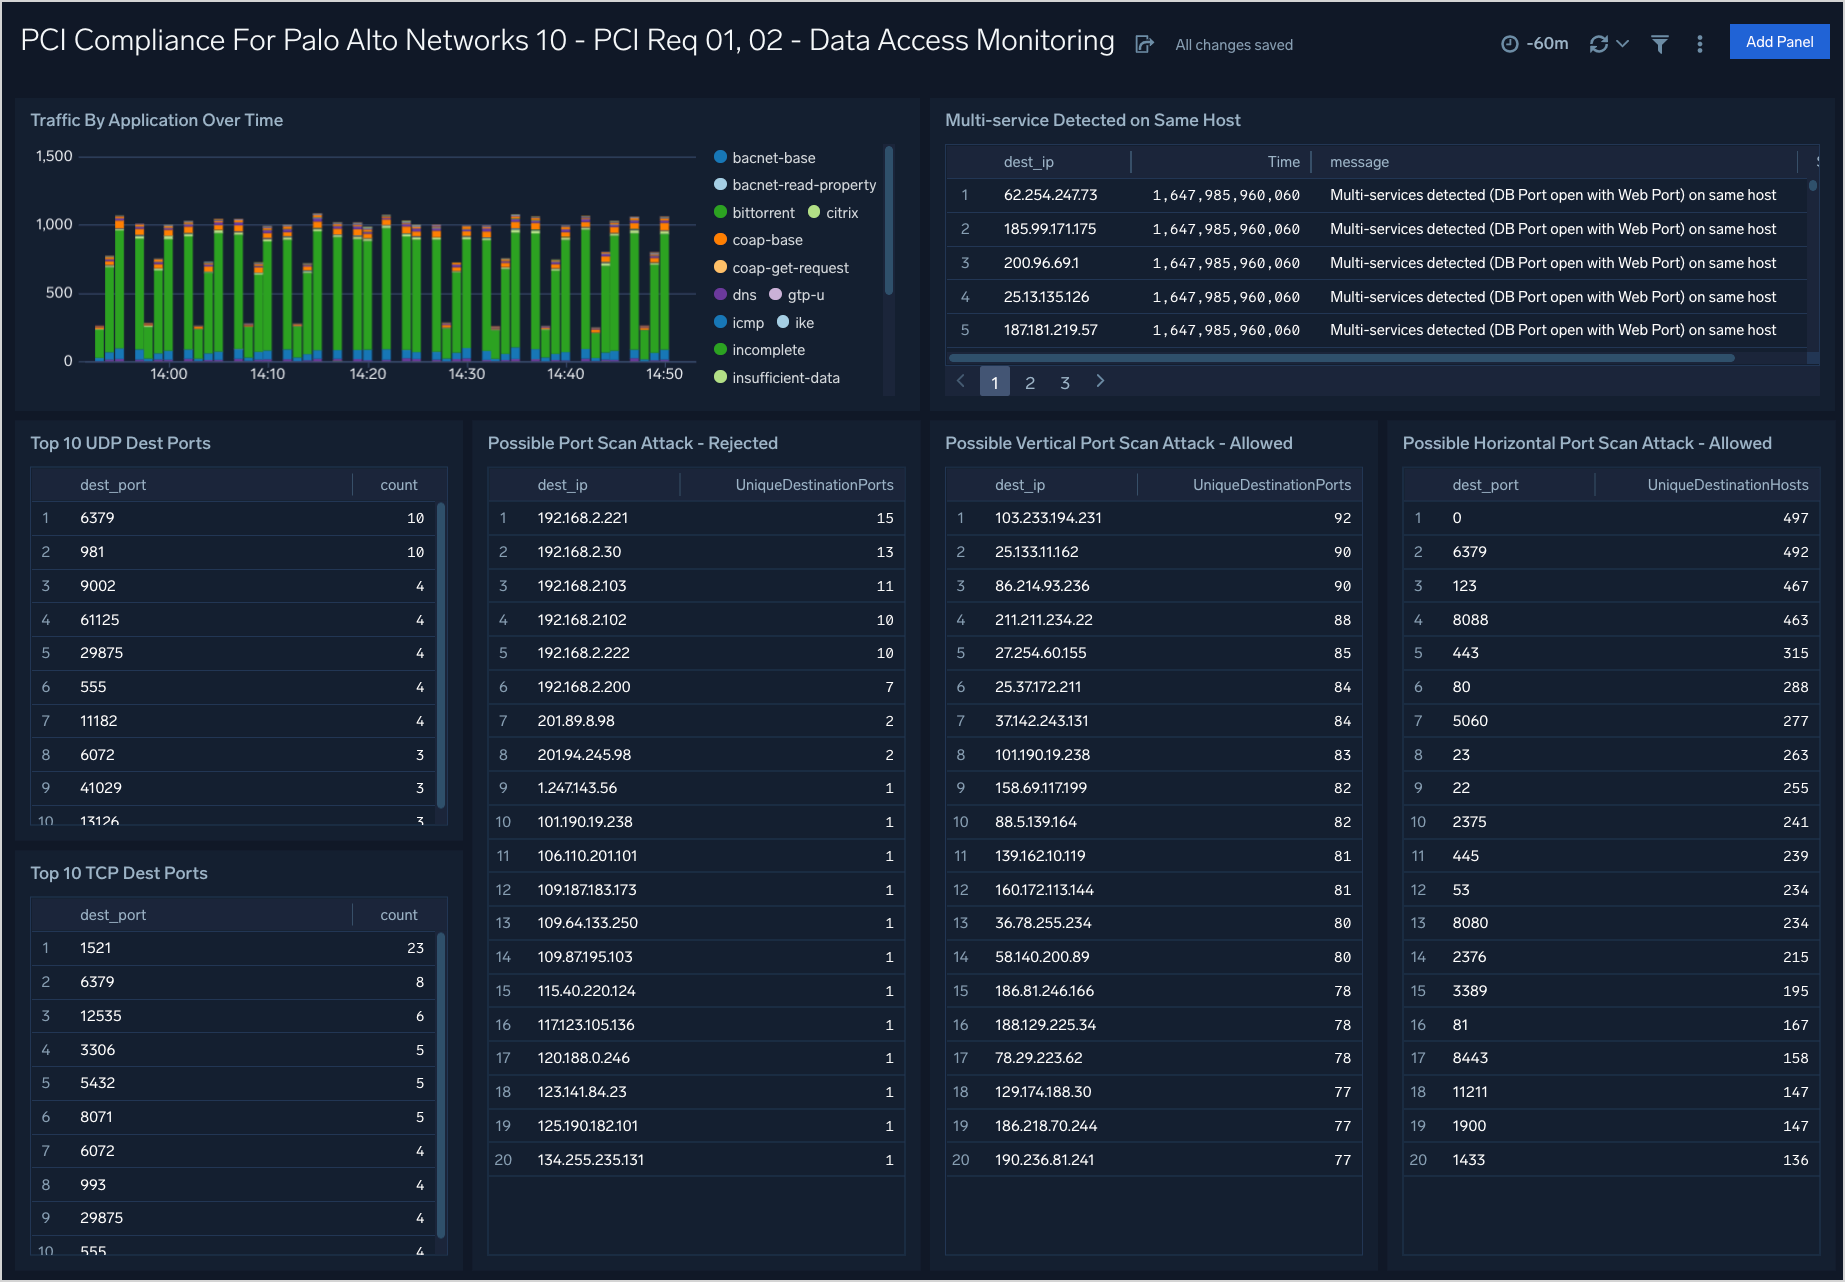
PCI Req 01, 02 - Data Access Monitoring
Dashboard description: See information about accepted network traffic by application; top TCP and UDP source and destination ports; multi-services detected on the same host; and information about possible port scan attacks, both allowed and rejected.
Use case: You can use this dashboard to monitor activities on ports, apps being used, and the protocols used to access apps. The panels help you identify possible port scan attacks, both horizontal and vertical. You can also identify if there are systems on which multiple services are executing.
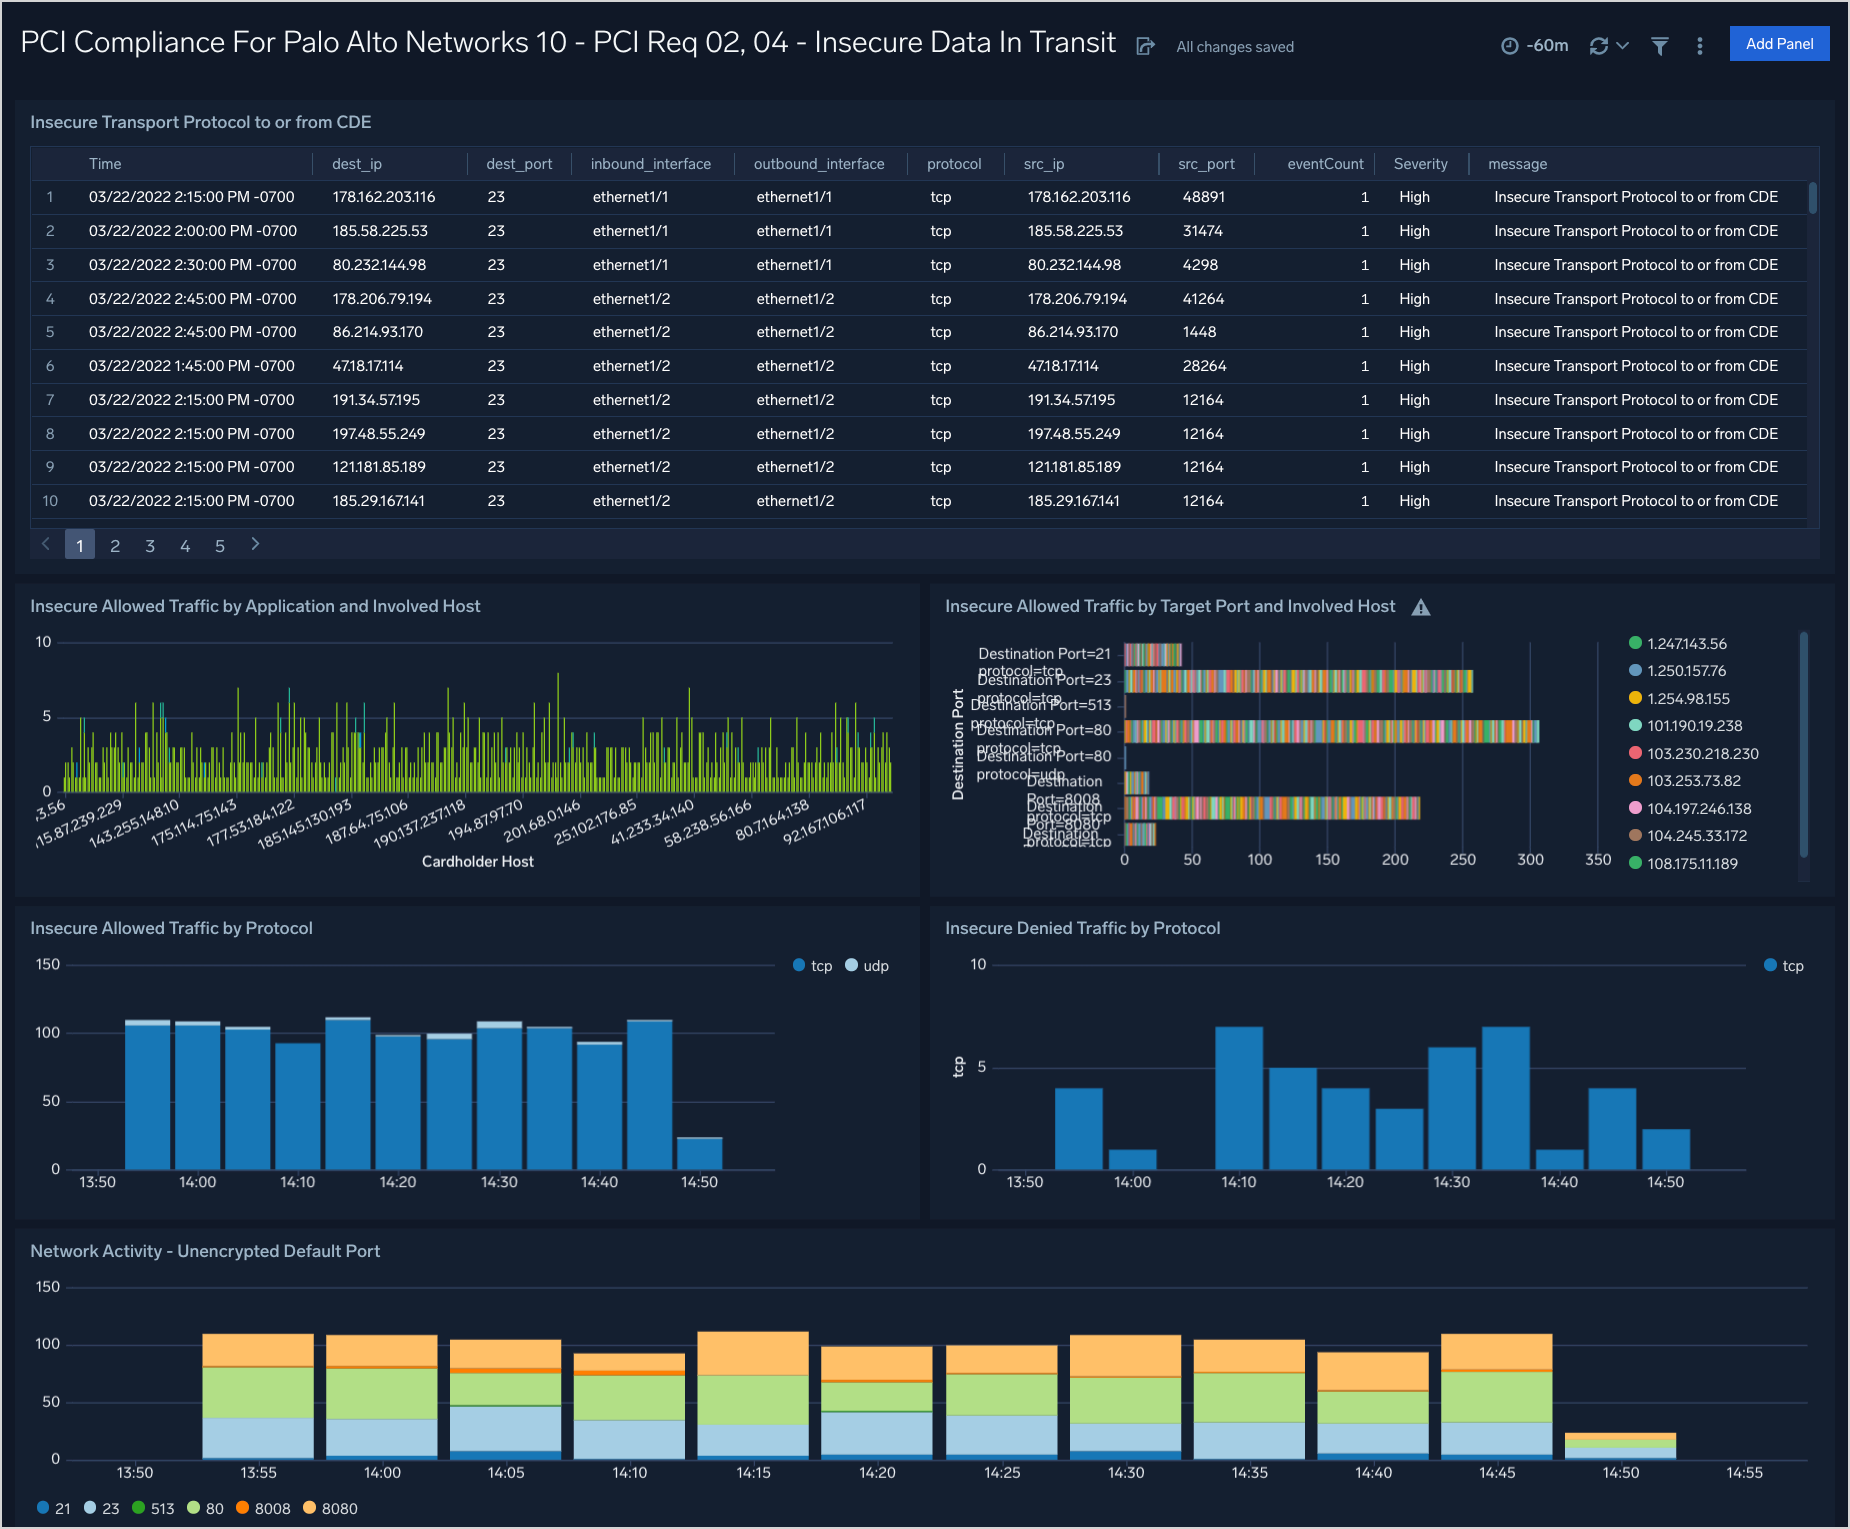
PCI Req 02, 04 - Insecure Data In Transit
Dashboard description: See analytics about insecure data in transit data, including data transmissions to or from the cardholder data environment (CDE) using an insecure protocol; breakdowns of which apps, hosts, and ports were involved with insecure traffic.
Use case: You can use this dashboard to identify systems and hosts involved in insecure data transit. You can identify insecure connections and port protocols like ftp, telnet, http, rlogin, and so on. You can also identify successful and rejected network connections for insecure connections.