Global Intelligence for Kubernetes DevOps App
The Global Intelligence for Kubernetes DevOps application helps infrastructure engineers and DevOps users benchmark the maturity of their Kubernetes adoption and minimize risk of Kubernetes infrastructure incidents by optimizing resource requests and limits for containers.
Availability
This feature is available in the following account plans.
| Account Type | Account Level |
|---|---|
| CloudFlex | Trial, Enterprise |
| Credits | Trial, Enterprise Operations, Enterprise Suite |
Data Sources
Global Intelligence for Kubernetes DevOps App uses metrics data from Kubernetes clusters.
Sample queries
The following sample query is from the Deployment Count panel of GI Kubernetes DevOps - 01. Adoption Stats dashboard.
metric=kube_deployment_spec_replicas _origin=kubernetes | "benchmark-deployment-count" as benchmarkname | quantize 15m using avg | count by deployment, benchmarkname | count by benchmarkname | infer model=benchmark category= k8sdevops //id=deployment_count
Collecting Metrics for the Global Intelligence for Kubernetes DevOps App
The Sumo Global Intelligence for Kubernetes DevOps app provides insights into your key Kubernetes infrastructure. You can review the metrics collection process and start collecting data.
Collection Process Overview: With this graphic, you can see how to collect metrics from your Kubernetes environment and send them to Sumo Logic.
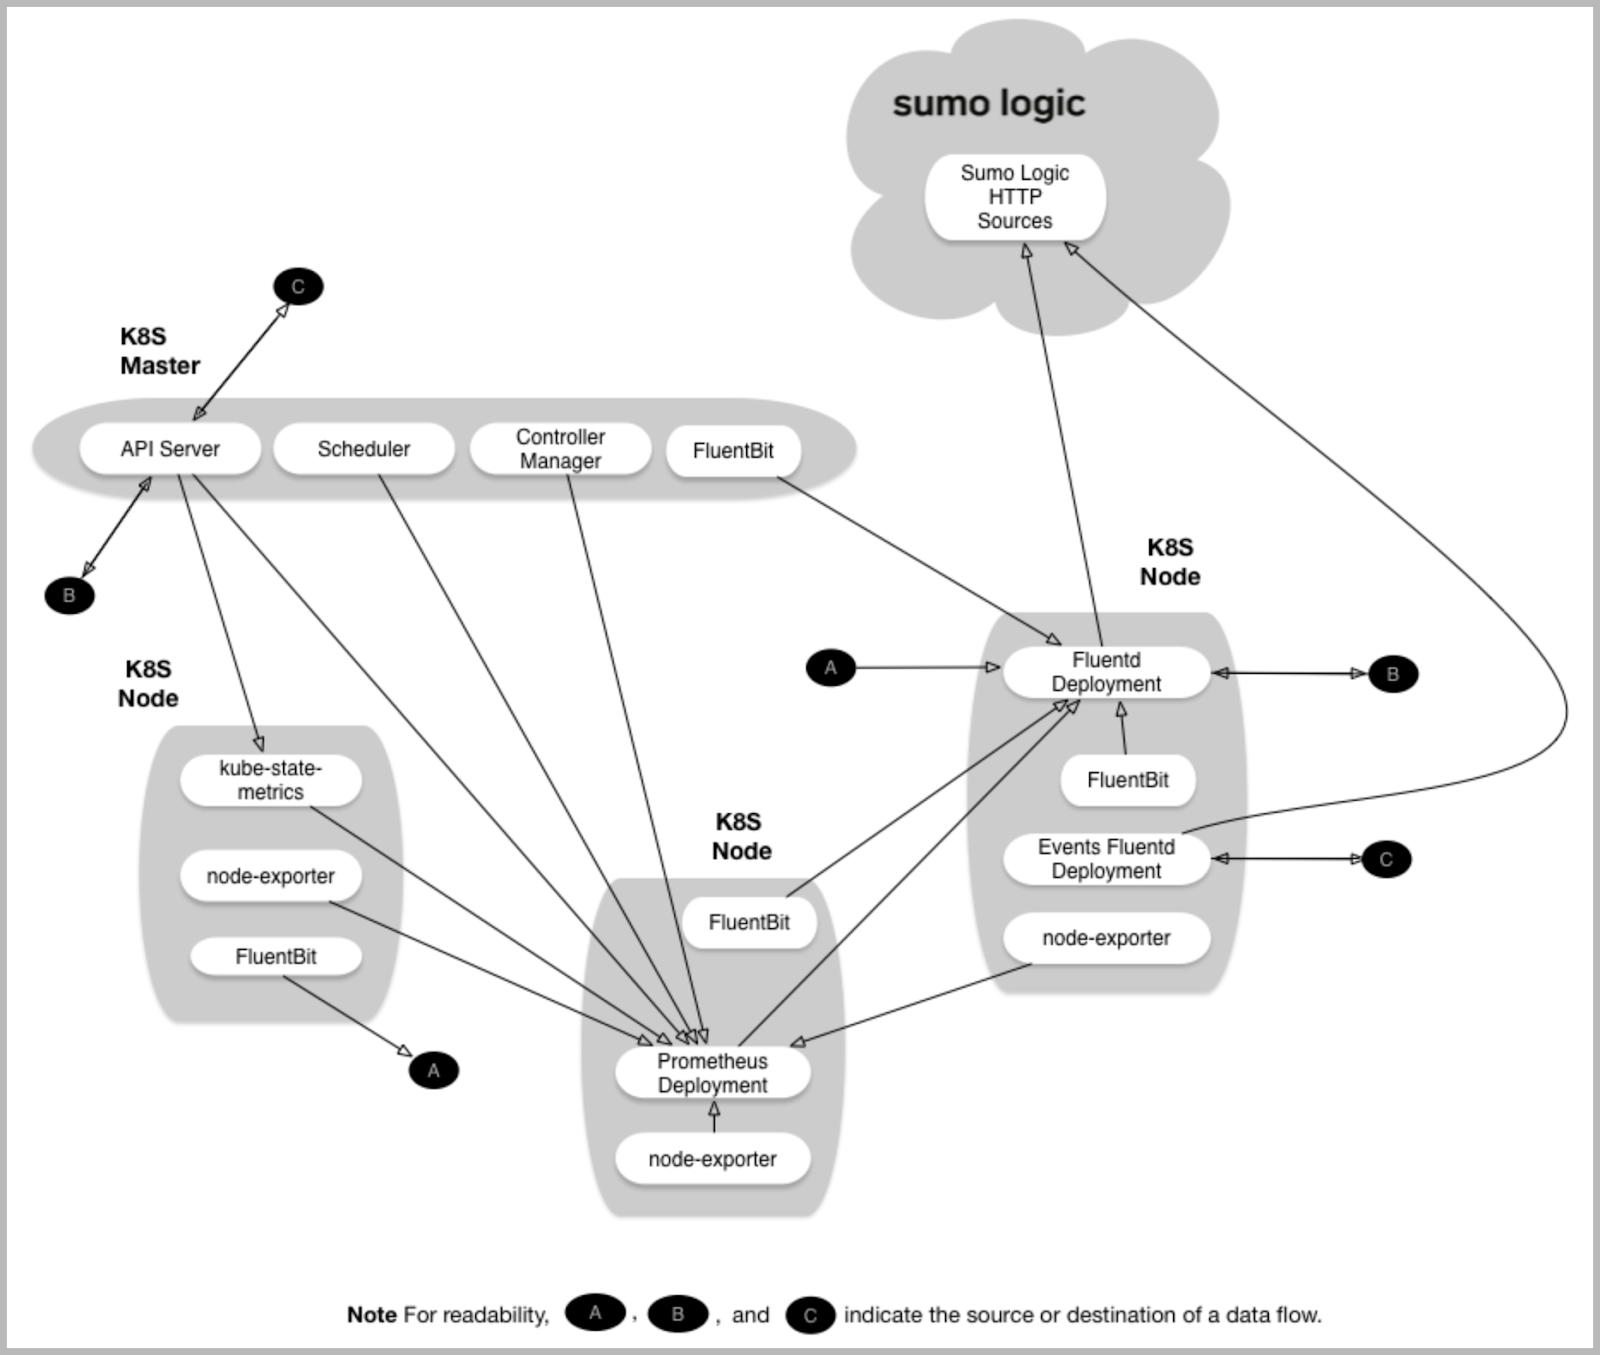
Follow the steps on the Sumo Logic Kubernetes Deployment guide to configure the collection for Kubernetes Benchmark metrics.
Installing the GI for Kubernetes DevOps App
Below are the instructions for installing the Sumo App for Kubernetes DevOps.
To install the app:
- Select App Catalog.
- In the 🔎 Search Apps field, run a search for your desired app, then select it.
- Click Install App.
note
Sometimes this button says Add Integration.
- On the next configuration page, under Select Data Source for your App, complete the following fields:
- Data Source. Select one of the following options:
- Choose Source Category and select a source category from the list; or
- Choose Enter a Custom Data Filter, and enter a custom source category beginning with an underscore. For example,
_sourceCategory=MyCategory.
- Folder Name. You can retain the existing name or enter a custom name of your choice for the app.
- All Folders (optional). The default location is the Personal folder in your Library. If desired, you can choose a different location and/or click New Folder to add it to a new folder.
- Data Source. Select one of the following options:
- Click Next.
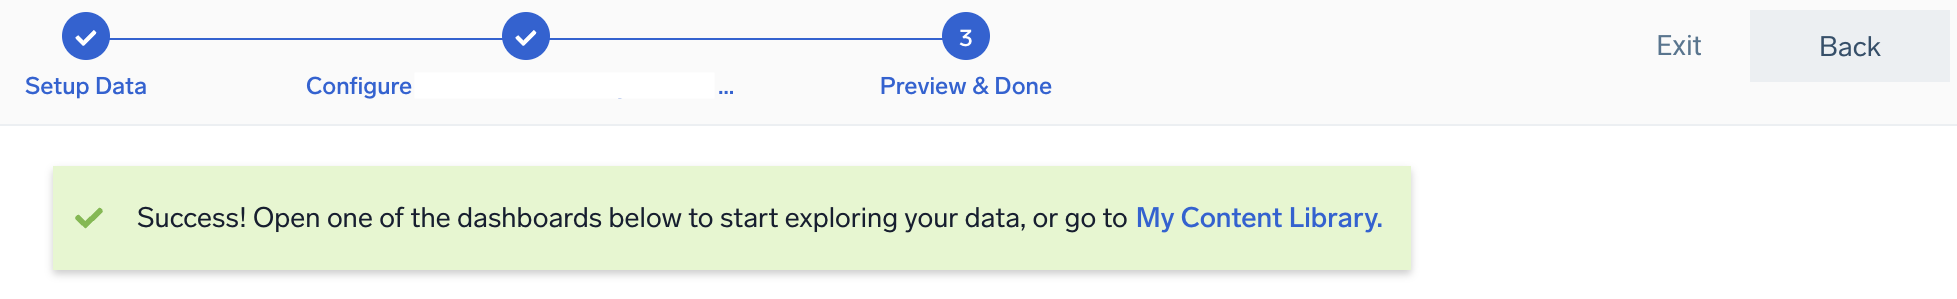
- Look for the dialog confirming that your app was installed successfully.
Post-installation
Once your app is installed, it will appear in your Personal folder or the folder that you specified. From here, you can share it with other users in your organization. Dashboard panels will automatically start to fill with data matching the time range query received since you created the panel. Results won't be available immediately, but within about 20 minutes, you'll see completed graphs and maps.
Viewing GI Kubernetes DevOps Dashboards
Dashboard Filters
Each dashboard has a set of filters that you can apply to the entire dashboard, as shown in the following example. Click the funnel icon in the top dashboard menu bar to display a scrollable list of filters that are applied across the entire dashboard.
You can use filters to drill down and examine the data on a granular level.
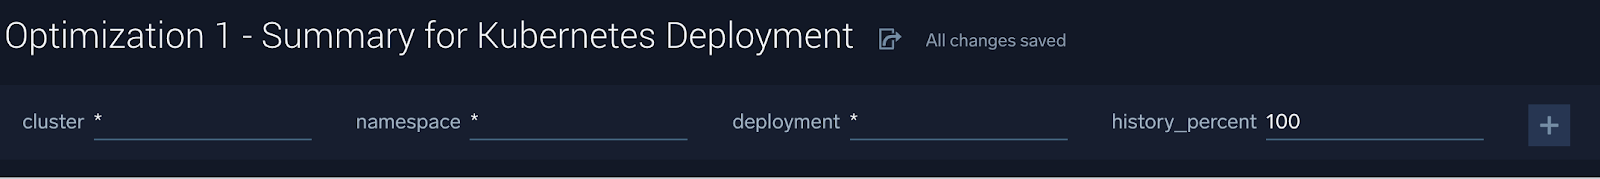
Select a cluster, namespace, and deployment. The history_percent represents the percent of 15m epochs over the prior 8 days over which Kubernetes metrics data was available for analysis for a given deployment-container combination. Percentages less than 100% represent deployment-container combinations that were new, transient or otherwise inactive for some portion of the prior 8 days.
The dashboard time range is used to fetch deployment-container combinations that have been active with Time Series data in the time range. Increasing the time range increases the number of such deployment-container combinations. To focus the optimization on the most active containers, start with a time range of 15m. For additional containers, gradually expand the time range.
The infer operator is the interface to a machine learning model. It is intended for use only in this application.
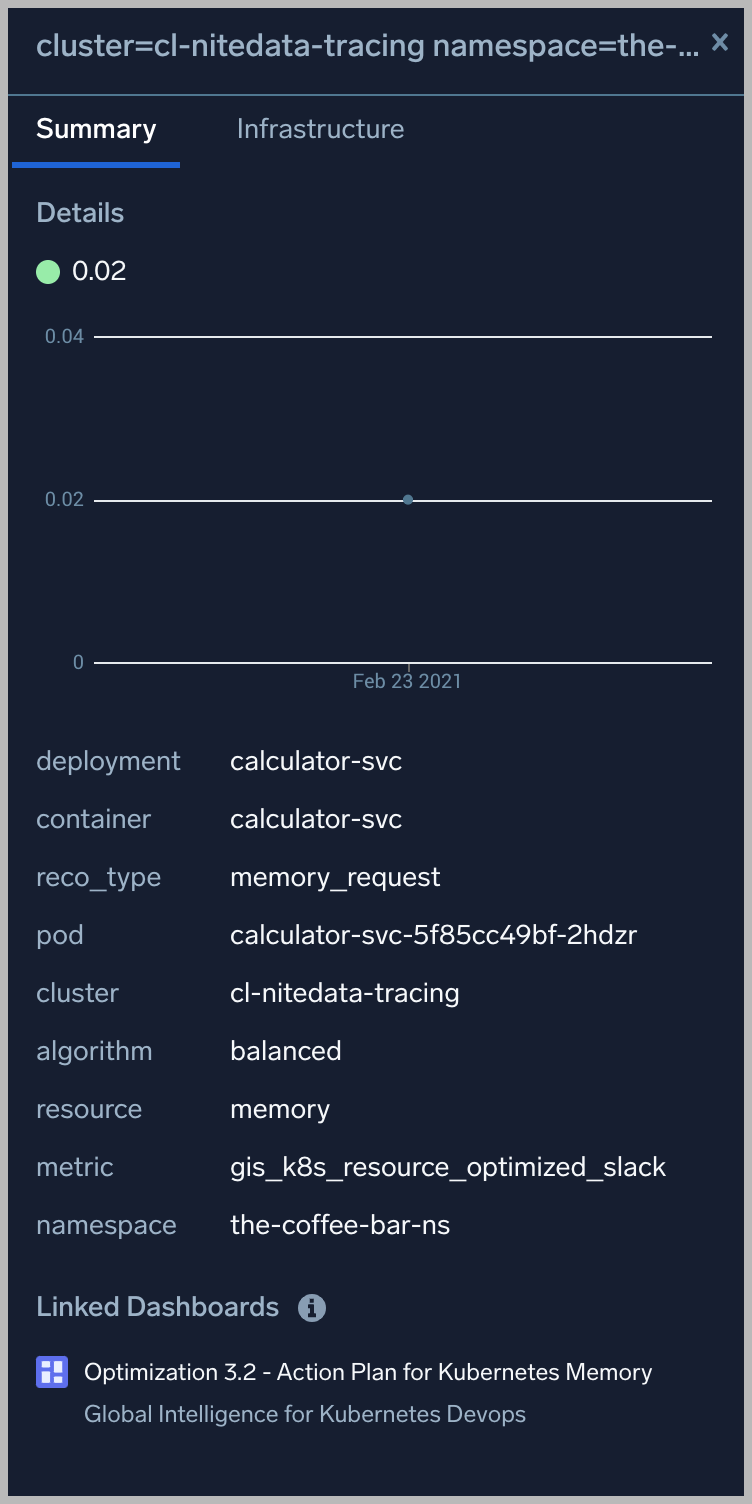
The infrastructure tab of the Entity Inspector is not compatible with Global Intelligence for Kubernetes DevOps and renders a blank page on Dashboards Summary for Kubernetes Deployment and Detail for Kubernetes Deployment. This is because Global Intelligence apps analyze anonymized customer data and do not have a way to identify customer entities required for Entity Inspector.
Deployment-container combinations that have no requests or limits set are not candidates for optimization. No recommendations are computed in these cases.
Concepts, definitions and methodology
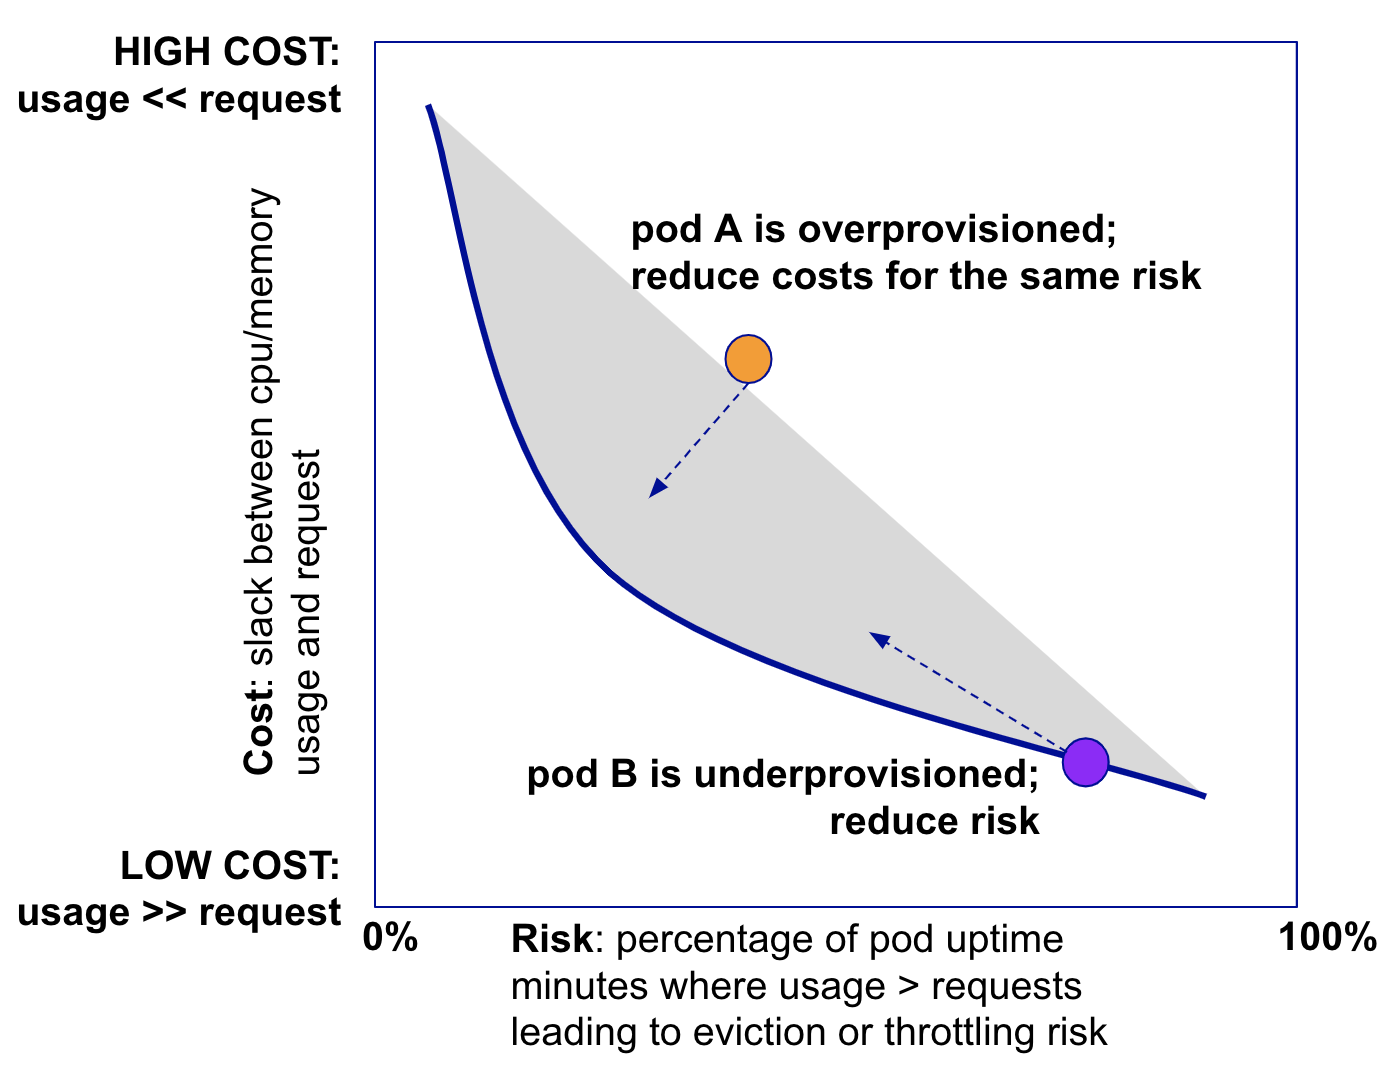
It is relatively well known that DevOps staff concerned about Out of Memory (OOM) and CPU throttling may set high memory and CPU requests on their containers. This results in situations where Kubernetes clusters are over-provisioned compared to actual usage. Conversely, Kubernetes clusters may be underprovisioned, leading to risk of OOM and throttling and resulting downtime.
The slack is the difference between usage and requests measures cost for both cpu (cores) and memory (GB). Higher slack implies higher costs as cpu and memory used are less than what has been provisioned for a given container. Conversely, negative slack, while saving costs, increased the risk of container eviction due to memory overages or container throttling. These latter events impact application availability and performance and may lead to incidents. The cost-risk tradeoff is diagrammed below.
The input for the optimization is time series data for each container’s cpu, memory usage, and requests over the past eight days. A given container can behave differently depending on the pod in which it is deployed. For example, an nginx container in Pod A may behave differently from the same container in Pod B. As a result, GI Kubernetes DevOps detects unique deployment-container combinations called "container groups", analyzes cpu and memory time series data for them and recommends optimal requests and limits based on the best combination of slack (or cost) and risk. The recommendations cover three scenarios; pick the one that best serves the needs of your application:
- Cost-optimized. Lowest slack (or cost) accompanied with relatively higher risk (measured by percent at-risk minutes for the deployment-container)
- Reliability-optimized. Highest slack (or cost) accompanied with relatively lower risk (measured by percent at-risk minutes for the deployment-container)
- Balanced. Strikes the balance between cost and risk; cost is relatively higher than the cost-optimized scenario while risks are relatively lower.
Time series data for usage and requests is summarized for each deployment-container combination to compute slack as follows:
- Time series are bucketed into 15m epochs and summarized using 15m averages.
- Usage is represented by the p95 value over the calendar day over all deployment-container combinations. Let's call this
usage_15m_p95_1d(deployment_container). - Request is represented by the average over the calendar day of 15m epochs for each deployment-container combination. Let's call this
request_15m_avg_1d(deployment_container). - Next, slack for a calendar day in any 15m epoch for any deployment-container combination is calculated as
slack_15m_1d(deployment_container) = request_15m_avg_1d(deployment_container) - usage_15m_p95_1d(deployment_container) - We calculate
slack_8d(deployment_container)as average overslack_15m_1d(deployment_container).slack_8d(deployment_container)is an estimate of the slack in any 15m interval for a given deployment-container combination, based on 8d data. - To calculate the total slack in any 15 epochs in a deployment, we estimate the number of deployment-container instances using 8d data of running deployment-container combinations and multiply it by
slack_8d(deployment_container).
Time series data for usage and requests is summarized for each deployment-container combination to compute risk minutes percent as follows:
- Time series are bucketed into 15m epochs and summarized using 15m averages.
- A given 15m epoch is labeled at-risk if usage is greater than request.
- At-risk epochs for a given deployment-container combination are aggregated over all pod instances that run the deployment-container combination and divided by the total available epochs over that deployment-container combination to estimate the 8d risk percent for that deployment-container combination.
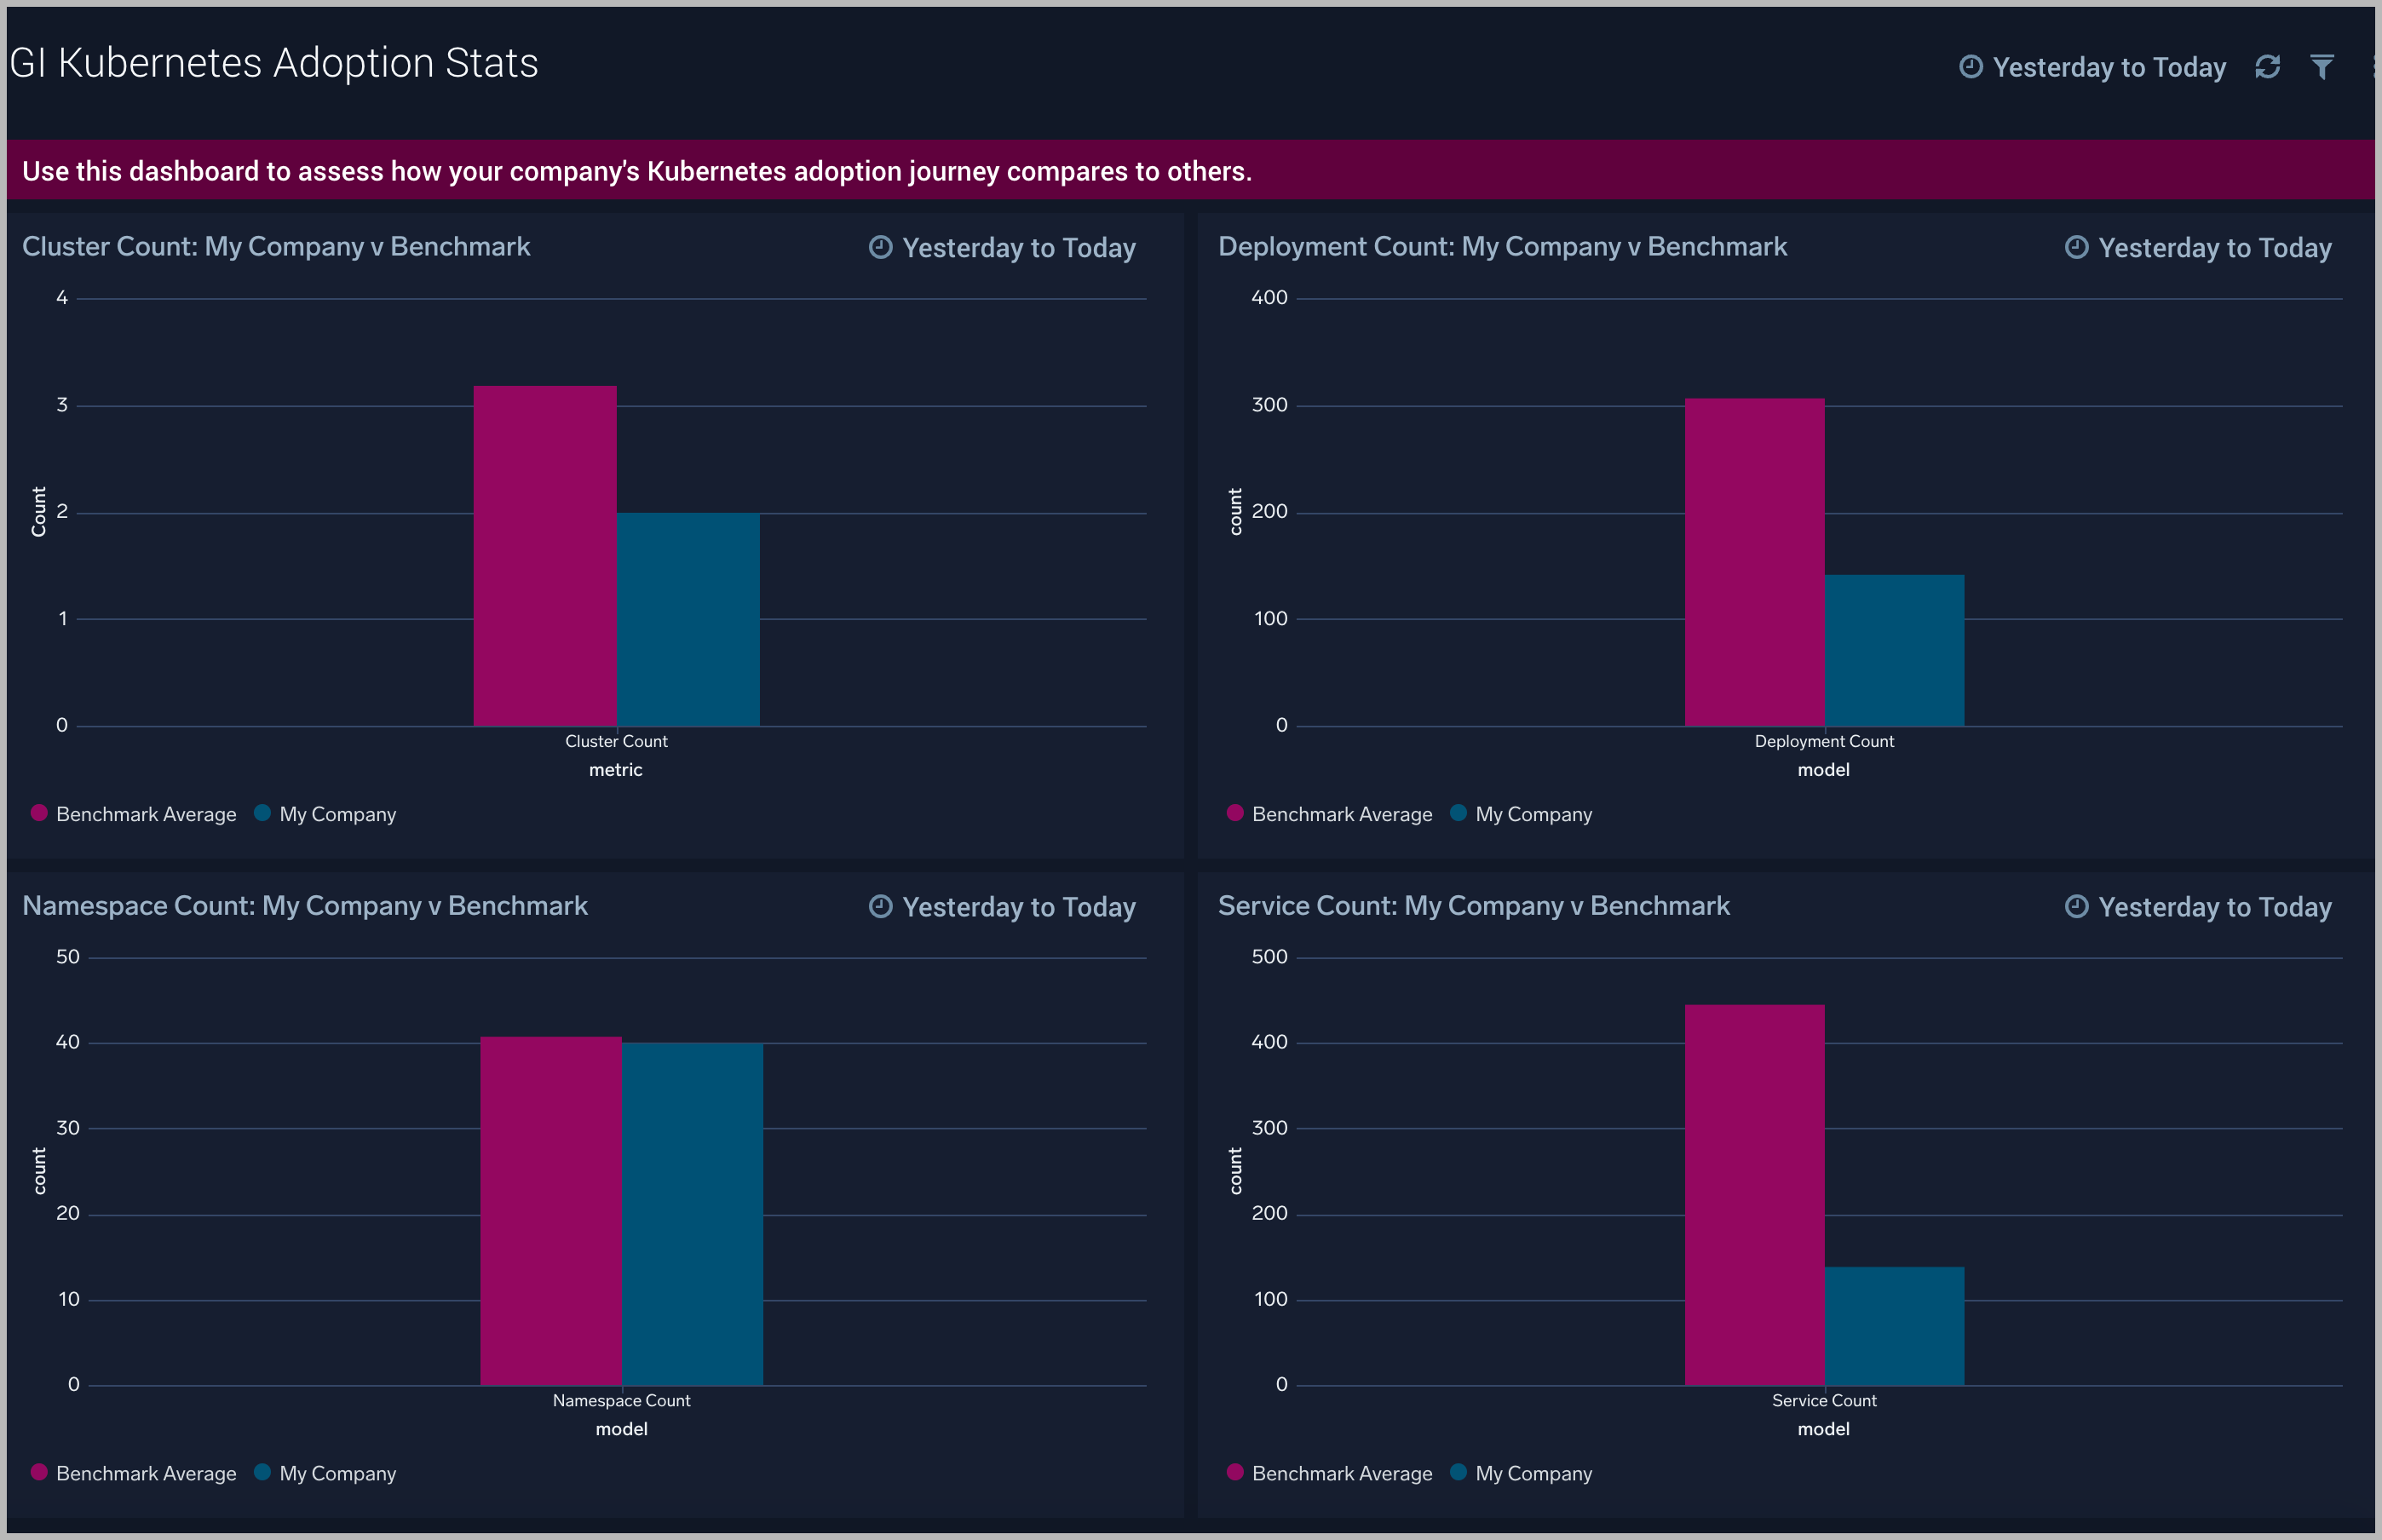
GI Kubernetes DevOps - Adoption Stats
The GI Kubernetes DevOps - Adoption Stats dashboard tabulates the number of clusters, deployments, namespaces and services in your company and compares them to other customers. If your stats are greater than the baseline, it is a strong signal that your Kubernetes adoption is further along compared to other customers.
Use this dashboard to:
- Compare number of clusters, namespaces, deployments and services in your company versus others
- Assess maturity of your Kubernetes adoption compared to other customers
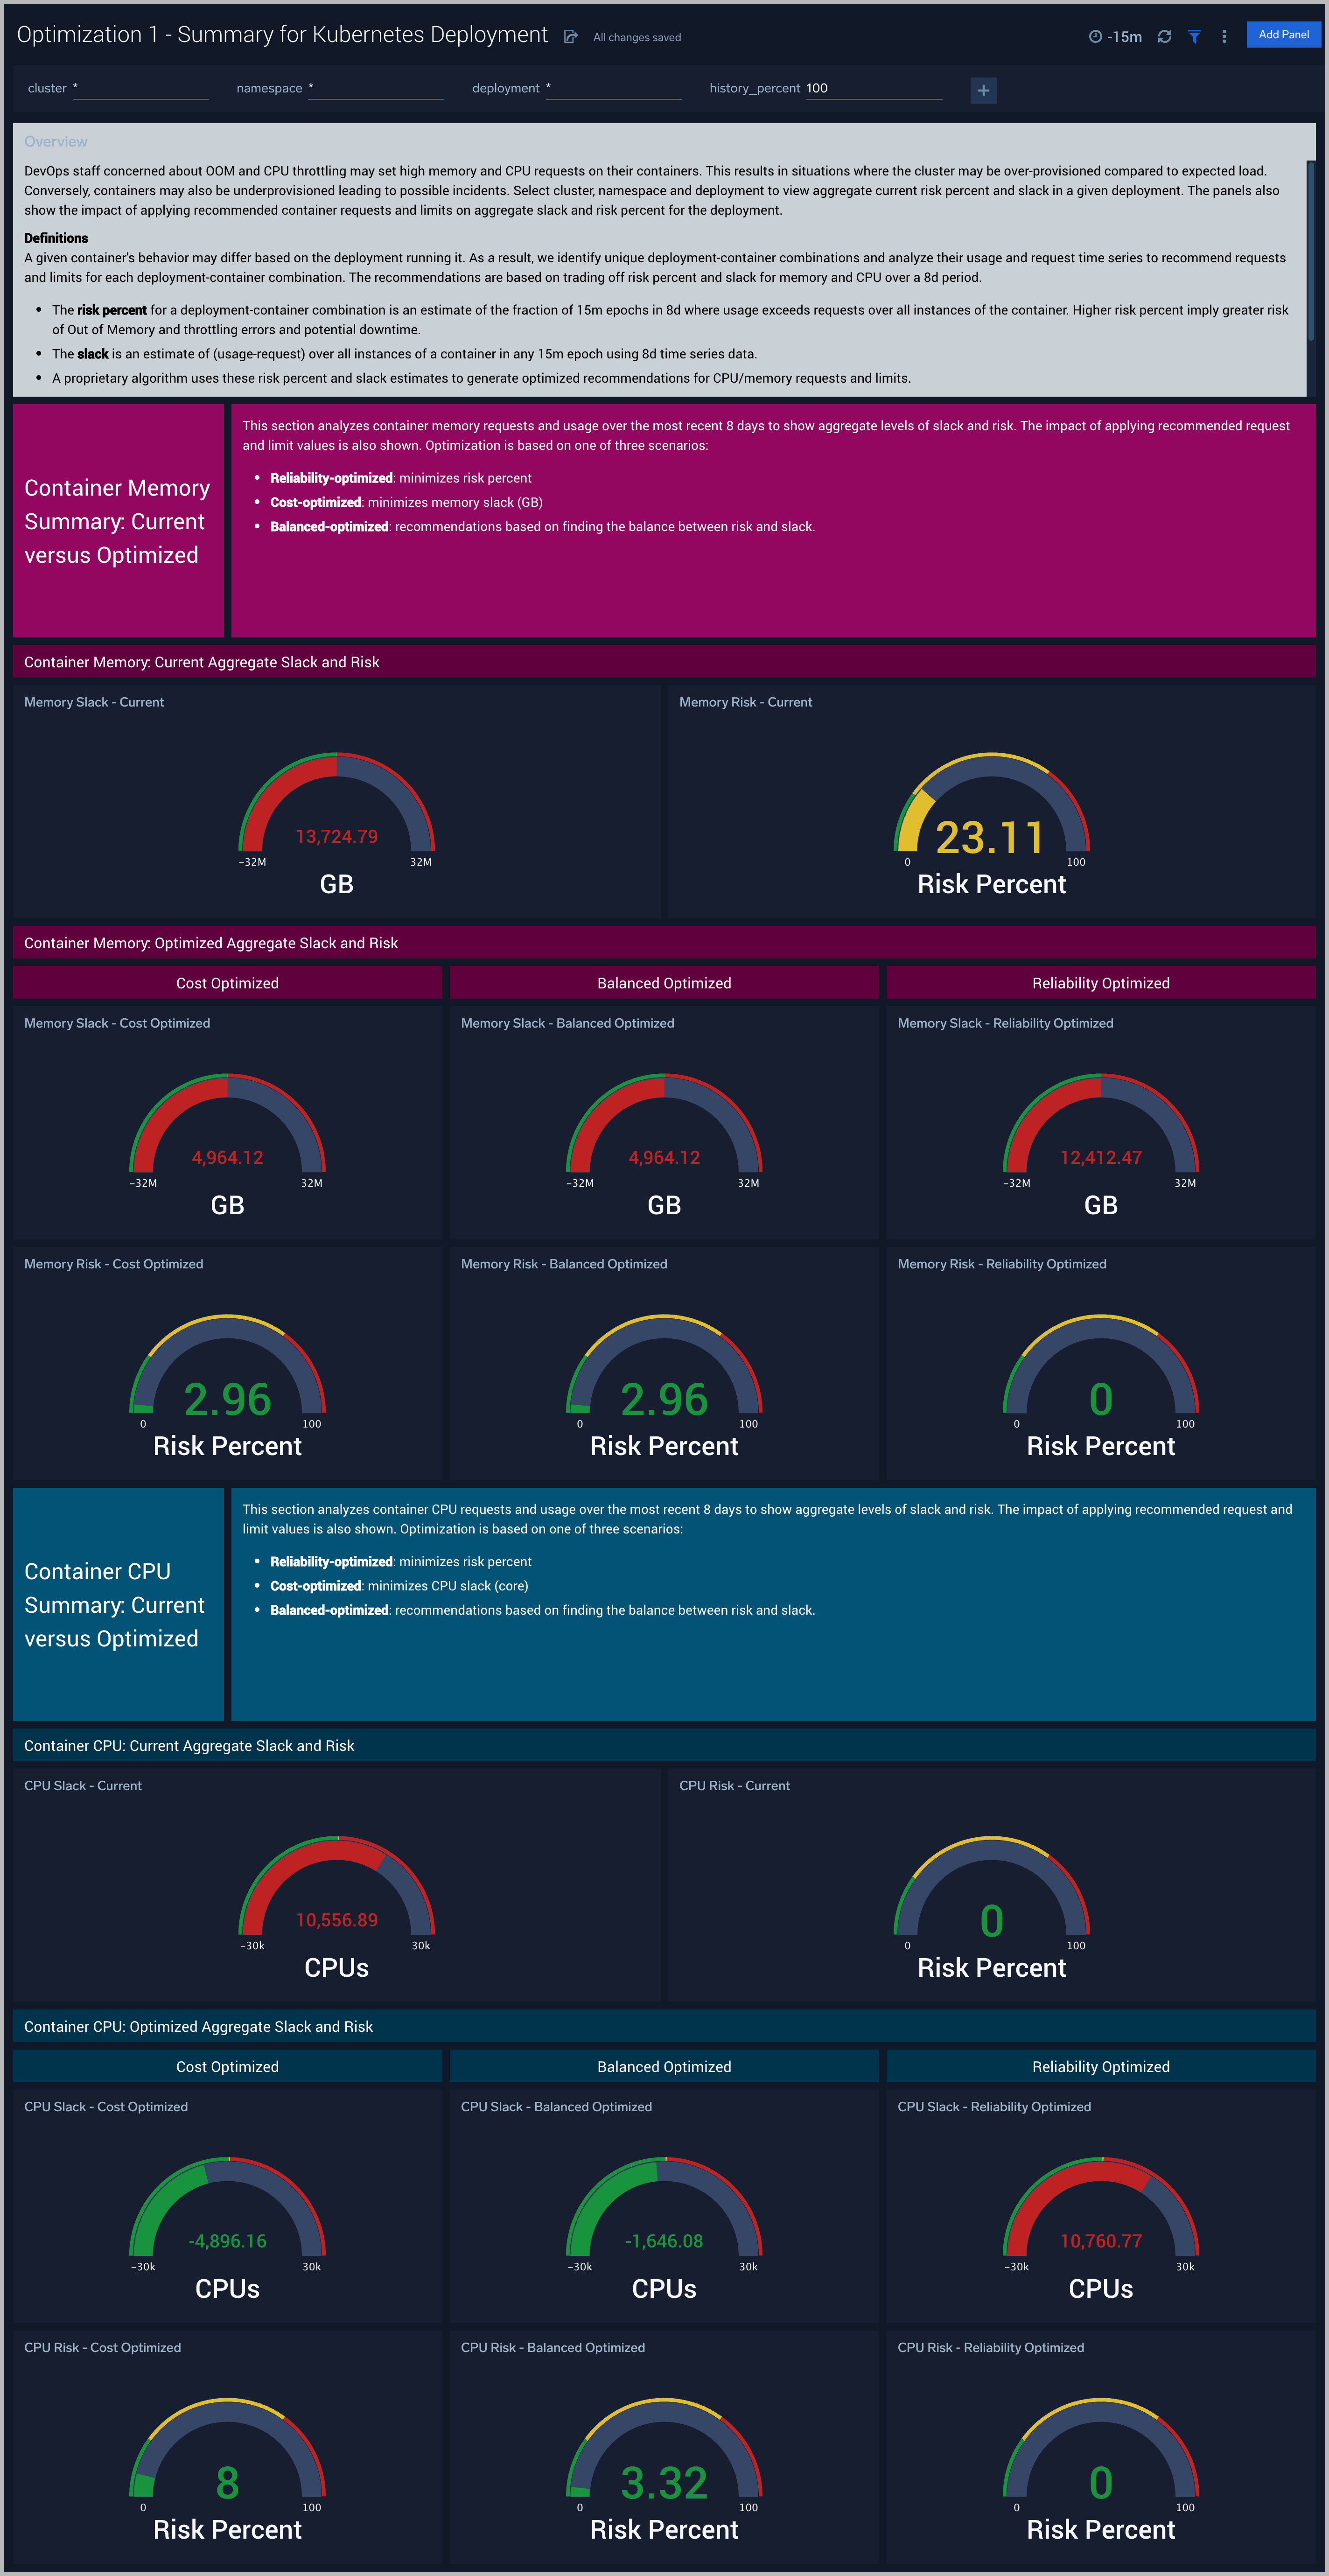
Optimization 1 - Summary for Kubernetes Deployment
The Optimization 1 - Summary for Kubernetes Deployment dashboard shows aggregate current risk percent and slack in a given deployment. In addition, the impact of applying recommended container requests and limits on aggregate slack and risk percent for the deployment.
Use this dashboard to:
- Summarize the aggregate slack and risk percent of any deployment
- Identify deployments to optimize at the level of deployment-containers using GI Kubernetes DevOps - Deployment Optimization Recommendations
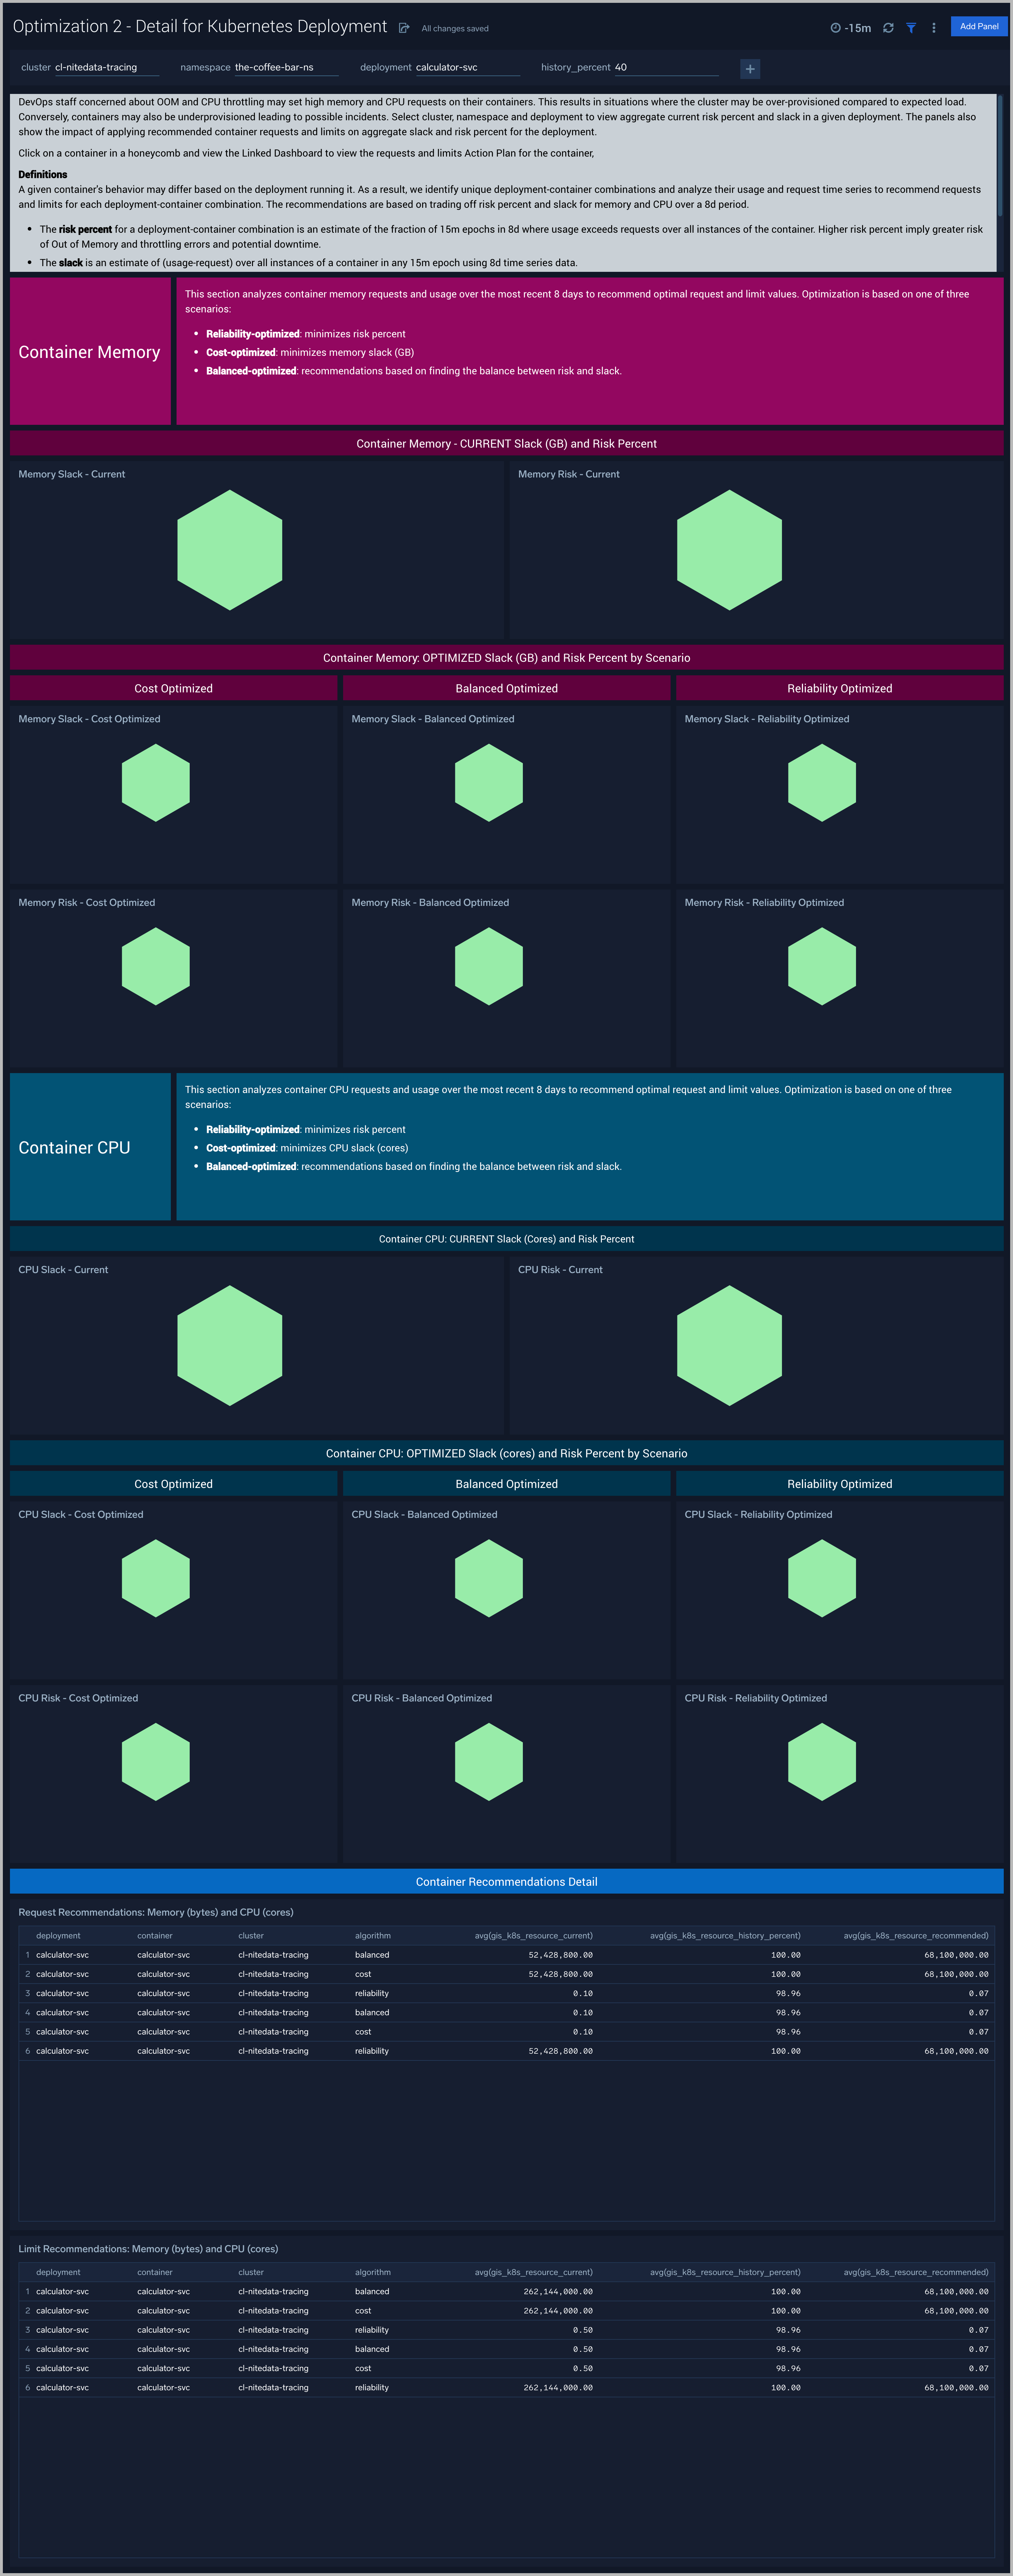
Optimization 2 - Detail for Kubernetes Deployment
The Optimization 2 - Detail for Kubernetes Deployment dashboard provides recommendations for cpu and memory requests and limits for containers based on trading off risk against cost for a given deployment-container combination.
Use this dashboard to:
- Understand cpu and memory time series for each deployment and container combination
- View recommendation for optimizing costs and risks for each deployment and container combination
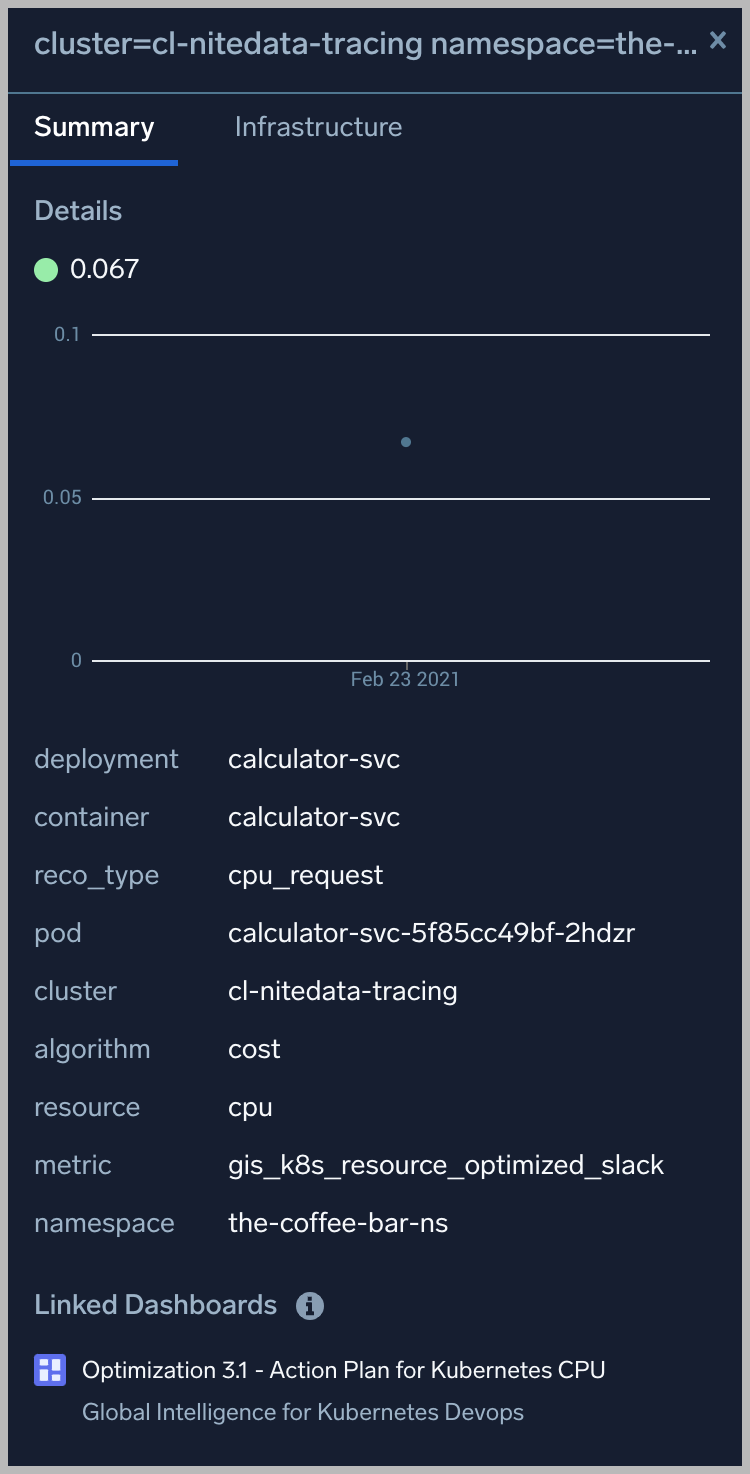
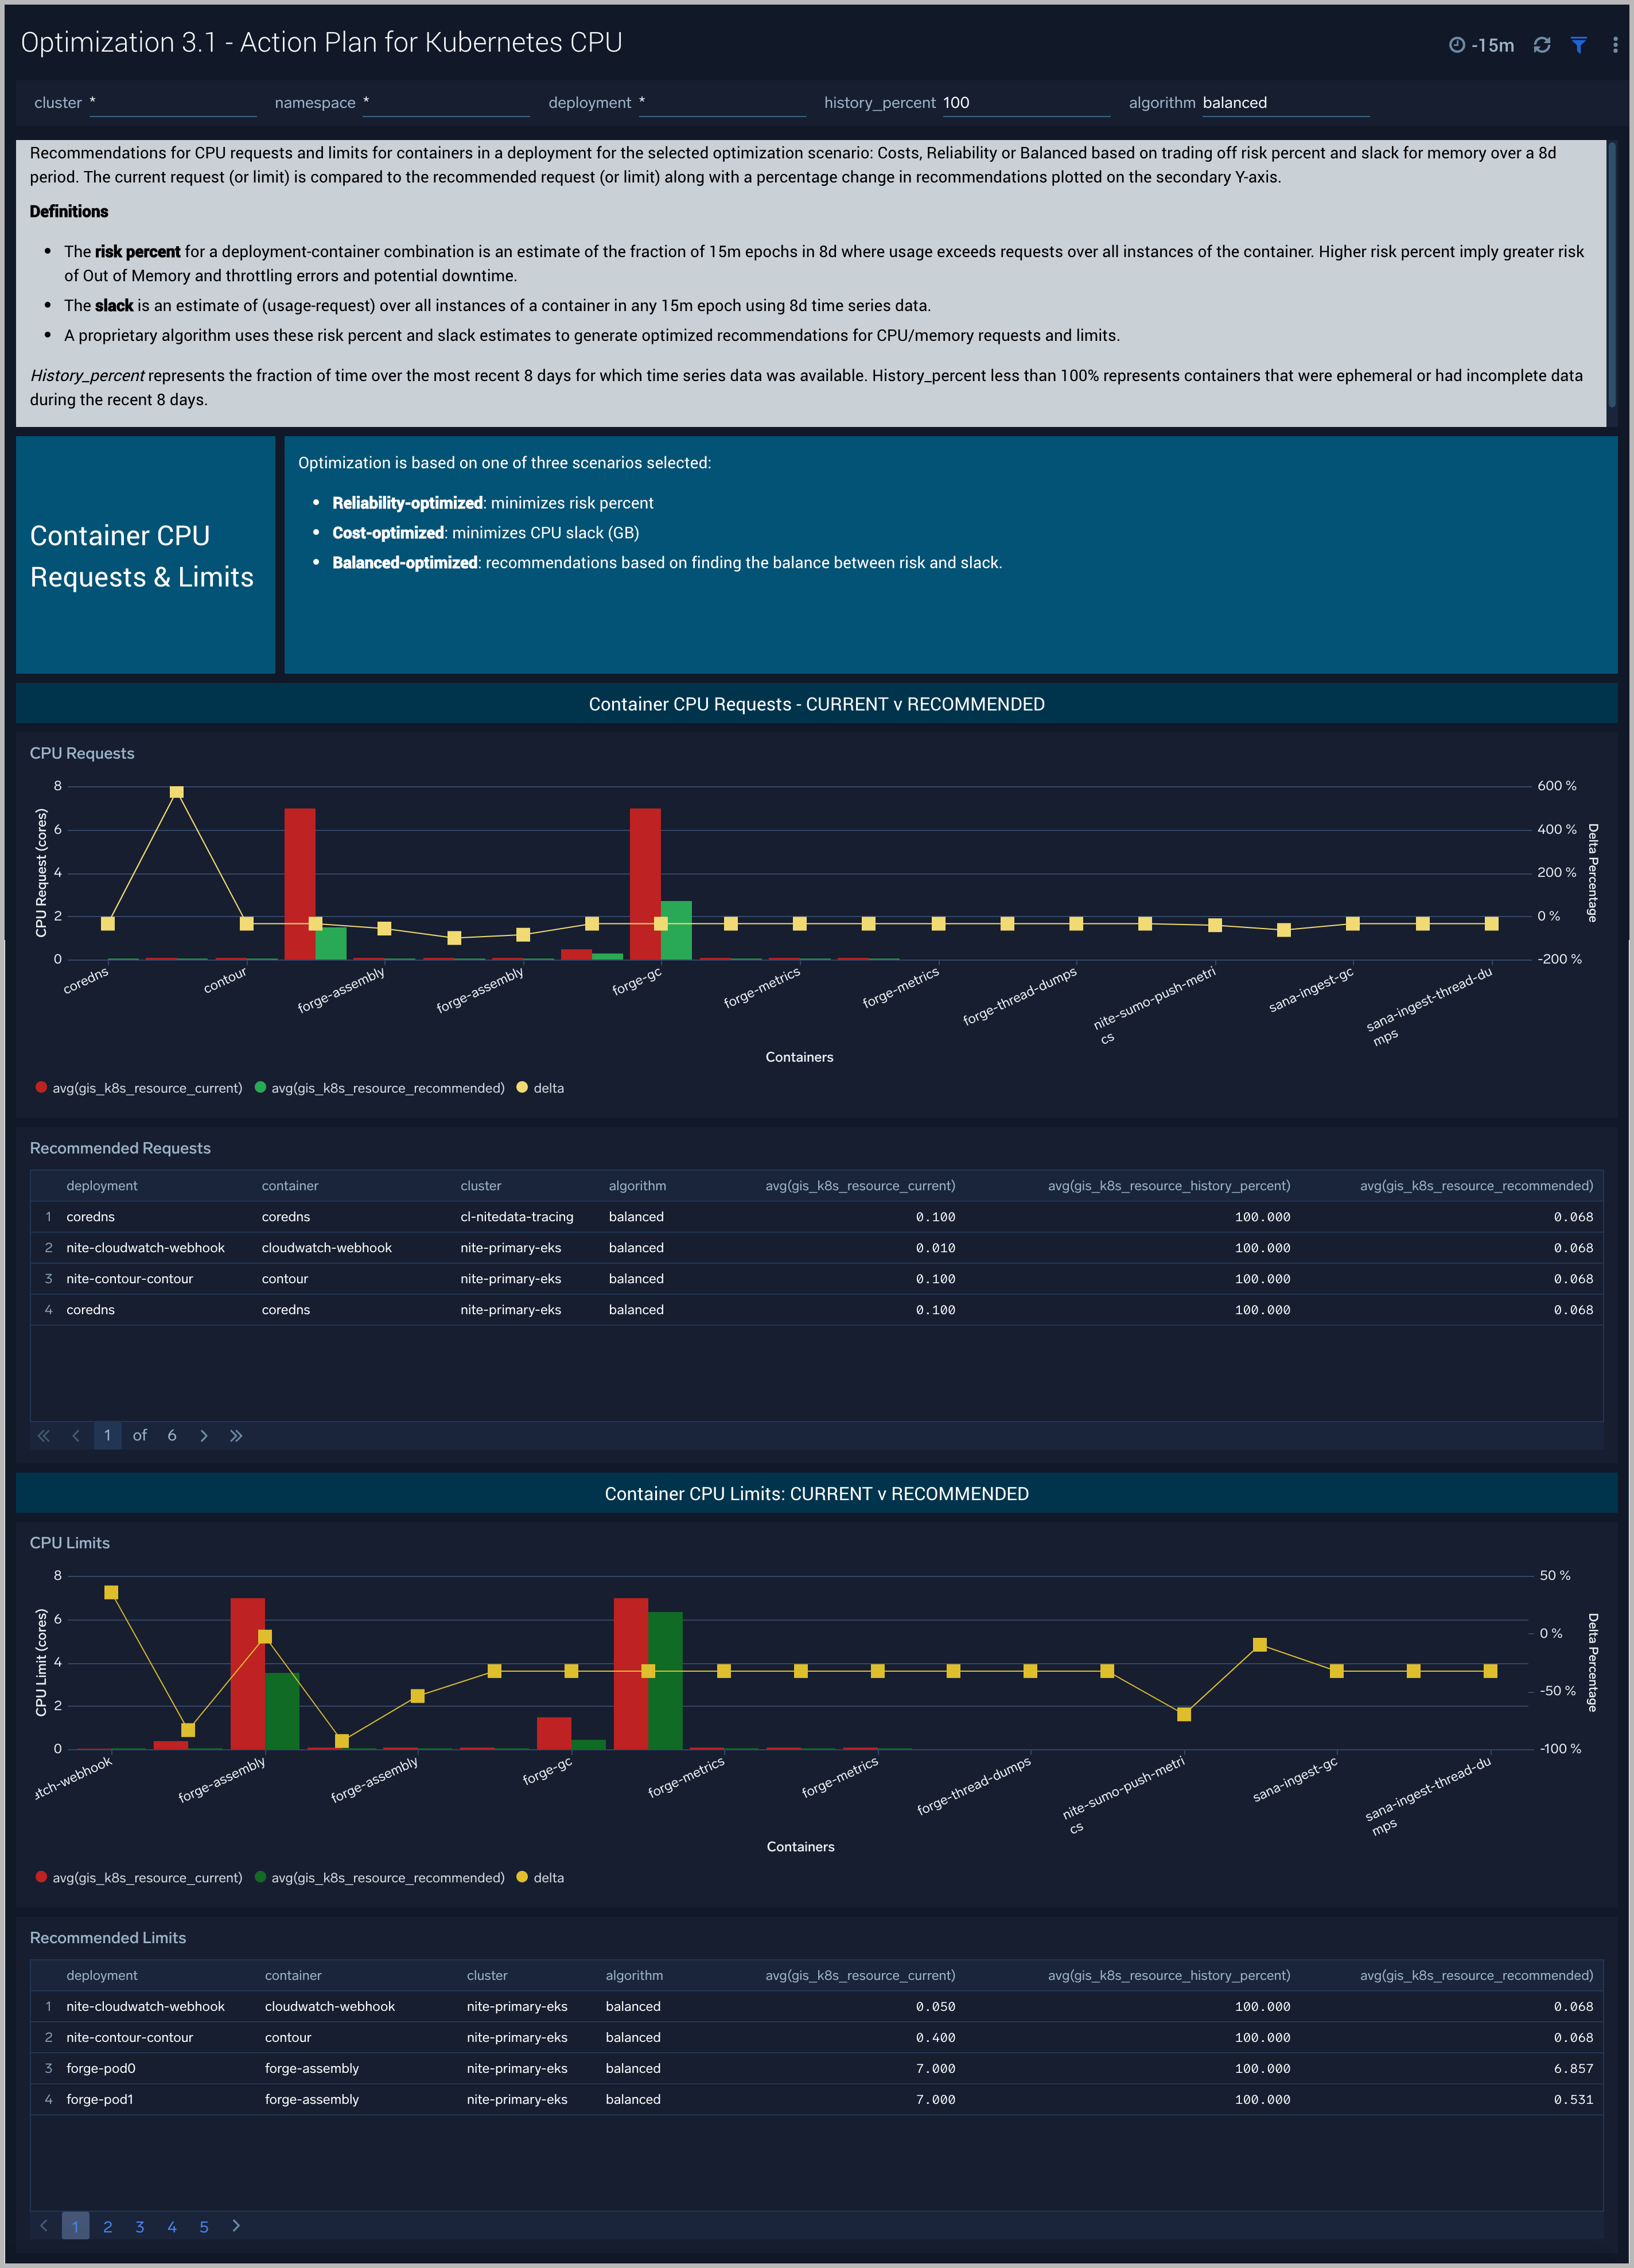
Optimization 3.1 - Action Plan for Kubernetes CPU
The Optimization 3.1 - Action Plan for Kubernetes CPU dashboard provides recommendations for CPU requests and limits for containers in a deployment for the selected optimization scenario: Costs, Reliability or Balanced based on trading off risk percent and slack for memory over a 8d period. The current request (or limit) is compared to the recommended request (or limit) along with a percentage change in recommendations plotted on the secondary Y-axis.
Use this dashboard to:
- Current and recommended CPU settings by container in an deployment
- Compare percent change in CPU
This dashboard is launched by clicking on a honeycomb cell in the Optimization 2 - Detail for Kubernetes Deployment and viewing the Linked Dashboard.
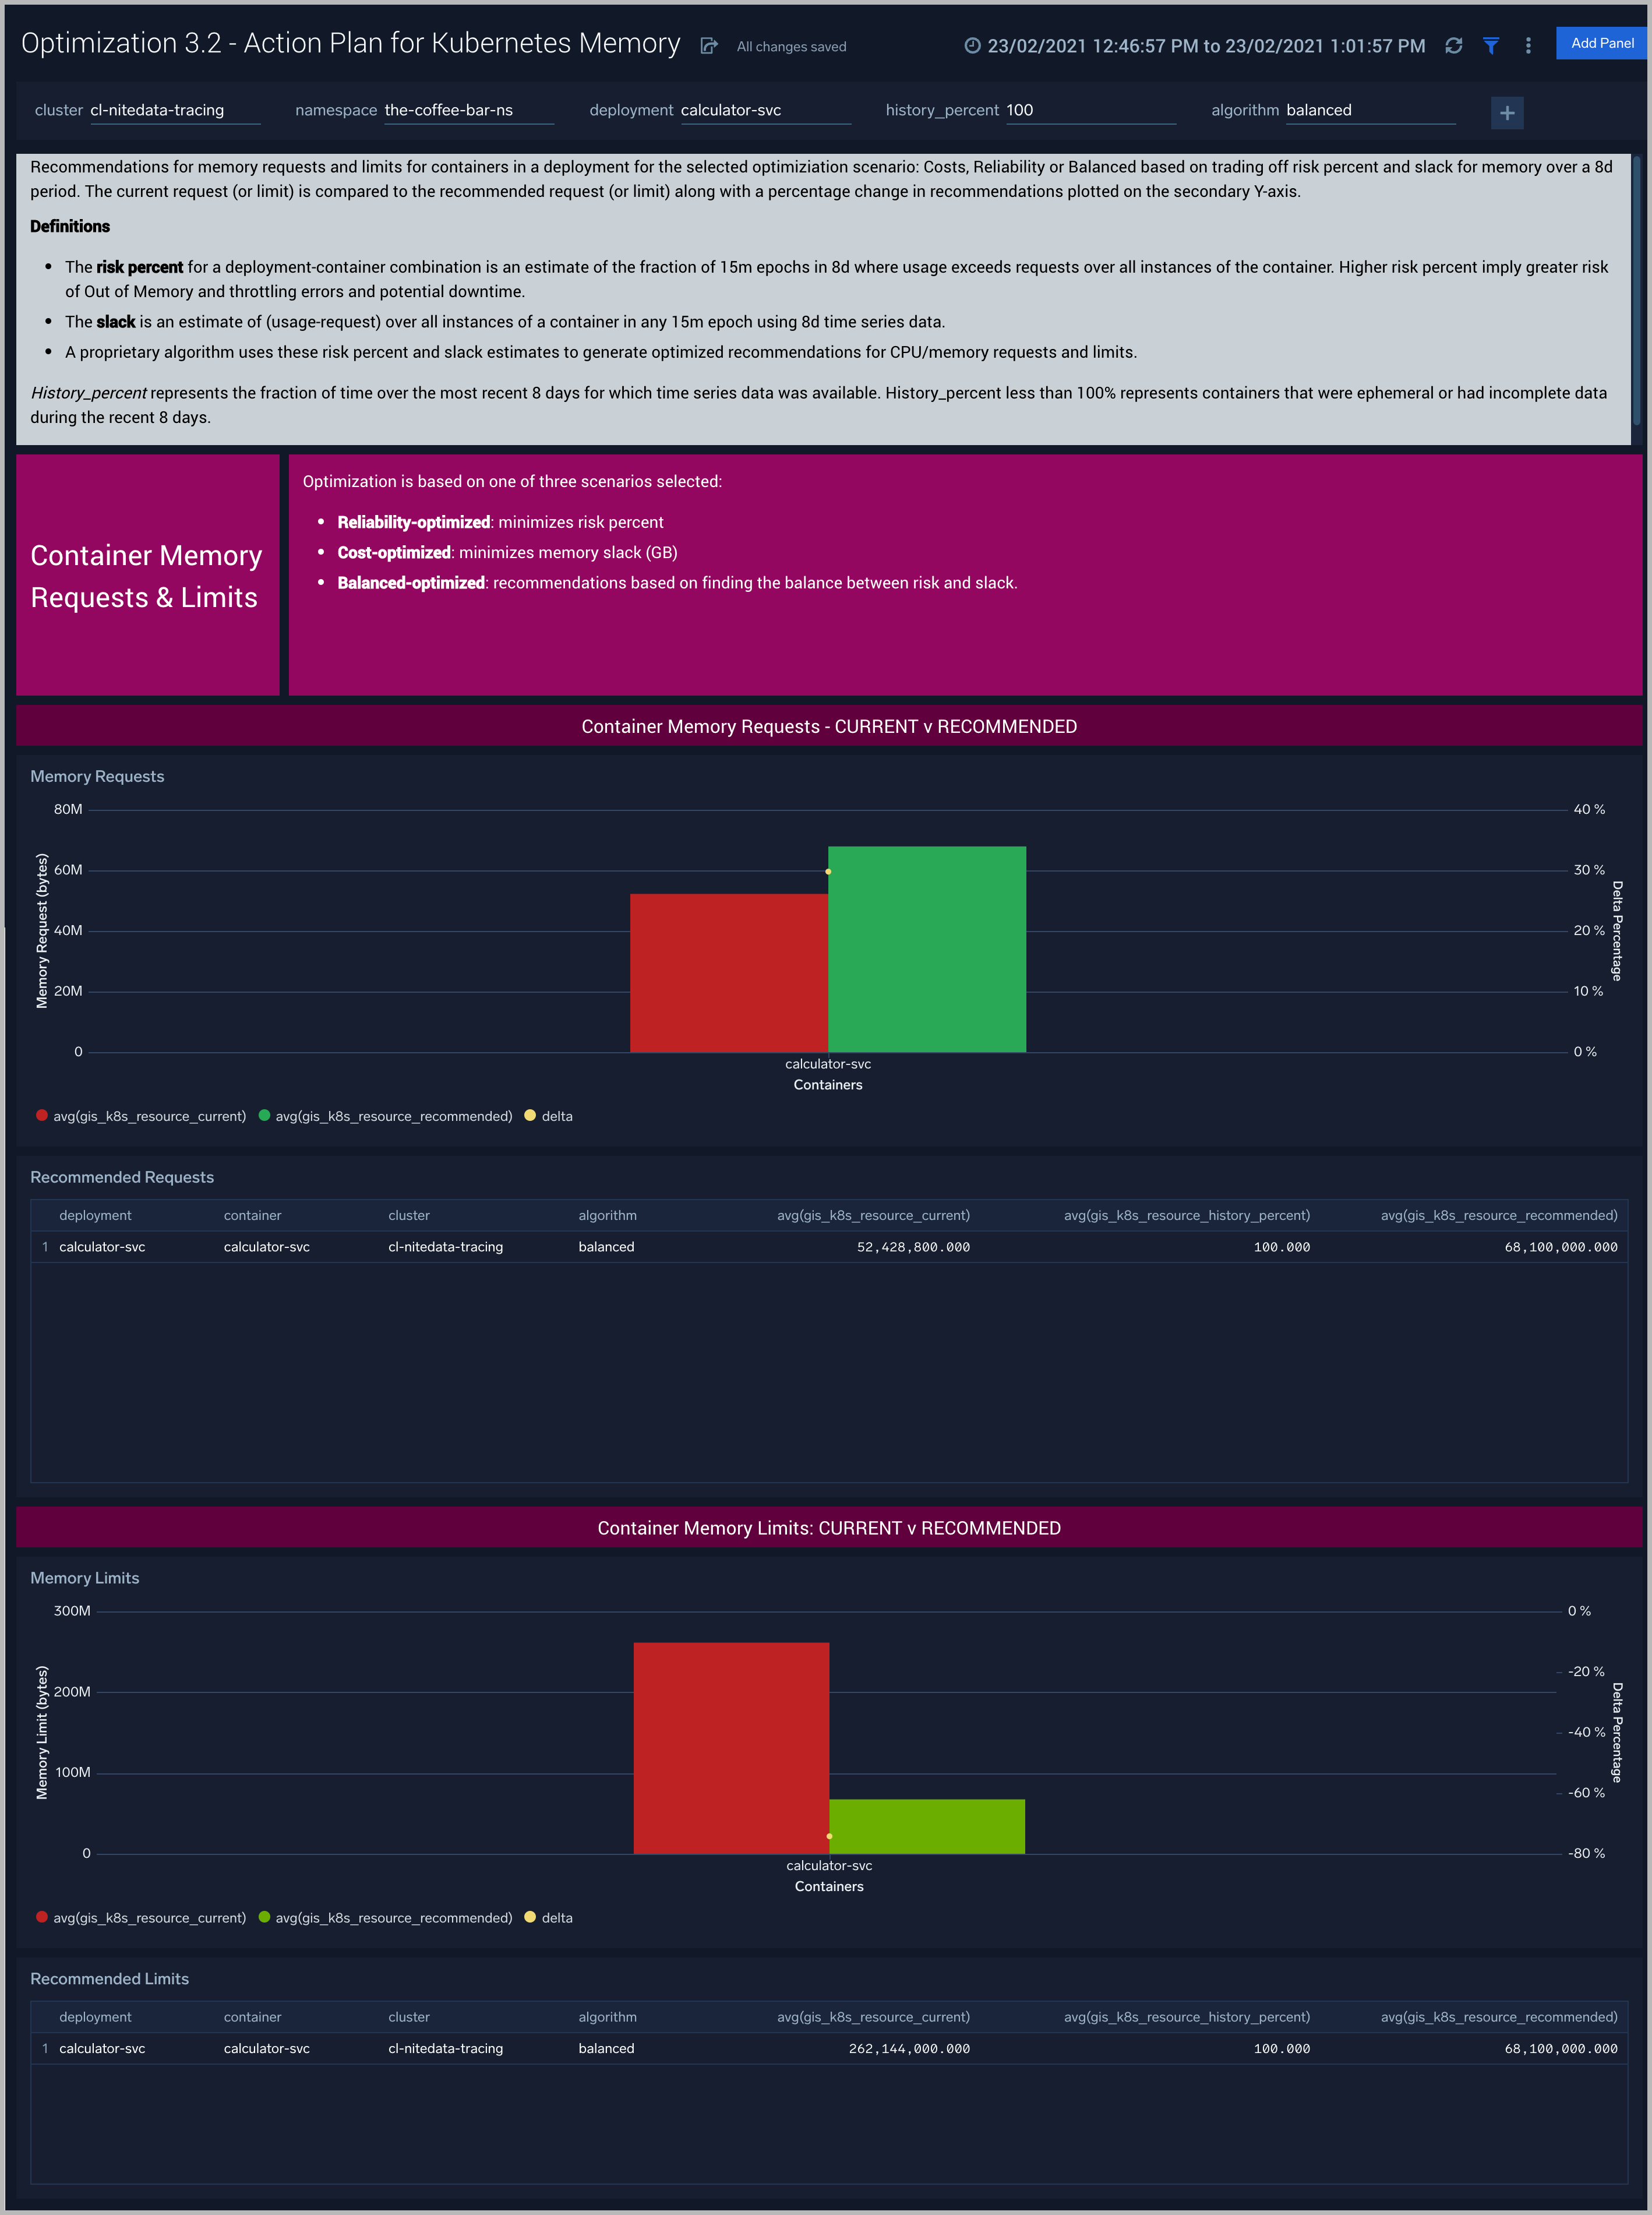
Optimization 3.2 - Action Plan for Kubernetes Memory
The Optimization 3.2 - Action Plan for Kubernetes Memory dashboard provides recommendations for Memory requests and limits for containers in a deployment for the selected optimization scenario: Costs, Reliability or Balanced based on trading off risk percent and slack for memory over a 8d period. The current request (or limit) is compared to the recommended request (or limit) along with a percentage change in recommendations plotted on the secondary Y-axis.
Use this dashboard to:
- Current and recommended memory settings by container in an deployment
- Compare percent change in memory
This dashboard is launched by clicking on a honeycomb cell in the Optimization 2 - Detail for Kubernetes Deployment and viewing the Linked Dashboard.
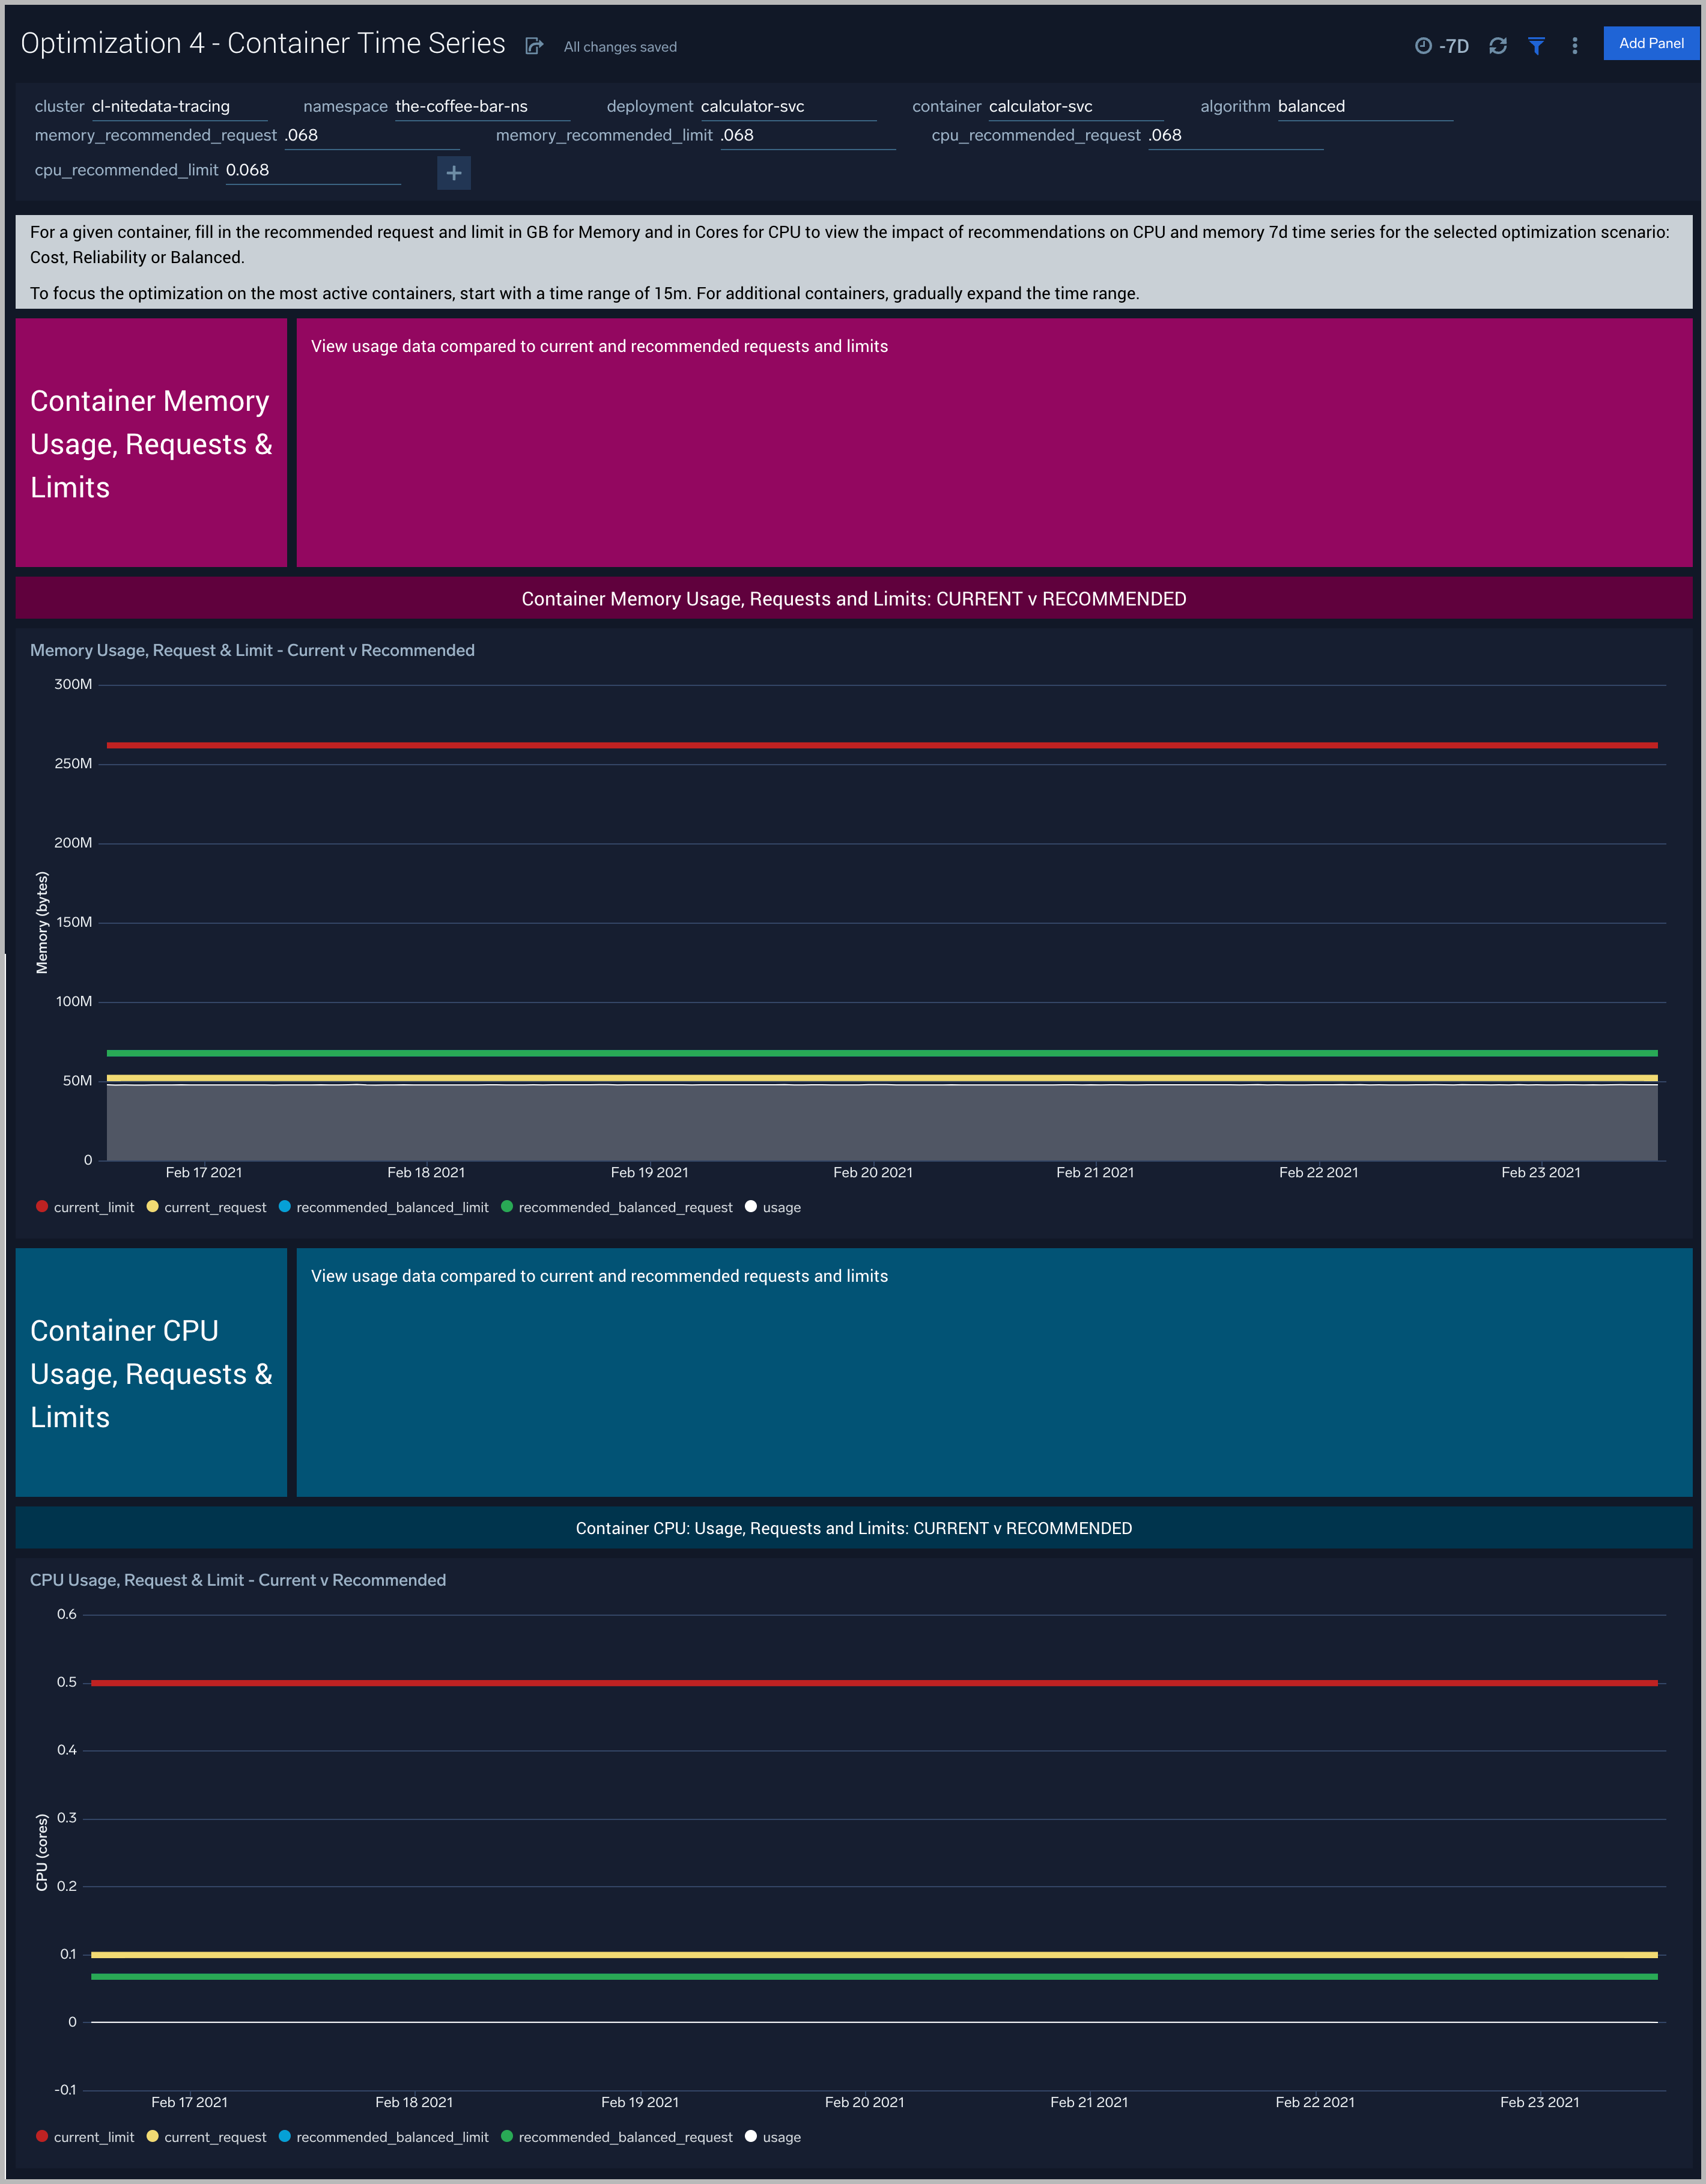
Optimization 4 - Container Time Series
The Optimization 4 - Container Time Series dashboard visualizes, for a given container, the impact of recommendations on CPU and memory 7d time series for the selected optimization scenario: Cost, Reliability or Balanced. Please fill in the recommended request and limit in GB for Memory and in Cores for CPU from Optimization 3.1 or 3.2 - Action Plan for Kubernetes CPU/Memory.
Use this dashboard to:
- Compare 7d usage with current and recommended memory request and limit settings by container in an deployment
- Compare 7d usage with current and recommended CPU request and limit settings by container in an deployment
This dashboard is launched by clicking on a datapoint in the Optimization 3.1 or 3.2 - Action Plan for Kubernetes CPU/Memory and viewing the Linked Dashboard.
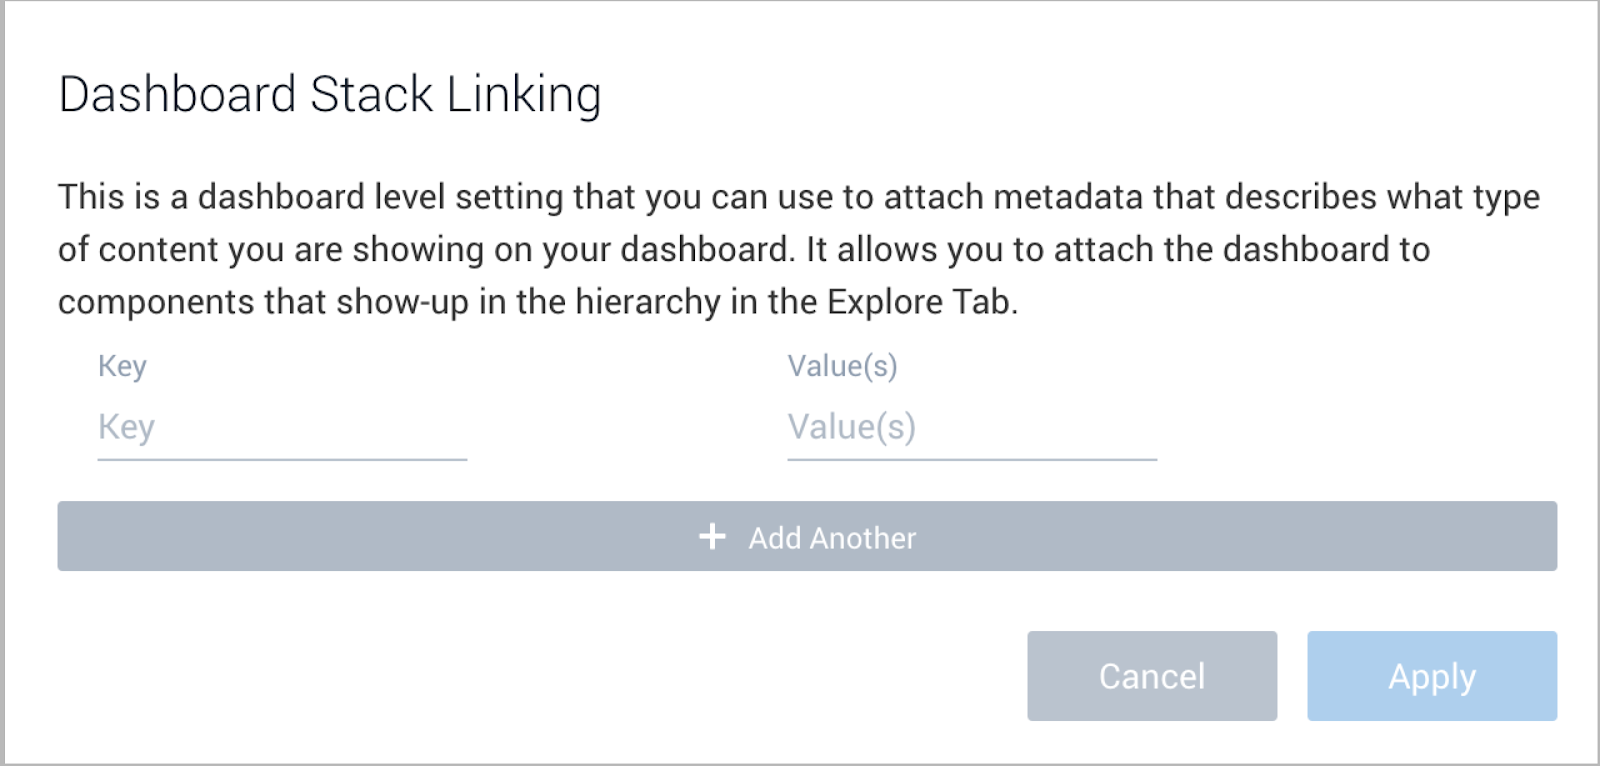
Dashboard Integration
Stack linking for the Optimization 1 - Summary for Kubernetes Deployment and Optimization 2 - Detail for Kubernetes Deployment dashboards will appear with the Kubernetes views associated with your Kubernetes deployment. If necessary, check stack linking settings as below.
Sumo Logic combines metrics, logs, and events to a create real-time unified view of the performance, uptime, and security of your Kubernetes environment, the Sumo Logic Kubernetes Solution leverages the standards endorsed by the Cloud Native Computing Foundation (CNCF), and utilizes the extensive ecosystem of existing integrations for monitoring and troubleshooting Kubernetes platforms.
Sumo Logic utilizes consistent tagging across logs, metrics, events, and security data, resulting in the centralization of enrichment data throughout your Kubernetes environment. Consistent tagging enables administrators to correlate data for metrics, logs, and events for their applications. They can then view the results in Sumo Logic App pre-defined dashboards for analysis and troubleshooting.