Google Kubernetes Engine
Google Kubernetes Engine (GKE) provides a managed environment where you can easily deploy, manage, and scale your container-based applications using the Google Cloud infrastructure.
The Sumo Logic app for Google Kubernetes Engine (GKE) - Control Plane allows you to monitor resource-related logs and metrics for Kubernetes deployments, clusters, namespaces, pods, containers, and daemonsets. The app provides visibility into the GKE control plane with operational insights into the API server, control manager, and worker nodes. This app works in conjunction with Sumo Logic Kubernetes app, that provides visibility into worker node metrics and application logs.
Supported versions
The following are the minimum supported requirements for this application:
- For Kubernetes: 1.10 and later
- For GKE:
- 1.19.16-gke.8300.
- 1.20.15-gke.2500.
- 1.21.9-gke.1002.
- 1.21.10-gke.400.
- 1.22.7-gke.300.
- 1.22.7-gke.900.
- 1.23.5-gke.1501
- 1.11.10-gke.5
- 1.12.8-gke.10
- 1.12.7-gke.25
- 1.13.12-gke.30
- 1.14.10-gke.1504
- 1.15.12-gke.4002
- 1.16.15-gke.2601
- 1.17.12-gke.2502
- 1.18.20-gke.6000
Log types
By default, GKE clusters are natively integrated with Cloud Logging (and Monitoring). When you create a GKE cluster, both Monitoring and Cloud Logging are enabled by default. The GKE Sumo Logic app uses Google Cloud Logging.
Sample log messages
{
  "message":{
    "attributes":{
      "logging.googleapis.com/timestamp":"2019-06-26T10:41:00.394447795Z"
    },
    "data":{
      "insertId":"qmuyjp0a5yrmvuyzy",
      "labels":{
        "k8s-pod/app":"prometheus",
        "k8s-pod/controller-revision-hash":"prometheus-prometheus-operator-prometheus-67f77458d4",
        "k8s-pod/prometheus":"prometheus-operator-prometheus",
        "k8s-pod/statefulset_kubernetes_io/pod-name":"prometheus-prometheus-operator-prometheus-0"
      },


"logName":"projects/product-sandbox-1/logs/stderr",
      "receiveTimestamp":"2019-06-26T10:41:05.973133299Z",
      "resource":{
        "labels":{
          "cluster_name":"gke-engine-monitoring",
          "container_name":"prometheus",
          "location":"us-central1-a",
          "namespace_name":"sumologic",
          "pod_name":"prometheus-prometheus-operator-prometheus-0",
          "project_id":"product-sandbox-1"
        },
        "type":"k8s_container"
      },
      "severity":"ERROR",
      "textPayload":"ts=2019-06-26T10:41:00.394Z caller=dedupe.go:111 component=remote level=info queue=13:http://fluentd:9888/prometheus.metrics.apiserver msg=\"Remote storage resharding\" from=6 to=3\n",
      "timestamp":"2019-06-26T10:41:00.394447795Z"
    },
    "messageId":"597120419207003",
    "message_id":"597120419207003",
    "publishTime":"2019-06-26T10:41:06.382Z",
    "publish_time":"2019-06-26T10:41:06.382Z"
  },
"subscription":"projects/product-sandbox-1/subscriptions/sumo_gke"
}
{
  "message":{
    "attributes":{
      "logging.googleapis.com/timestamp":"2019-06-26T10:44:04.40824208Z"
    },
    "data":{
      "insertId":"hz9rs3tndyceb4rvh",
      "labels":{
        "k8s-pod/component":"test-logger",
        "k8s-pod/pod-template-hash":"7896bcb5cd"
      },
      "logName":"projects/product-sandbox-1/logs/stdout",
      "receiveTimestamp":"2019-06-26T10:44:06.456680433Z",
      "resource":{
        "labels":{
          "cluster_name":"gke-engine-monitoring",
          "container_name":"test-logger",
          "location":"us-central1-a",
          "namespace_name":"default",
          "pod_name":"test-logger-7896bcb5cd-954mz",
          "project_id":"product-sandbox-1"
        },
        "type":"k8s_container"
      },
      "severity":"INFO",
      "textPayload":"Processing credit card 1234 5678 9012 3456\n",
      "timestamp":"2019-06-26T10:44:04.40824208Z"
    },
    "messageId":"597120030247162",
    "message_id":"597120030247162",
    "publishTime":"2019-06-26T10:44:06.965Z",
    "publish_time":"2019-06-26T10:44:06.965Z"
  },
  "subscription":"projects/product-sandbox-1/subscriptions/sumo_gke"
}
{
  "message":{
"attributes":{
   "logging.googleapis.com/timestamp":"2019-06-26T10:38:14Z"
},
"data":{
   "insertId":"1o05pug1iym1ef",
   "jsonPayload":{
     "apiVersion":"v1",
     "involvedObject":{
       "apiVersion":"v1",
       "kind":"Pod",
       "name":"mysql-fc99db7b8-jv7tl",
       "namespace":"robot-shop",
       "resourceVersion":"5625122",
       "uid":"5548f14c-8e79-11e9-bbfd-42010a8002a8"
     },
     "kind":"Event",
     "message":"0/3 nodes are available: 3 Insufficient cpu.",
     "metadata":{
       "creationTimestamp":"2019-06-23T21:57:27Z",
       "name":"mysql-fc99db7b8-jv7tl.15aaf2ad63dddd2c",
       "namespace":"robot-shop",
       "resourceVersion":"50268",
       "selfLink":"/api/v1/namespaces/robot-shop/events/mysql-fc99db7b8-jv7tl.15aaf2ad63dddd2c",
       "uid":"e3de27c7-9601-11e9-870d-42010a80023c"
     },
     "reason":"FailedScheduling",
     "source":{
       "component":"default-scheduler"
     },
     "type":"Warning"
   },
   "logName":"projects/product-sandbox-1/logs/events",
   "receiveTimestamp":"2019-06-26T10:38:19.792891713Z",
   "resource":{
     "labels":{
       "cluster_name":"gke-engine-monitoring",
       "location":"us-central1-a",
       "namespace_name":"robot-shop",
       "pod_name":"mysql-fc99db7b8-jv7tl",


"project_id":"product-sandbox-1"
     },
     "type":"k8s_pod"
   },
   "severity":"WARNING",
   "timestamp":"2019-06-26T10:38:14Z"
},
"messageId":"597107305873932",
"message_id":"597107305873932",
"publishTime":"2019-06-26T10:38:20.474Z",
"publish_time":"2019-06-26T10:38:20.474Z"
  },
  "subscription":"projects/product-sandbox-1/subscriptions/sumo_gke"
}
Sample queries
_source="GKE Cloud Logs" error
| parse regex "\"logName\":\"(?<log_name>[^\"]+)\""
| json field=_raw "message.data.jsonPayload.message" as message
| json "message.data.resource.labels" as labels
| json field=labels "project_id", "cluster_name" as project, cluster
| json field=_raw "message.data.timestamp" as timestamp
| count by timestamp, project, cluster,log_name, message
_sourceCategory = "GKE Cloud Logs" logName reason host "\"type\":\"gke_cluster\"" "\"reason\":\"Created\""
| parse regex "\"logName\":\"(?<log_name>[^\"]+)\""
| where log_name matches "projects/*/logs/events"
| json "message.data.resource.labels", "message.data.jsonPayload.source.host" as labels, node
| json field=labels "project_id", "cluster_name" as project, cluster
| timeslice 1h
| count as eventCount by _timeslice, node, cluster, project
| transpose row _timeslice column node, cluster, project
| fillmissing timeslice(1h)
Collecting logs and metrics for GKE - Control Plane app
This section has instructions for configuring log and metric collection for the Sumo Logic app for GKE - Control Plane.
After you install the Sumo Logic Kubernetes app, you configure a hosted collector, HTTP source, and establish Kubernetes collection. You will establish the key components for Google Cloud Platform (GCP) services collection which include Google Logging, and Google Cloud Pub/Sub. Finally, you’ll configure metrics collection.
For GCP integration, Google Logging collects logs from GCP services. Once you’ve configured the pipeline, the logs are published to a Google Pub/Sub topic. A Sumo Logic GCP source on a hosted collector subscribed to that topic ingests the logs into Sumo Logic.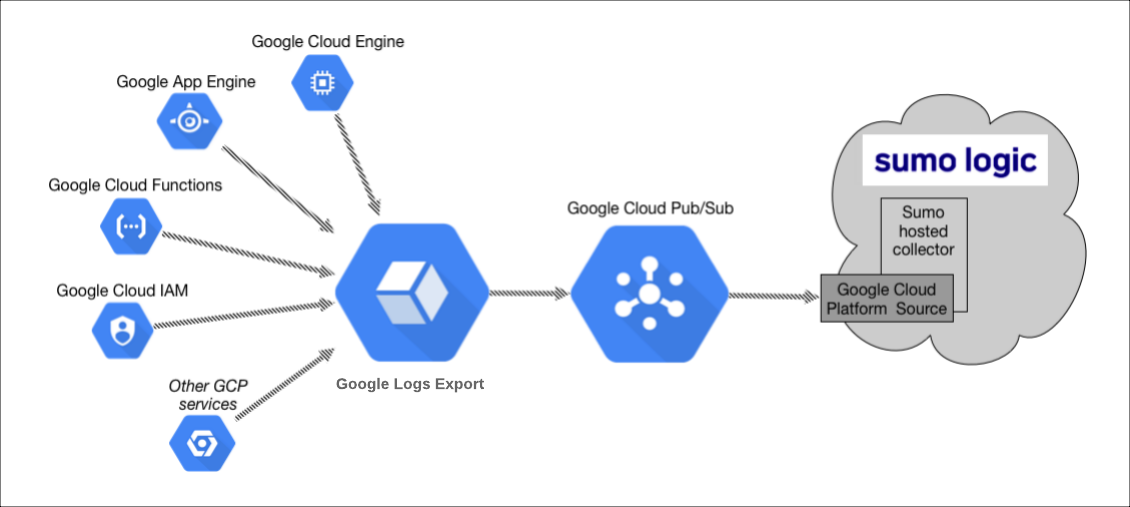
The configuration process includes the following tasks:
- Configure a GCP source on a hosted collector. You'll obtain the HTTP URL for the source, and then use Google Cloud Console to register the URL as a validated domain.
- Create a topic in Google Pub/Sub and subscribe the GCP source URL to that topic.
- Create an export of GCP logs from Google Logging. Exporting involves writing a filter that selects the log entries you want to export, and choosing a Pub/Sub as the destination. The filter and destination are held in an object called a sink.
Set up and install the Kubernetes app
The Sumo Logic Kubernetes app provides the services for managing and monitoring Kubernetes worker nodes. You must set up collection and install the Kubernetes app before configuring collection for the GKE app. You will configure log and metric collection during this process.
Google Cloud Logging for GKE
By default, GKE clusters are natively integrated with Cloud Logging (and Monitoring). When you create a GKE cluster, both Monitoring and Cloud Logging are enabled by default. The GKE Sumo Logic app uses Google Cloud Logging.
Install the Kubernetes app
To set up and install the Kubernetes app, follow the instructions in this document.
Configure a Google Cloud Platform Source
The GCP source receives log data from Google Pub/Sub. The GCP source will only be usable for log data formatted as data coming from Google Pub/Sub.
To configure a Google Platform Source, follow the instructions in this document.
Configure a Pub/Sub topic for GCP
Once you configure the Pub/Sub, you can export data from Google to the Pub/Sub.
To configure a Pub/Sub topic for GCP, follow the instructions in this document.
Create an export of Google Kubernetes Engine logs from Logging
This section walks you through the task of creating an export of Google Kubernetes Engine logs from Logging.
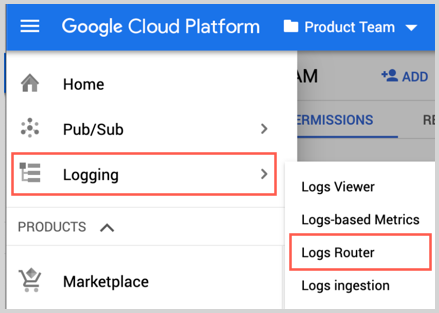
To create an export of GKE logs, do the following:
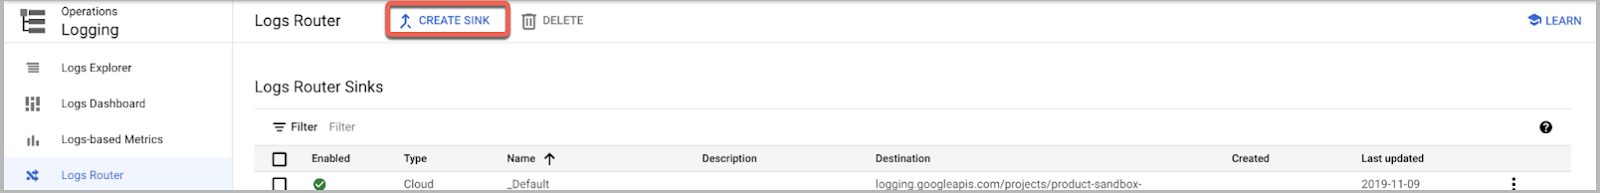
- Go to Logging and click Logs Router.
- Click Create Sink.
- As part of “Create logs routing sink” add the following information:
- Enter a Sink Name. For example, "gce-vm-instance".
- Select "Cloud Pub/Sub" as the Sink Service.
- Set Sink Destination to the Pub/Sub topic you created in the Google Cloud Platform Source procedure. For example, "pub-sub-logs".
- In “Choose logs to include in sink” Section : Determine the GCP services for which you need to get the logs. Also the logsName filter can be added in the inclusion filter for minimizing the logs send to Sumo Logic for the GKE app. This inclusion filter can be taken as:
(resource.type="gke_cluster" OR resource.type="k8s_cluster" OR resource.type="k8s_node" OR resource.type="k8s_pod" )  \
AND (logName="projects/<project_name></em>/logs/events" OR \
logName="projects/<project_name></em>/logs/kube-proxy" OR \
logName="projects/<project_name></em>/logs/kubelet" OR \
logName="projects/<project_name></em>/logs/cloudaudit.googleapis.com%2Factivity" OR \
logName="projects/<project_name></em>/logs/node-problem-detector" OR \
logName="projects/<project_name></em>/logs/container-runtime" OR \
logName="projects/<project_name></em>/logs/docker" OR \
logName="projects/<project_name></em>/logs/kube-node-installation")
- Click Create Sync.
Installing the GKE - Control Plane app
This section provides instructions for installing the GKE - Control Plane app, as well as descriptions and examples for each of the dashboards.
Now that you have set up collection for GKE, install the Sumo Logic app for GKE - Control Plane and access the pre-configured Kubernetes dashboards that provide visibility into your GKE environment.
To install the app, do the following:
- Locate and install the app from the App Catalog. If you want to see a preview of the dashboards included with the app before installing, click Preview Dashboards.
- From the App Catalog, search for app and select it.
- To install the app, click Add to Library and complete the following fields.
- App Name. You can retain the existing name, or enter a name of your choice for the app.
- Data Source. For GKE Log Source, leave Source Category selected, and enter the value of source category which you used while configuring the Google Cloud Platform (GCP) Source.
- Advanced. Select the Location in Library (the default is the Personal folder in the library), or click New Folder to add a new folder.
- Click Add to Library.
All the dashboards are linked to the Kubernetes views so they can be easily accessed by clicking on Cluster from side navigation of the tab.
Viewing GKE Dashboards
Template variables provide dynamic dashboards that can rescope data on the fly. As you apply variables to troubleshoot through your dashboard, you view dynamic changes to the data for a quicker resolution to the root cause. You can use template variables to drill down and examine the data on a granular level. For more information, see Filter with template variables.
API Server
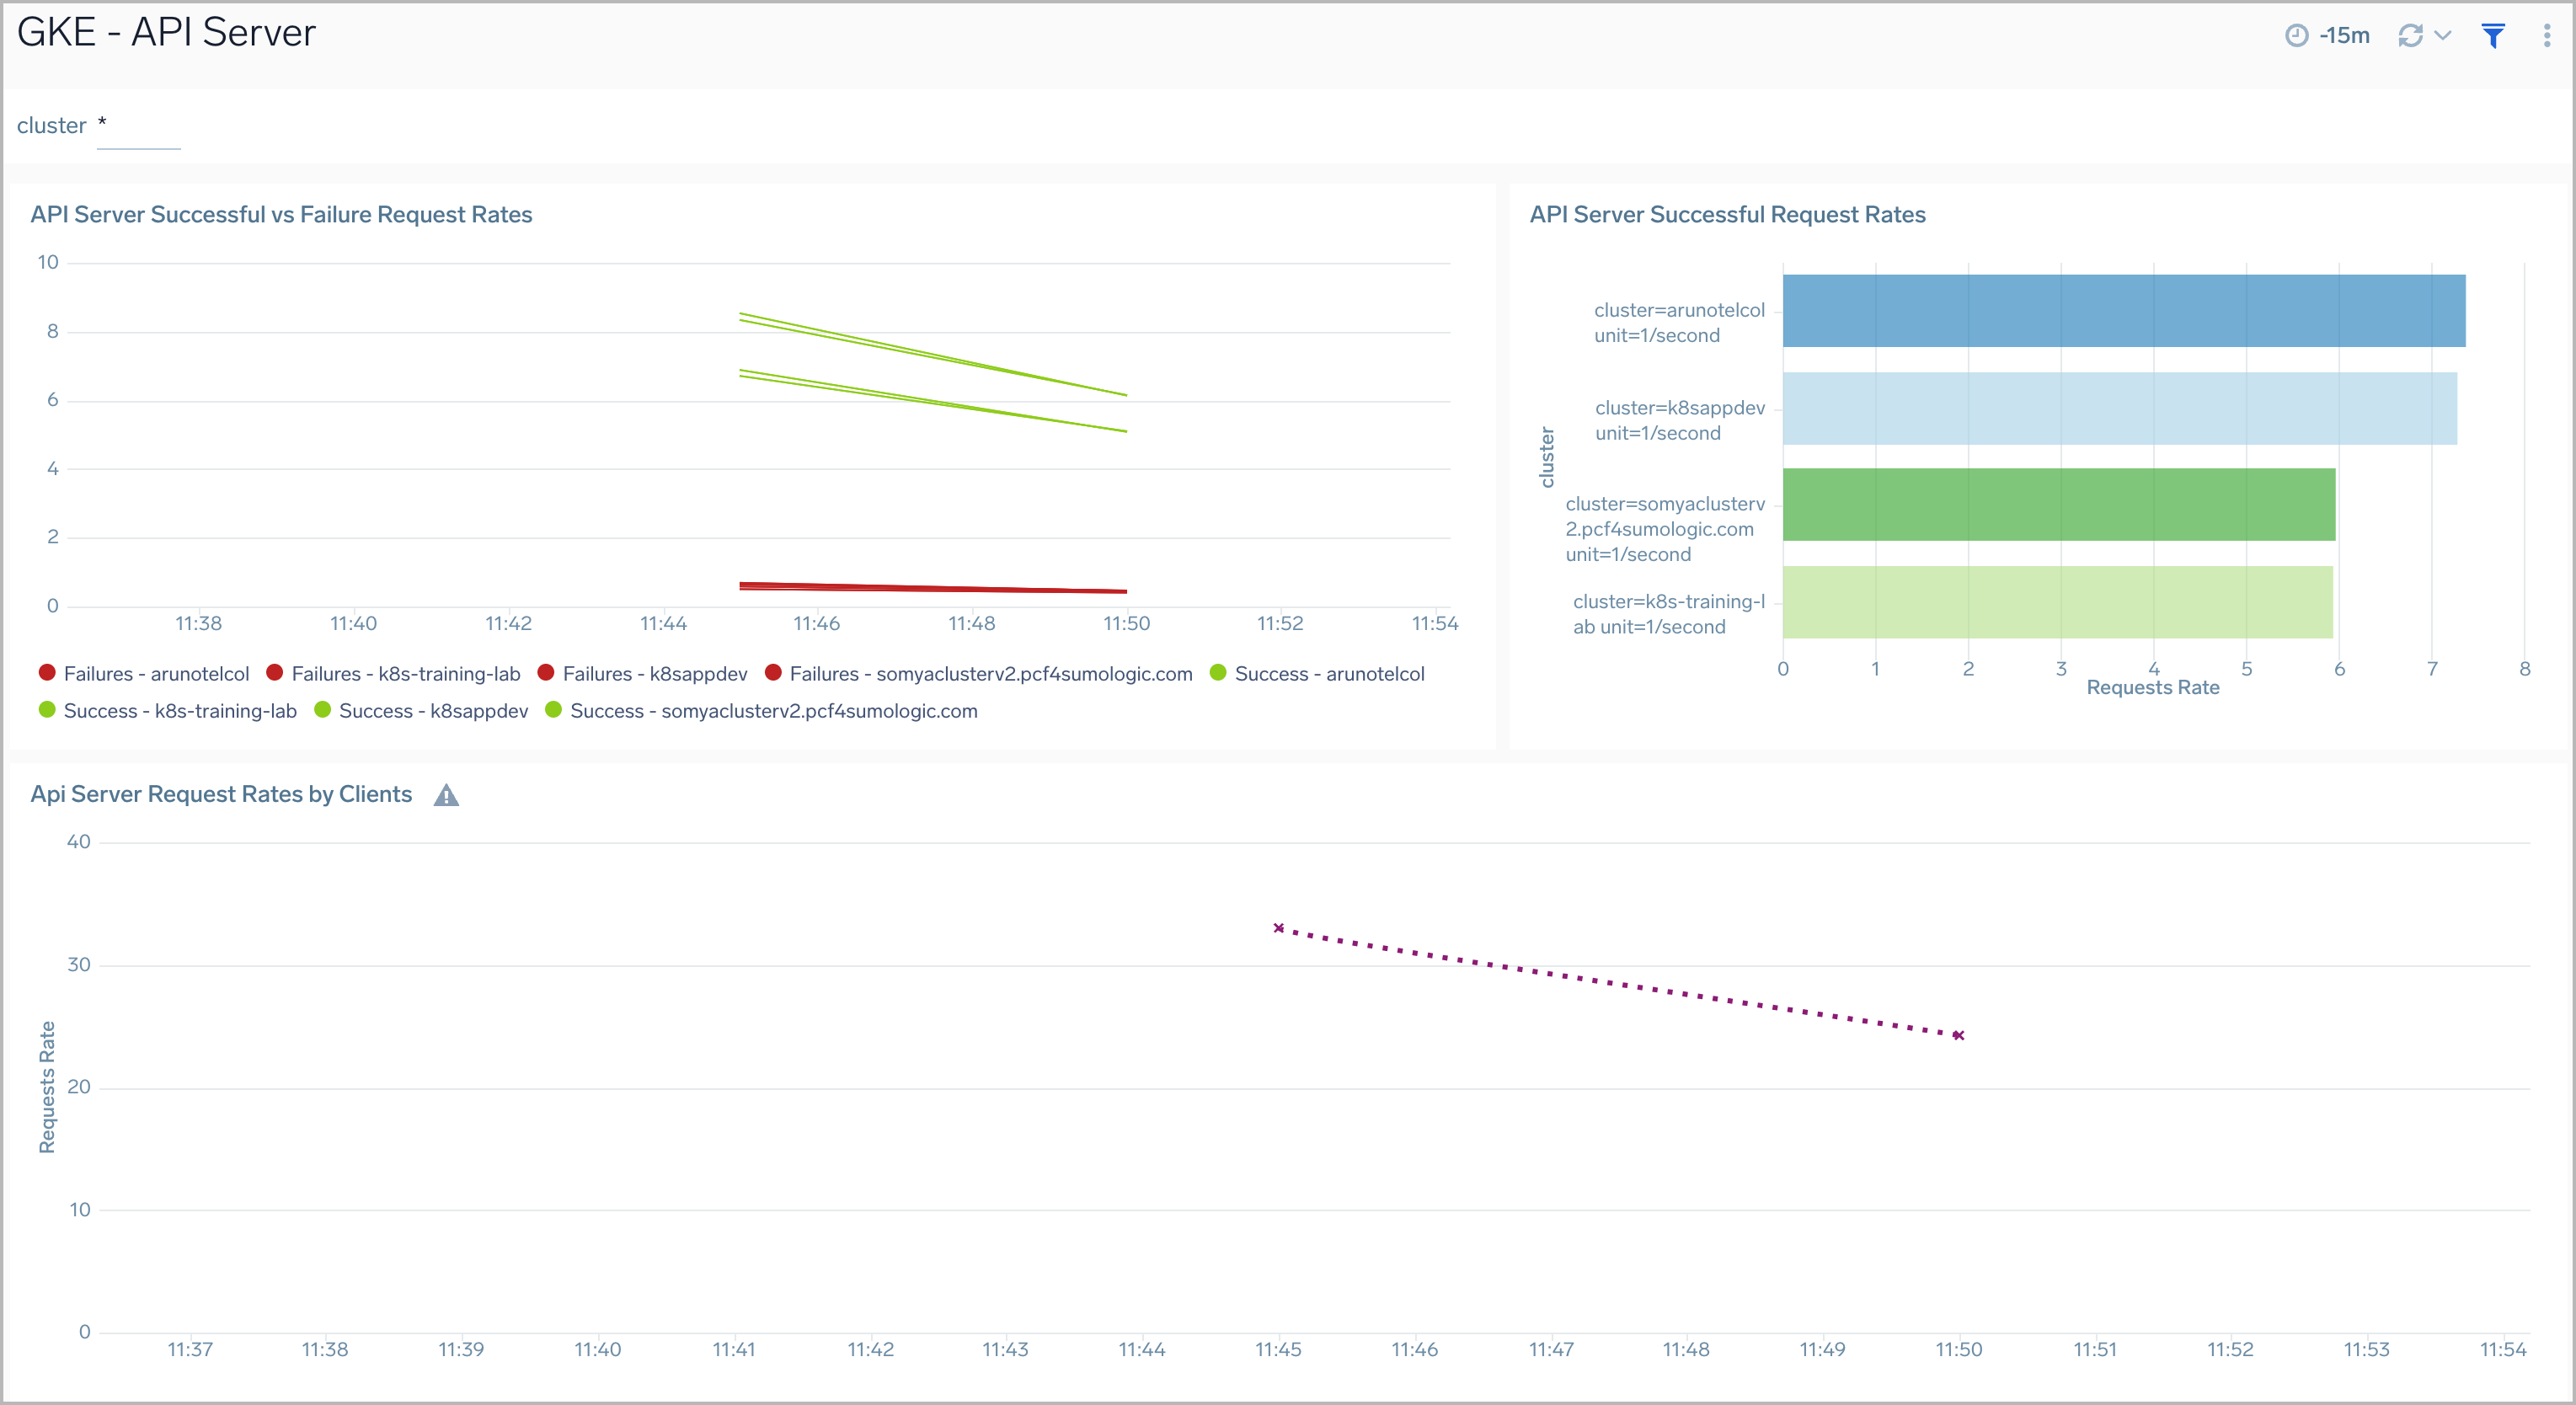
The GKE - API Server dashboard displays information on the API server logs, which is the control plane component that exposes the Kubernetes API. Panels show details on the API server errors, warnings, and activities.
Use this dashboard to:
- Monitor the health and performance of the API server.
- Review server request rates.
- Review server success and failure request rates.
- Review client activity.
Cluster Logs
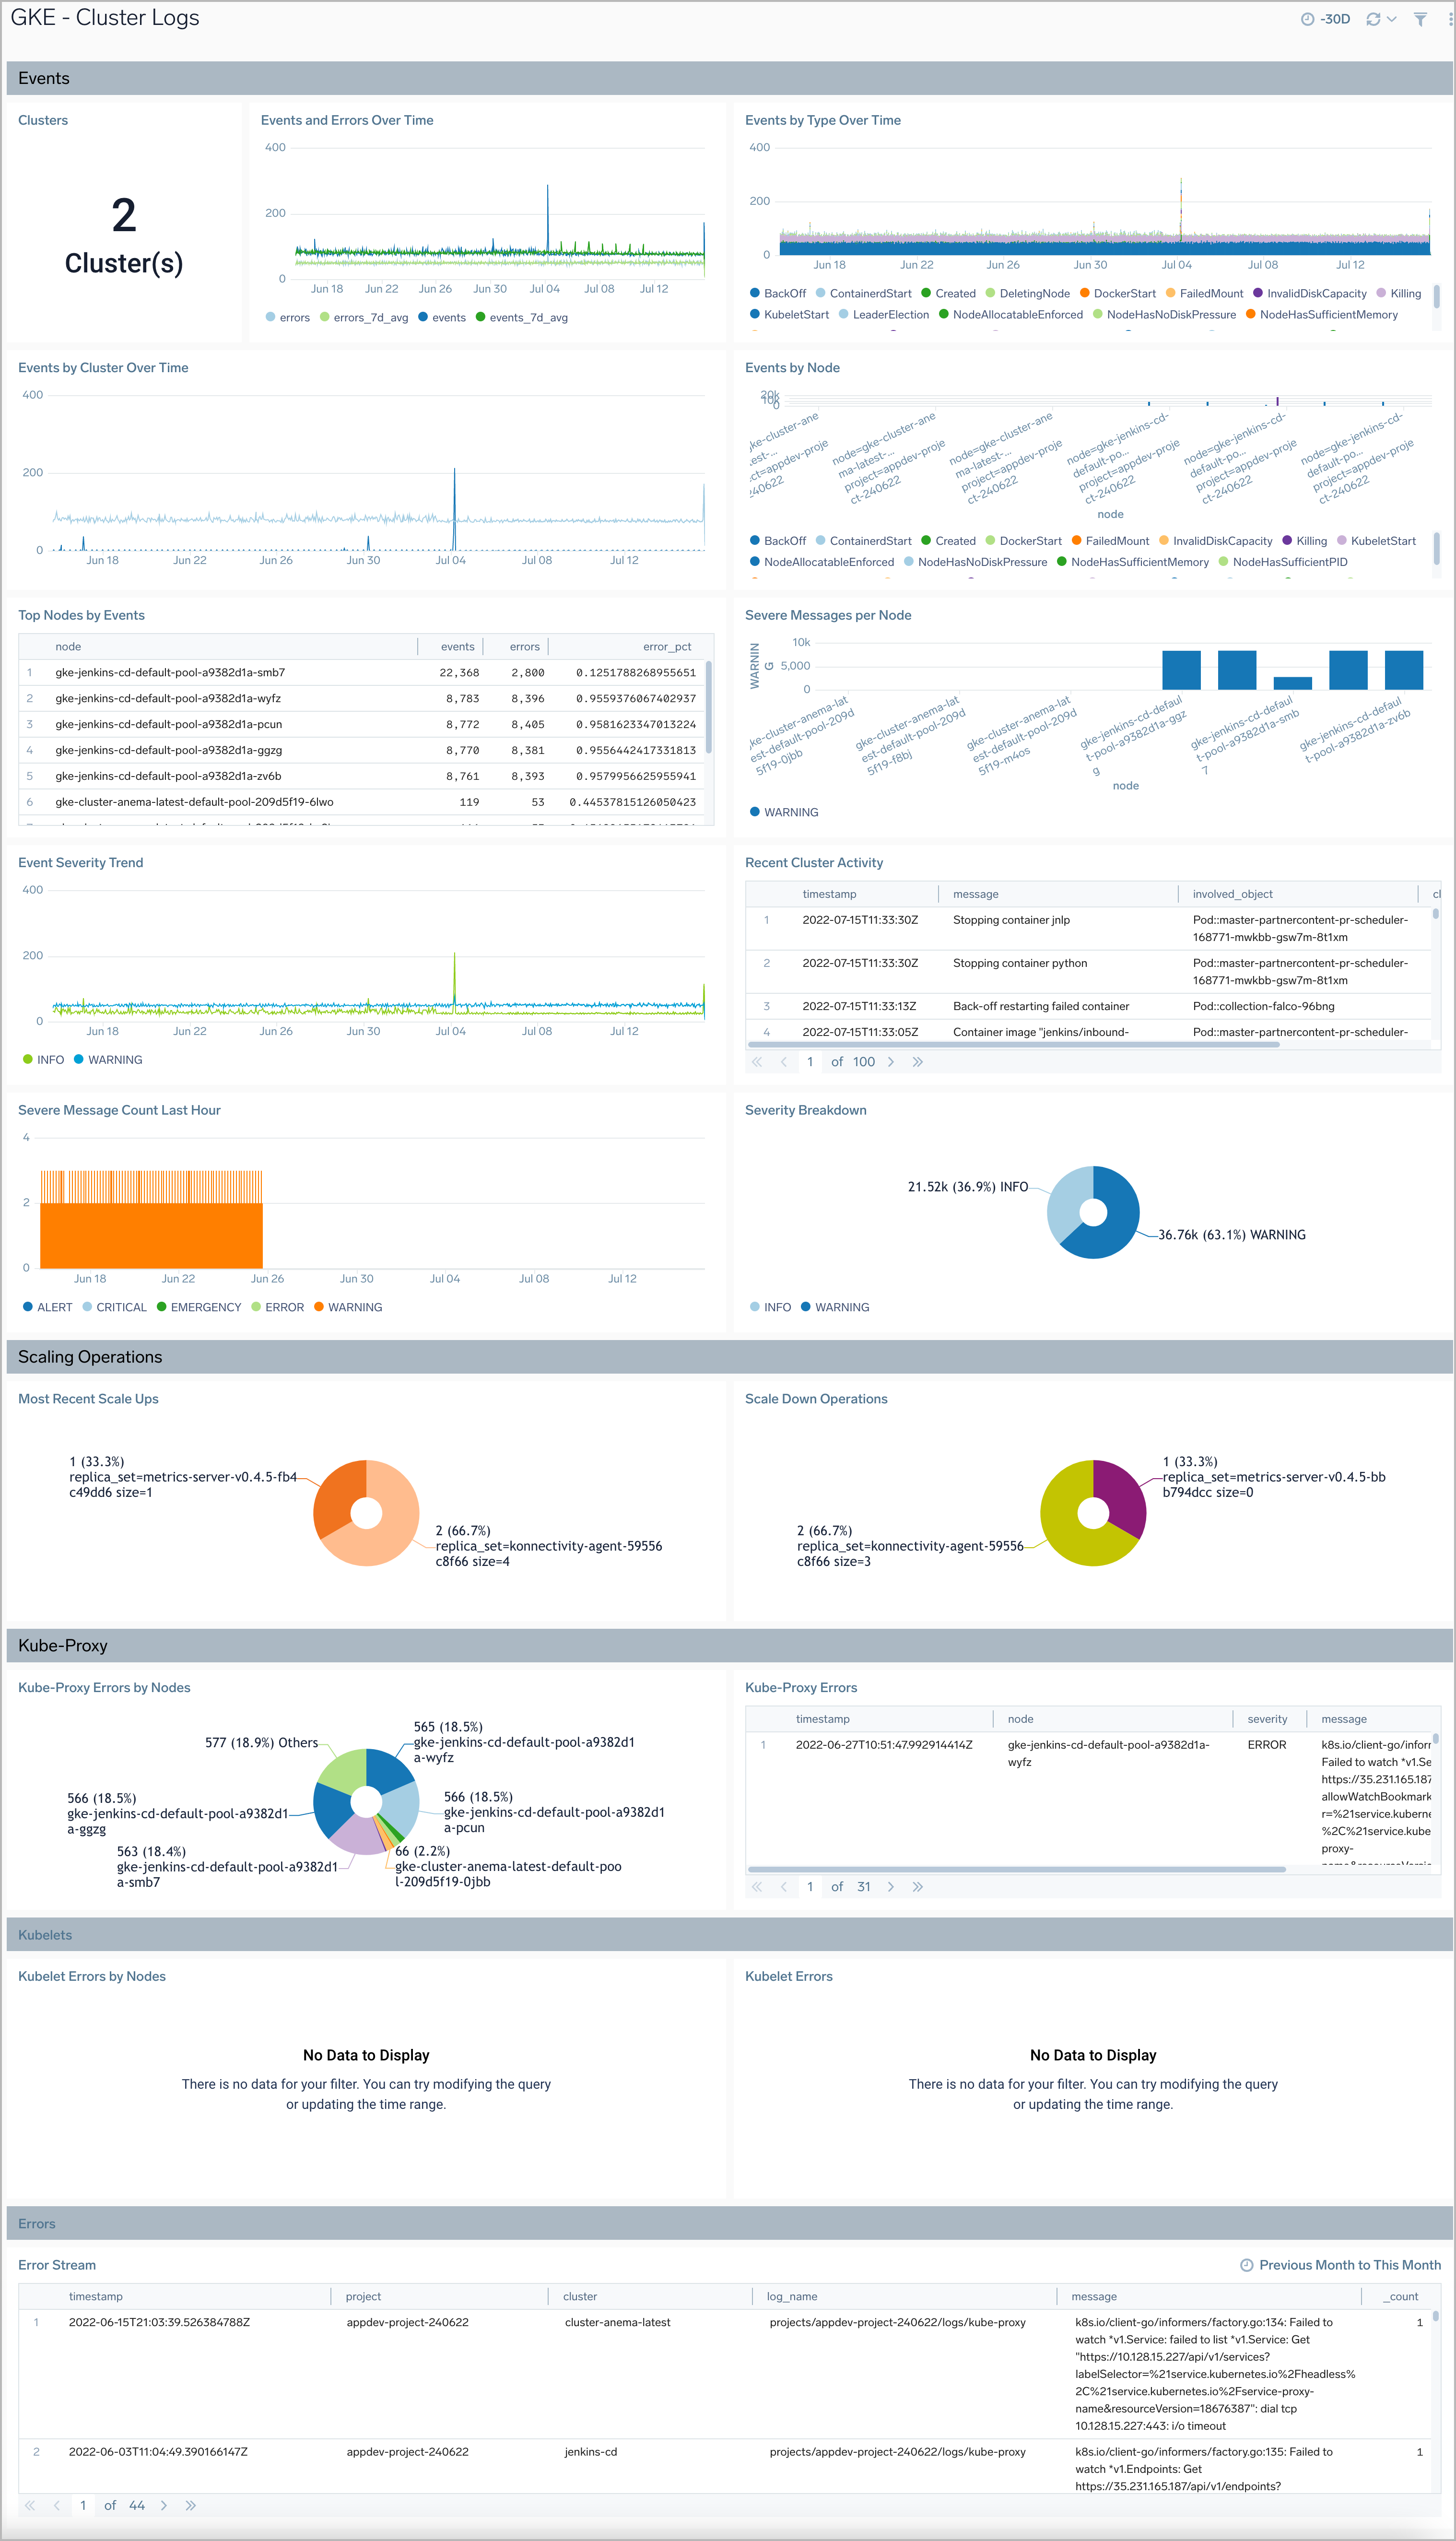
The GKE - Cluster Logs dashboard provides a high-level view of the overall health of the clusters, along with details on all the components and resources.
Use the dashboard to:
- Review Cluster Health.
- Verify Error Messages and Events by Severity.
- Get an overview of Scaling on the cluster.
Node Logs
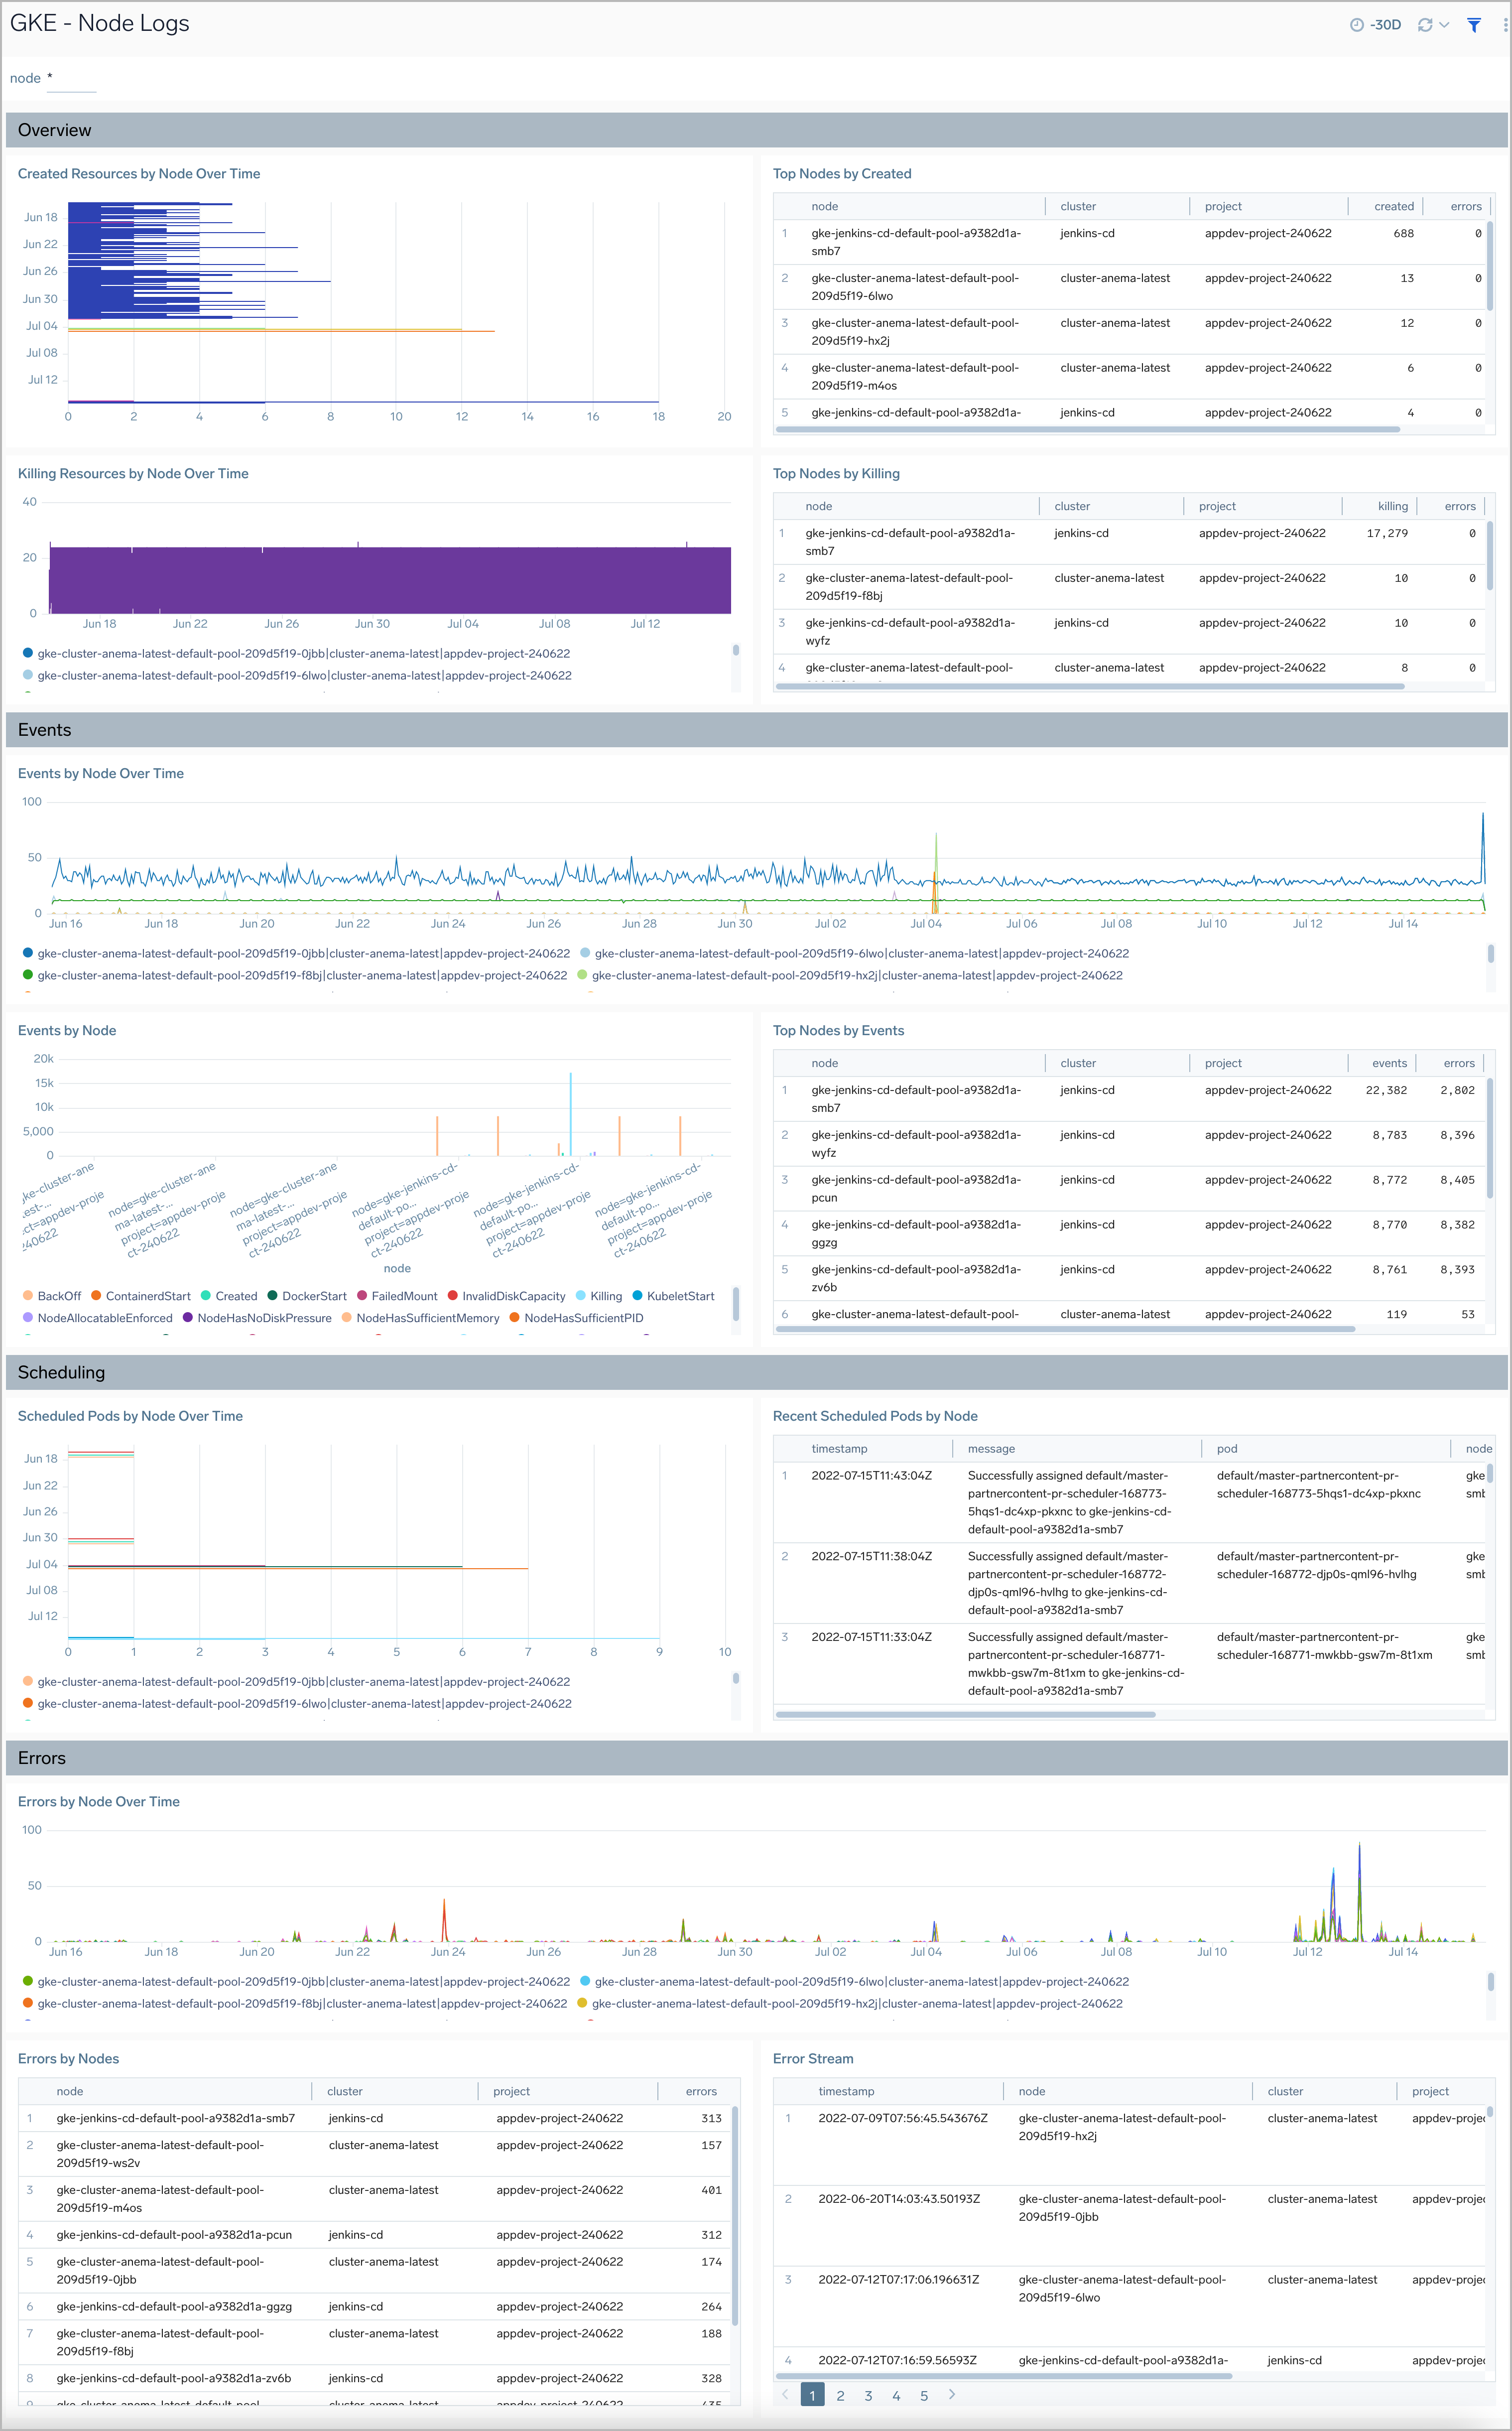
The GKE - Node Logs dashboard displays information on the overall health of the nodes, along with highlights on errors, warnings, and unusual conditions.
Use the dashboard to:
- Review Node Health.
- Verify Error Messages and Events.
- Resources created/killed on the nodes.
- Review Scheduling details by nodes.
Pod Logs
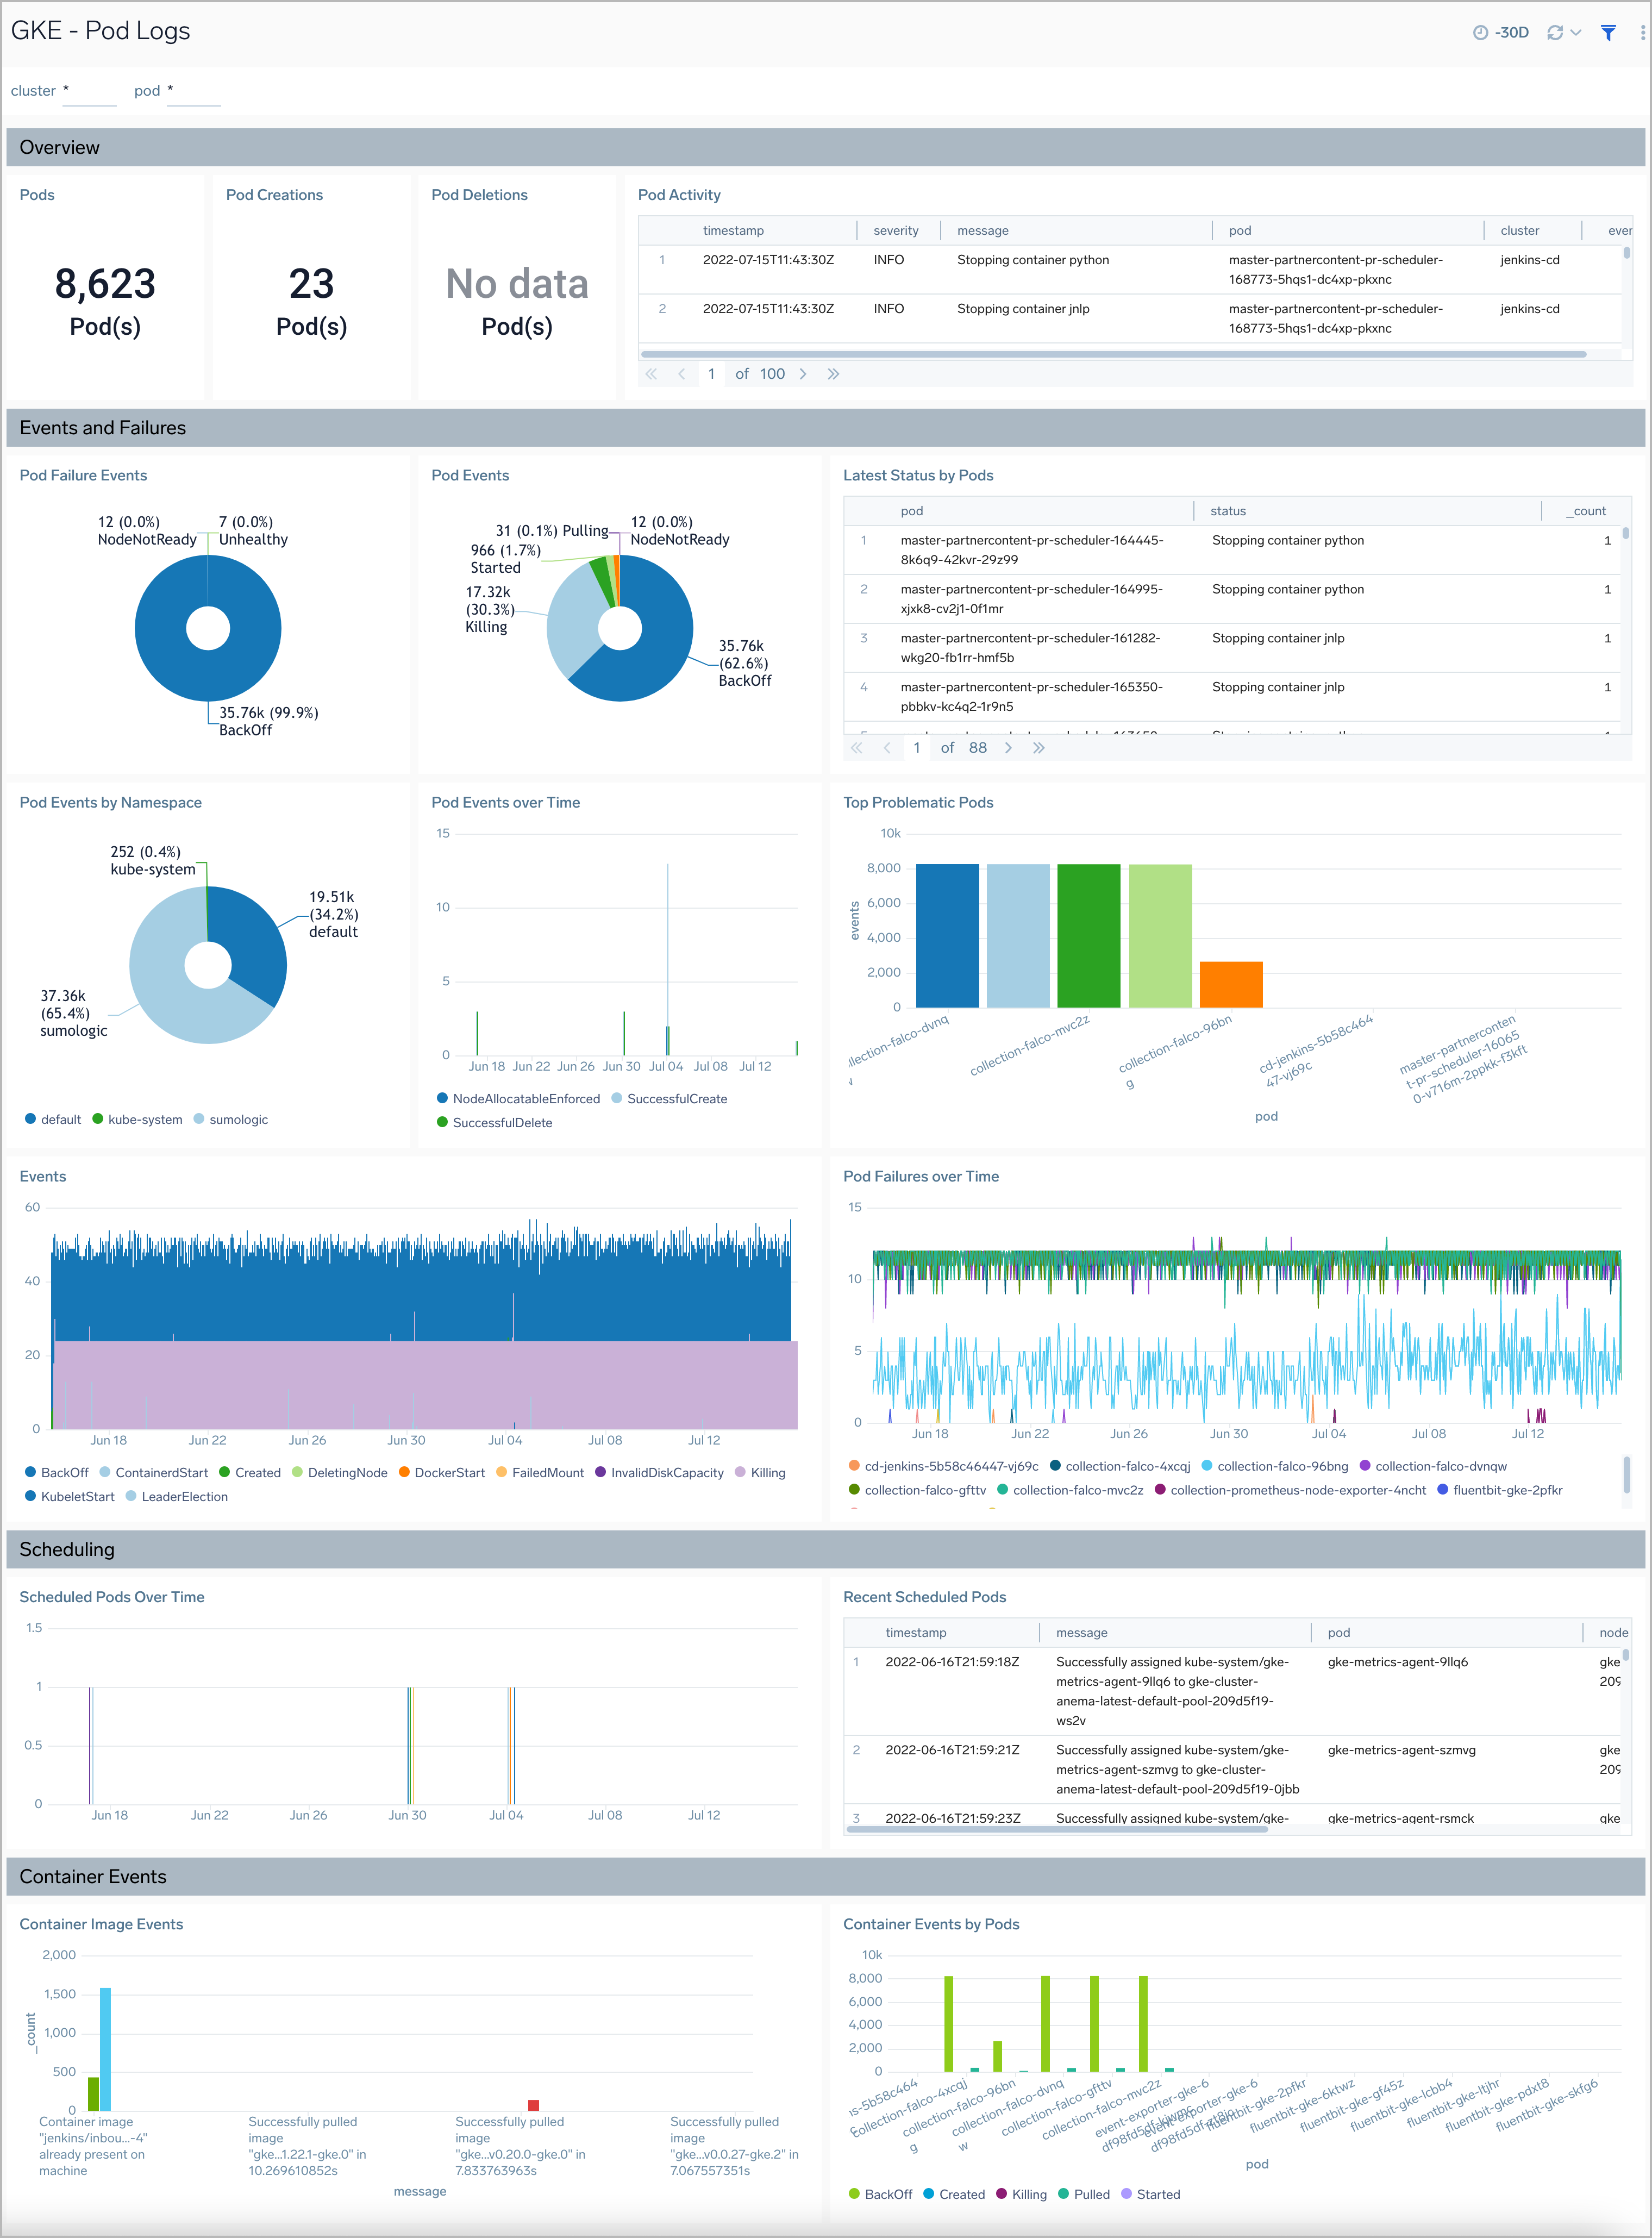
The GKE - Pod Logs dashboard displays information on the overall health of the pods, along with details on the resources being utilized, errors, warnings, and unusual conditions.
Use the dashboard to:
- Review Health of Pods.
- Verify Error Messages and Events.
- Review Pod failures and Pod Activity.
- Review Scheduling details by pods.
- Understand Container Image Events.
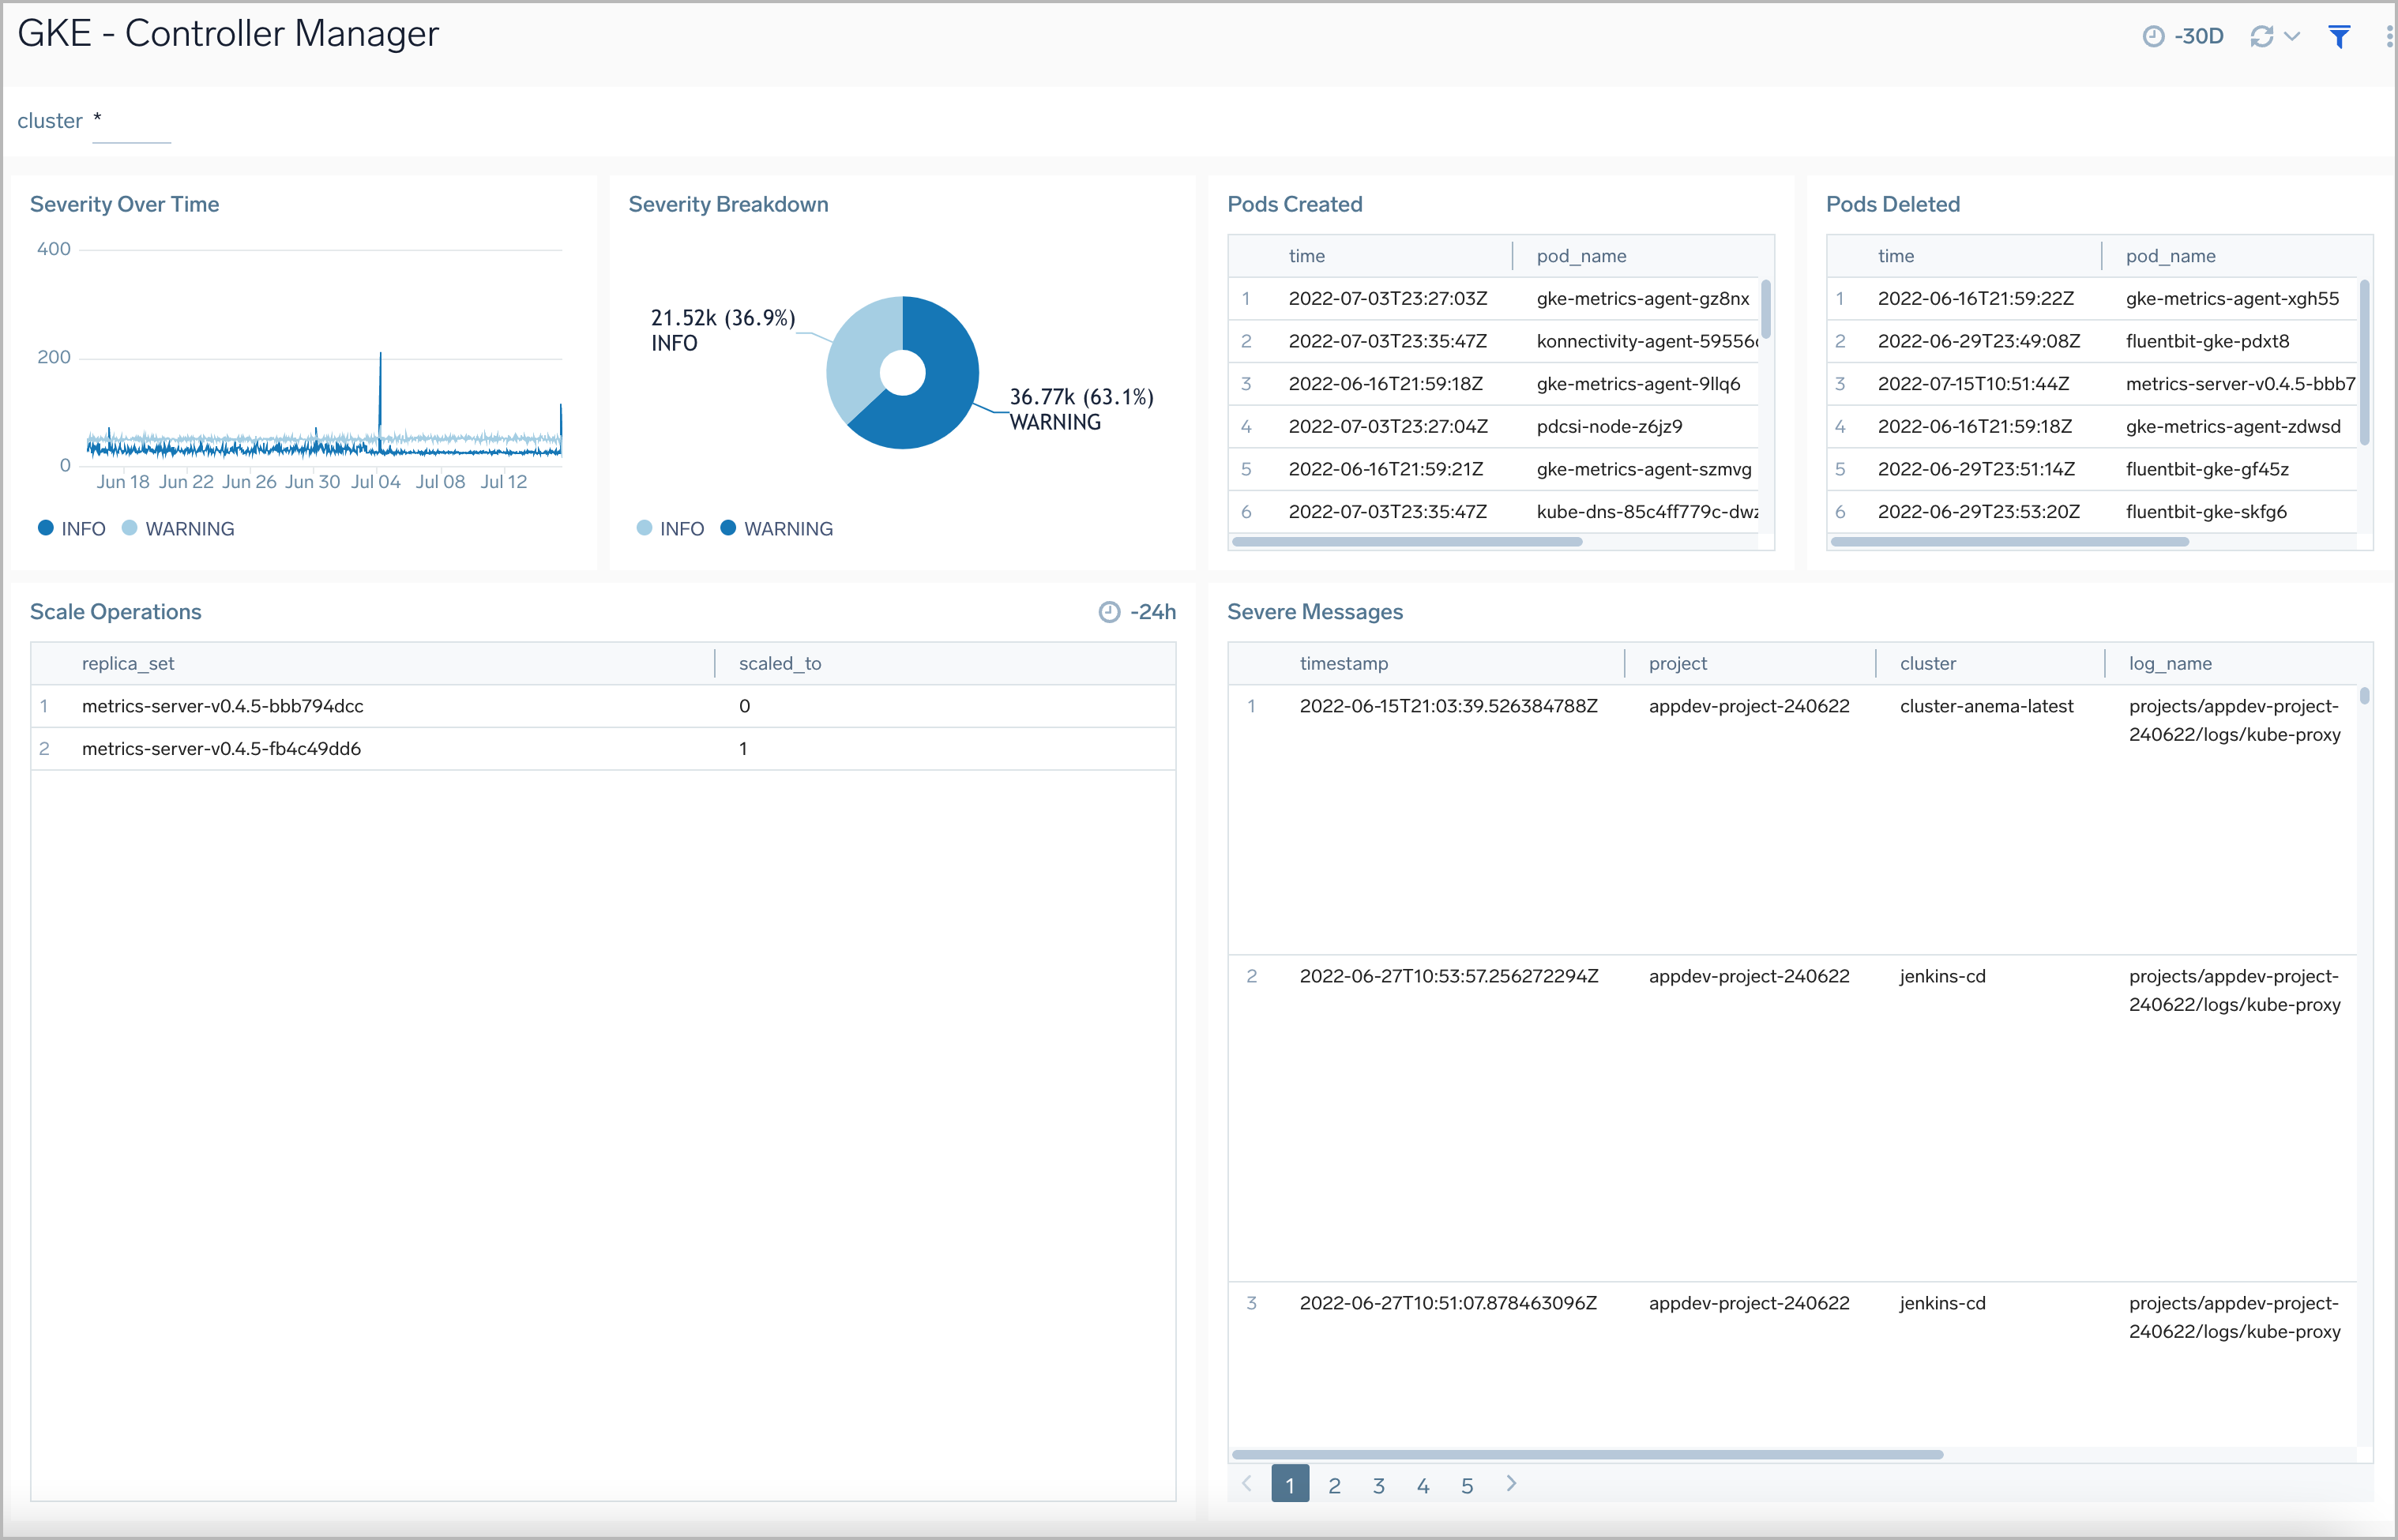
Controller Manager
The GKE - Controller Manager dashboard displays information on the controller manager, providing visibility into the core control loops for Kubernetes.
Use this dashboard to:
- Review resource modifications for pods and jobs.
- Review scaling operations and logs.
- Assess severity trends and error messages.
K8s Audit Logs
The GKE - K8s Audit Logs dashboard provides security-relevant logs documenting the sequence of activities that have affected system by individual users, administrators or other components of the system.
Use this dashboard to:
- Identify what happened on the Kubernetes cluster, when it happened, and who initiated the action.
- Analyze user activities on the cluster.
- Verify component creations, updates, and deletions.