VMware

The VMware app uses unified logs and metrics from the VMware cloud computing virtualization platform to enable monitoring of vCenter, ESXi hosts and individual virtual machines metrics with real-time date displayed in predefined dashboards.
The dashboards provide insight into key events and metrics such as VM CPU, memory, disk utilization, under-provisioned physical hosts, and idle VMs. This enables you to determine capacity constraints and troubleshoot operational issues related to over-provisioning, changes to configuration, and VM movement.
See the vSphere product page for more information on VMware hybrid cloud.
Prerequisites
- Supported Software Versions. The VMware app works with vCenter and vSphere 6.5, 6.7, 7.0, and 8.0.
- Sumo Logic scripts for VMware. The Sumo Logic scripts required to work with the app are located here: sumo-vsphere-ulm.zip.
Log and metric types
The Sumo Logic vCenter logs source and vCenter metrics source use the installed collector to gather the following data from VMWare:
- VMWare Events using the Events API. See Events API for more details.
- VMWare Metrics using the Performance API. For more information, see Performance API.
The dashboards provide real-time monitoring with visual data displays, allowing you to analyze events and performance metrics for efficient detection and troubleshooting.
Sample log messages
2018-11-15 17:39:09.569 +0530 ,,, message=Error detected for sumo-win2k8-a-4 on xx1.sumolabs.com
in Production1-West: Agent cannot send heartbeats.msg size: 612, sendto() returned: Operation not
permitted.,,,eventType=<class 'pyVmomi.VmomiSupport.vim.event.GeneralVmErrorEvent'>,,,
vm=ubuntu16.04-b-4,,,host=8df.sumolabs.com,,,datacenter=Production3-East,,,
computeResource=esx1.sumolabscluster.com,,,key=3553,,,chainId=3269
Sample queries
The following query is from the vSphere Errors Trend panel of the vCenter Errors - Analysis Dashboard.
_sourceCategory = Labs/VMWare6.5 and ("error" or "fail" or "critical")
| parse "message=*,,," as err_msg
| parse "host=*,,," as esx_host
| parse "eventType=*,,," as event_type
| parse "vm=*,,," as vm nodrop
| parse "computeResource=*,,," as cluster
| where esx_host matches {{esx_host}} and cluster matches {{cluster}} and event_type matches {{event_type}}
| timeslice 1h
| count(err_msg) as err_count by _timeslice
| compare with timeshift 1d 7
Collecting logs and metrics for the VMware app
The VMware app collects logs and metrics from your VMware cloud computing virtualization platform, then displays the data in predefined dashboards. The app enables you to monitor vCenter, ESXi hosts and VM metrics and events.
This section provides instructions for collecting logs and metrics for VMware.
Step 1: Set up a server, host, or VM to collect data
You can use the following method for setting up a server to collect data for the VMware app:
If you have an existing VM, go directly to Installing the Sumo Logic scripts on a VM and proceed with following the instructions. Install the Sumo Logic scripts for events and metrics on a vCenter server, or another host with access to vCenter APIs.
Installing Sumo Logic scripts on a vCenter server, another host, or VM
This section walks you through the process of installing Sumo Logic scripts for events and metrics on a vCenter server, or another host with access to vCenter API. Lastly, it provides instructions for configuring the path to run the scripts, whether on a vCenter server, host, or VM.
To install and configure the Sumo Logic scripts, do the following:
- On the server, host, or VM create a directory in which to put the Sumo Logic scripts from Sumo Logic Scripts for VMware. We recommend that you name the directory */var/log/vmware or something similar.
- Download the Sumo Logic VMware scripts from here, into the directory you just created.
- Install python version 3.9, or later.
- Install pyvmomi version based on the compatible vSphere version from here:
pip install pyvmomi==<compatible_version> - Verify that the user account which will run the Sumo Logic VMware scripts has full read/write/execute permissions for the directories where the scripts will be placed. Without adequate permissions (read/write/execute) for the directories in which the scripts files reside, unexpected script errors will occur.
- Edit the cron_vcenter_events.sh script, changing the
SCRIPT_PATHvariable to reflect the absolute path where the script resides. If you have multiple vCenter servers, create a new line for each one.
Step 2: Set up Sumo Logic Installed Collector
Our Installed Collector is a Java agent that receives logs and metrics from its Sources and then encrypts, compresses, and sends the data to the Sumo service. The Collector runs as a service and starts automatically after installing or rebooting.
See Installed Collectors for installation instructions.
Step 3: Collect logs and metrics for the VMware app
This section explains how to set up a vCenter server, host, or VM to collect logs and metric for the Sumo Logic app for VMware.
Collecting event messages
An event is an action that triggers an event message on a vCenter Server. Event messages are not logged, but are instead stored in the vCenter Server database. The Sumo Logic Collector for VMware retrieves these messages using the vSphere python SDK.
Step 1: Configure logs to be collected
Test running a python script from the directory containing the Sumo Logic scripts.
-
To test the events.py script that queries the vCenter Server for events and sends the events to Sumo Logic, go to the directory for the Sumo Logic scripts and run the events.py script with one of the following commands.
View examples here for the different source types (click to expand)
Sample username format is username@vsphere.local or domain/username.
python3 events.py -s [vcenterserver] \
-u [username] -p [password] -f output.txt
Example 1: Using a file output, use a local or remote file source in this case.
python3 $SCRIPT_PATH/events.py -s 192.168.124.29 -t sumologic_host -to sumologic_host_port -u sumoadmin -p sumoadmin -f /var/log/vmware/output/vsphere_eventsExample 2: Using syslog and specific log directory with a specific log file prefix. Use a syslog source to ingest the logs.
python3 $SCRIPT_PATH/events.py -s 192.168.124.29 -t sumologic_host -to sumologic_host_port -u sumoadmin -p sumoadmin -l /var/log/vmware/log/vsphere_eventsExample 3: Using syslog and specific log directory with a specific log file prefix and encrypted Password. Use a syslog source to ingest the logs.
python3 $SCRIPT_PATH/events.py -s 192.168.124.29 -t sumologic_host -to sumologic_host_port -u sumoadmin -pK 'xgb8NJ3ZYPJbzX6vWHySZbLd73bKWPsGMKoSnry7hL4=' -p 'gAAAAABb6asvlRfxEj_ZQTKOyrqnGNMbfo_kpxrqv4DCO6TorS4FmKFzrepe0_xtiMT67ZT6OOf5bfrVZXNnUDFNlwPWrpFSfg==' -pE True -l /var/log/vmware/log/vsphere_eventsBy default, the script starts collecting data for the past 24 hours. To retrieve data for a smaller time range, for testing purposes set the parameter
-bTto the time from when to start data collection, for example, one hour earlier:python3 events.py -s <vcenter server> -t <syslog host> -to <syslog host port> -bT <time>For example:
python3 events.py -s 192.168.23.242 -t vcenterhost -to 1514 -bT '2012-10-08 00:17:00.000+0000'The script supports the following parameters:
-s. Remote vCenter Server to connect to. Required Parameter.-o. Remote vCenter Server port to use, default 443. Optional.-u. User name to use when connecting to vCenter server. Required.-p. Password to use when connecting to vCenter server. Required.-f. Output File Prefix. Target syslog server or file is required. Optional.-ts. Timestamp File. Default ‘.timelog_events’. Optional.-t. Host name of Sumo Logic installed collector. This is required in case of syslog server. If you are using local file source, this parameter is not required.-to. Target Sumologic port to use, default 514. Optional.-bT. Begin Time to query for the events. Default Current Time.-eT. End Time to query for the events. Default Current Time minus 24 hours.-sC. SSL cert for connection. Optional.-l. Log File Prefix. Default:vsphere_events_. By default, the log file is created in the execution directory. Full log path and prefix can also be specified for example:-l C:\Users\user6\vsphere_events, wherevsphere_eventsis the log prefix. The log file is created with prefix + current timestamp.-pE. Is the password encrypted? Default False. Optional.-pK. Encryption Key for Password. Required if -pE is True.
-
Once you are satisfied with the output, modify the cron_vcenter_events.sh with the required parameters and create a cron job to periodically run the cron_vcenter_events.sh script at the desired time interval.
- If utilizing a syslog source, provide the target and target port parameters where the Sumo Collector is installed. If utilizing a local or remote source, use the file parameter to generate the file and configure the File Path for local file source or Path Expression for Remote file source.
- The cron job needs to run as root, or as a user who has read and write access to the script directories.
- For more detailed information, see the shell script for configuration options.
Step 2: Configure a syslog or a file source
A Sumo Logic Syslog Source operates like a Syslog server listening on the designated port to receive Syslog messages. The script supports syslog server, as well as generating a text file that can be ingested using Local or Remote file source. A local file source is recommended as it has several benefits over Syslog, including no need to worry about connection retry, reading from the last pointer in a file, no data loss in the case of collector failure, and so on. Based on your preference, you can configure a syslog source, or a local or remote file source.
For a file source, configure a local or remote file source in one of the following ways:
- If the script and the Sumo Logic collector are on the same server: configure a local file source by following these steps. Configure the File Path for local file source. Set Path Expression equivalent to the output directory mentioned in previous section using
-fflag (for example:/var/log/vmware/output/). - If the script and the Sumo Logic collector are on different servers: configure a remote file source by following these steps. Configure the Path Expression for Remote file source. Set Path Expression equivalent to the output directory mentioned in previous section using
-fflag (for example:/var/log/vmware/output/). - For a syslog source, configure the syslog source as follows:
- Go to Manage Data > Collection > Collection and click Add Source.
- Select Syslog for the Source type.
- Enter a Name to display for this Source. Source name metadata is stored in a searchable field called
_sourceName. - For Protocol choose TCP.
- Enter the correct Port number (for your Collector) for the Source to listen to, such as 1514.
- For Source Category, we recommend using vcenter_events.
- Under Advanced, set the following options:
- Select Extract timestamp information from log file entries.
- Select Ignore time zone from log file and instead use and then choose UTC from the menu (as shown below).
- Click Save.
Collecting performance metrics
Collecting performance metrics involves using scripts to call the vCenter performance API’s to extract performance statistics.
Performance data collection for ESXi servers associated with a vCenter server works by getting data from each ESXi server in parallel, using multiple threads. The number of threads depends on the amount of data you are collecting and the frequency of the collection.
The number of threads can be controlled using a property THREADSIZE_POOL in the sumo.json config file. You can also control the number of objects processed by a single thread using the property BATCH_MORLIST_SIZE. The following is a description of all the configuration properties.
BATCH_MORLIST_SIZE: Default 50, Simultaneous objects processed by a single thread for retrieving the performance data.
THREADSIZE_POOL: Default 5, Number of threads
SSL_VERIFY: Default False, if using SSL, set as True
SSL_CAPATH: Certificate absolute path if SSL_VERIFY is True
To collect performance metrics, do the following:
- Follow the instructions to configure a Streaming Metrics Source. While configuring set the Protocol to TCP and ContentType to Carbon2.
- Edit the properties in the bundled sumo.json properties file, as necessary.
- Go to the directory for the Sumo Logic scripts and run the esx_perf_metrics_6_5.py script, which queries the vCenter Server for metrics from that location (this script queries the vCenter Server for events) with the following command:
python3 esx_perf_metrics_6_5.py -u [username] \
-p [password] -s [vcenter server] \
-t [target server] -to [target port] \
-cf [config filename]
View examples (click to expand)
Example 1: Using metrics streaming source and specific log directory with a specific log file prefix.
python3 $SCRIPT_PATH/esx_perf_metrics_6_5.py -s 192.168.124.29 -t sumologic_host -to sumologic_host_port -u sumoadmin -p sumoadmin -cf $SCRIPT_PATH/sumo.json -l /var/log/vmware/log/metrics
Example 2: Using specific log directory with a specific log file prefix and encrypted Password.
python3 $SCRIPT_PATH/esx_perf_metrics.py -s 192.168.124.29 -t sumologic_host -to sumologic_host_port -u sumoadmin -cf $SCRIPT_PATH/sumo.json -l /var/log/vmware/log/vsphere_metrics -pK 'xgb8NJ3ZYPJbzX6vWHySZbLd73bKWPsGMKoSnry7hL4=' -p 'gAAAAABb6asvlRfxEj_ZQTKOyrqnGNMbfo_kpxrqv4DCO6TorS4FmKFzrepe0_xtiMT67ZT6OOf5bfrVZXNnUDFNlwPWrpFSfg==' -pE True
The script supports the following parameters:
-s. Remote vCenter Server to connect to. Required Parameter.-o. Remote vCenter Server port to use, default 443. Optional.-u. User name to use when connecting to vCenter server. Required.-p. Password to use when connecting to vCenter server. Required.-ts. Timestamp File. Default ‘.timelog_metrics’.-t. Host name where Sumo Logic installed collector is installed. Required.-to. Target Sumologic port to use, default 514. Optional.-cf. Configuration File. Required.-l. Log File Prefix. Default:vsphere_metrics_. By Default the log file is created in the execution directory. Full log path and log prefix can also be specified for example:-l C:\Users\user6\vsphere_metrics, wherevsphere_metricsis the log prefix and is required. The log file is created with prefix + current timestamp.-pE. Is the password encrypted? Default: False. Optional.-pK. Encryption Key for Password. Required if-pEis True.
-
In Sumo Logic, verify that metrics are being captured.
-
When you are satisfied with the batch and thread configurations, modify the cron_vcenter_metrics.sh with the required parameters and create a cron job to periodically run the cron_vcenter_metrics.sh script at the desired time interval.
- The cron job needs to be run as root, or as a user who has read and write access to the script directories.
- For more detailed information, see the shell script for configuration options.
Sample CRON job to periodically run the cron_vcenter_metrics.sh script every 15 minutes (use the
sudo crontab -eoption), and add the following line:*/15 * * * * /var/log/vmware/cron_vcenter_metrics.sh
Collecting historical events
By default, the first time events.py is called, events from the past 24 hours are collected. Each time the script is called, it writes the timestamp of the last read event in a file named .timelog_events for the next call to pick up.
To collect events older than the past 24 hours, before setting up the CRON job for cron_vcenter_events.sh, run the script as follows:
python3 events.py -s <vcenter server> \
-t <syslog host> -to <syslog host port> -bT <time>
The syslog server should reflect the IP address or hostname of the machine where the Sumo Logic collector is installed; the syslog_port should reflect the port number that you previously set up for the Source responsible for collecting vCenter Server Events. For example, to collect all events starting from 5:00 pm on October 8, 2023, you would run the following command:
python3 events.py  -s 192.168.23.242 \
-t vcenterhost -to 1514 -bT '2023-10-08 00:17:00.000+0000'
Once this command completes successfully, you can pick up ongoing events by setting up the cron job.
Step 4: Encrypt passwords
The scripts support symmetric authenticated cryptography—also known as secret key authentication—using the python Fernet implementation.
To utilize encryption, generate a key from the python command line:
>>> from cryptography.fernet import Fernet
>>> print(Fernet.generate_key())
b'xgb8NJ3ZYPJbzX6vWHySZbLd73bKWPsGMKoSnry7hL4='
Encrypt the password from your python command line:
>>> from cryptography.fernet import Fernet
>>> key = b'xgb8NJ3ZYPJbzX6vWHySZbLd73bKWPsGMKoSnry7hL4='
>>> s = Fernet(key)
>>> text = s.encrypt(b"secretpassword")
>>> print(text)
b'gAAAAABb6asvlRfxEj_ZQTKOyrqnGNMbfo_kpxrqv4DCO6TorS4FmKFzrepe0_xtiMT67ZT6OOf5bfrVZXNnUDFNlwPWrpFSfg=='
Modify the scripts to include the encrypted password and the key:
python3 esx_perf_metrics_6_5.py -u [username] \
-pK 'xgb8NJ3ZYPJbzX6vWHySZbLd73bKWPsGMKoSnry7hL4=' \
-p 'gAAAAABb6asvlRfxEj_ZQTKOyrqnGNMbfo_kpxrqv4DCO6TorS4FmKFzrepe0_xtiMT67ZT6OOf5bfrVZXNnUDFNlwPWrpFSfg==' \
-s 192.168.20.121 -t 127.0.0.1 \
-to 2003 -cf sumo.json -pE True
python3 events.py -s 192.168.20.121 -u [username] -f outfile \
-pK 'xgb8NJ3ZYPJbzX6vWHySZbLd73bKWPsGMKoSnry7hL4=' \
-p 'gAAAAABb6asvlRfxEj_ZQTKOyrqnGNMbfo_kpxrqv4DCO6TorS4FmKFzrepe0_xtiMT67ZT6OOf5bfrVZXNnUDFNlwPWrpFSfg==' \
-pE True
The -pE flag is used to specify whether the password is encrypted or not. Default is false.
Troubleshooting
- The scripts need read and write access to the directory to generate logs and maintain timestamps.
- Python must be installed, as the scripts use python.
- Scripts generate logs which can be reviewed if problems arise.
- The logs are generated for each run under the configured working directory.
- The scripts must connect to a vCenter server and not an ESXi server, as many of the APIs are not supported on ESXi servers.
- If the collector is not running but the script is, the metrics and events will be lost. In such a case, once the collector is running again, update the timestamp in the files .timelog_events and .timelog_metrics to the required start time. This will allow you to retrieve the old data. After the script retrieves the old data, it continues with normal processing.
- vSphere pyvmomi sdk throws Parse Exception for some events.
- If you face any issues like these, remove the corresponding event from the events list in the file vmware_constants.py.
- If an event is missing from the event list, it can be added as well.
- If the issues are fixed in the sdk, the below list can be blanked as
event_type_list = []to retrieve all the events. - If you encounter the following error:
pyVmomi.VmomiSupport.UnknownWsdlTypeError: 'ContentLibrary', remove TaskEvent and EventEx from the vmware_constants.py and try again.
Installing the VMware app
To install the app, do the following:
- Select App Catalog.
- In the 🔎 Search Apps field, run a search for your desired app, then select it.
- Click Install App.
note
Sometimes this button says Add Integration.
- Click Next in the Setup Data section.
- In the Configure section of your respective app, complete the following fields.
- Key. Select either of these options for the data source.
- Choose Source Category and select a source category from the list for Default Value.
- Choose Custom, and enter a custom metadata field. Insert its value in Default Value.
- Key. Select either of these options for the data source.
- Click Next. You will be redirected to the Preview & Done section.
Post-installation
Once your app is installed, it will appear in your Installed Apps folder, and dashboard panels will start to fill automatically.
Each panel slowly fills with data matching the time range query and received since the panel was created. Results will not immediately be available, but will update with full graphs and charts over time.
Upgrading the VMware app (Optional)
To update the app, do the following:
- Select App Catalog.
- In the Search Apps field, search for and then select your app.
Optionally, you can identify apps that can be upgraded in the Upgrade available section. - To upgrade the app, click Upgrade.
- If the upgrade does not have any configuration or property changes, you will be redirected to the Preview & Done section.
- If the upgrade has any configuration or property changes, you will be redirected to Setup Data page.
- In the Configure section of your respective app, complete the following fields.
- Key. Select either of these options for the data source.
- Choose Source Category and select a source category from the list for Default Value.
- Choose Custom and enter a custom metadata field. Insert its value in Default Value.
- Key. Select either of these options for the data source.
- Click Next. You will be redirected to the Preview & Done section.
- In the Configure section of your respective app, complete the following fields.
Post-update
Your upgraded app will be installed in the Installed Apps folder, and dashboard panels will start to fill automatically.
See our Release Notes changelog for new updates in the app.
Uninstalling the VMware app (Optional)
To uninstall the app, do the following:
- Select App Catalog.
- In the 🔎 Search Apps field, run a search for your desired app, then select it.
- Click Uninstall.
Viewing VMware dashboards
All dashboards have a set of filters that you can apply to the entire dashboard. Use these filters to drill down and examine the data to a granular level.
- You can change the time range for a dashboard or panel by selecting a predefined interval from a drop-down list, choosing a recently used time range, or specifying custom dates and times. Learn more.
- You can use template variables to drill down and examine the data on a granular level. For more information, see Filter with template variables.
- Most Next-Gen apps allow you to provide the scope at the installation time and are comprised of a key (
_sourceCategoryby default) and a default value for this key. Based on your input, the app dashboards will be parameterized with a dashboard variable, allowing you to change the dataset queried by all panels. This eliminates the need to create multiple copies of the same dashboard with different queries.
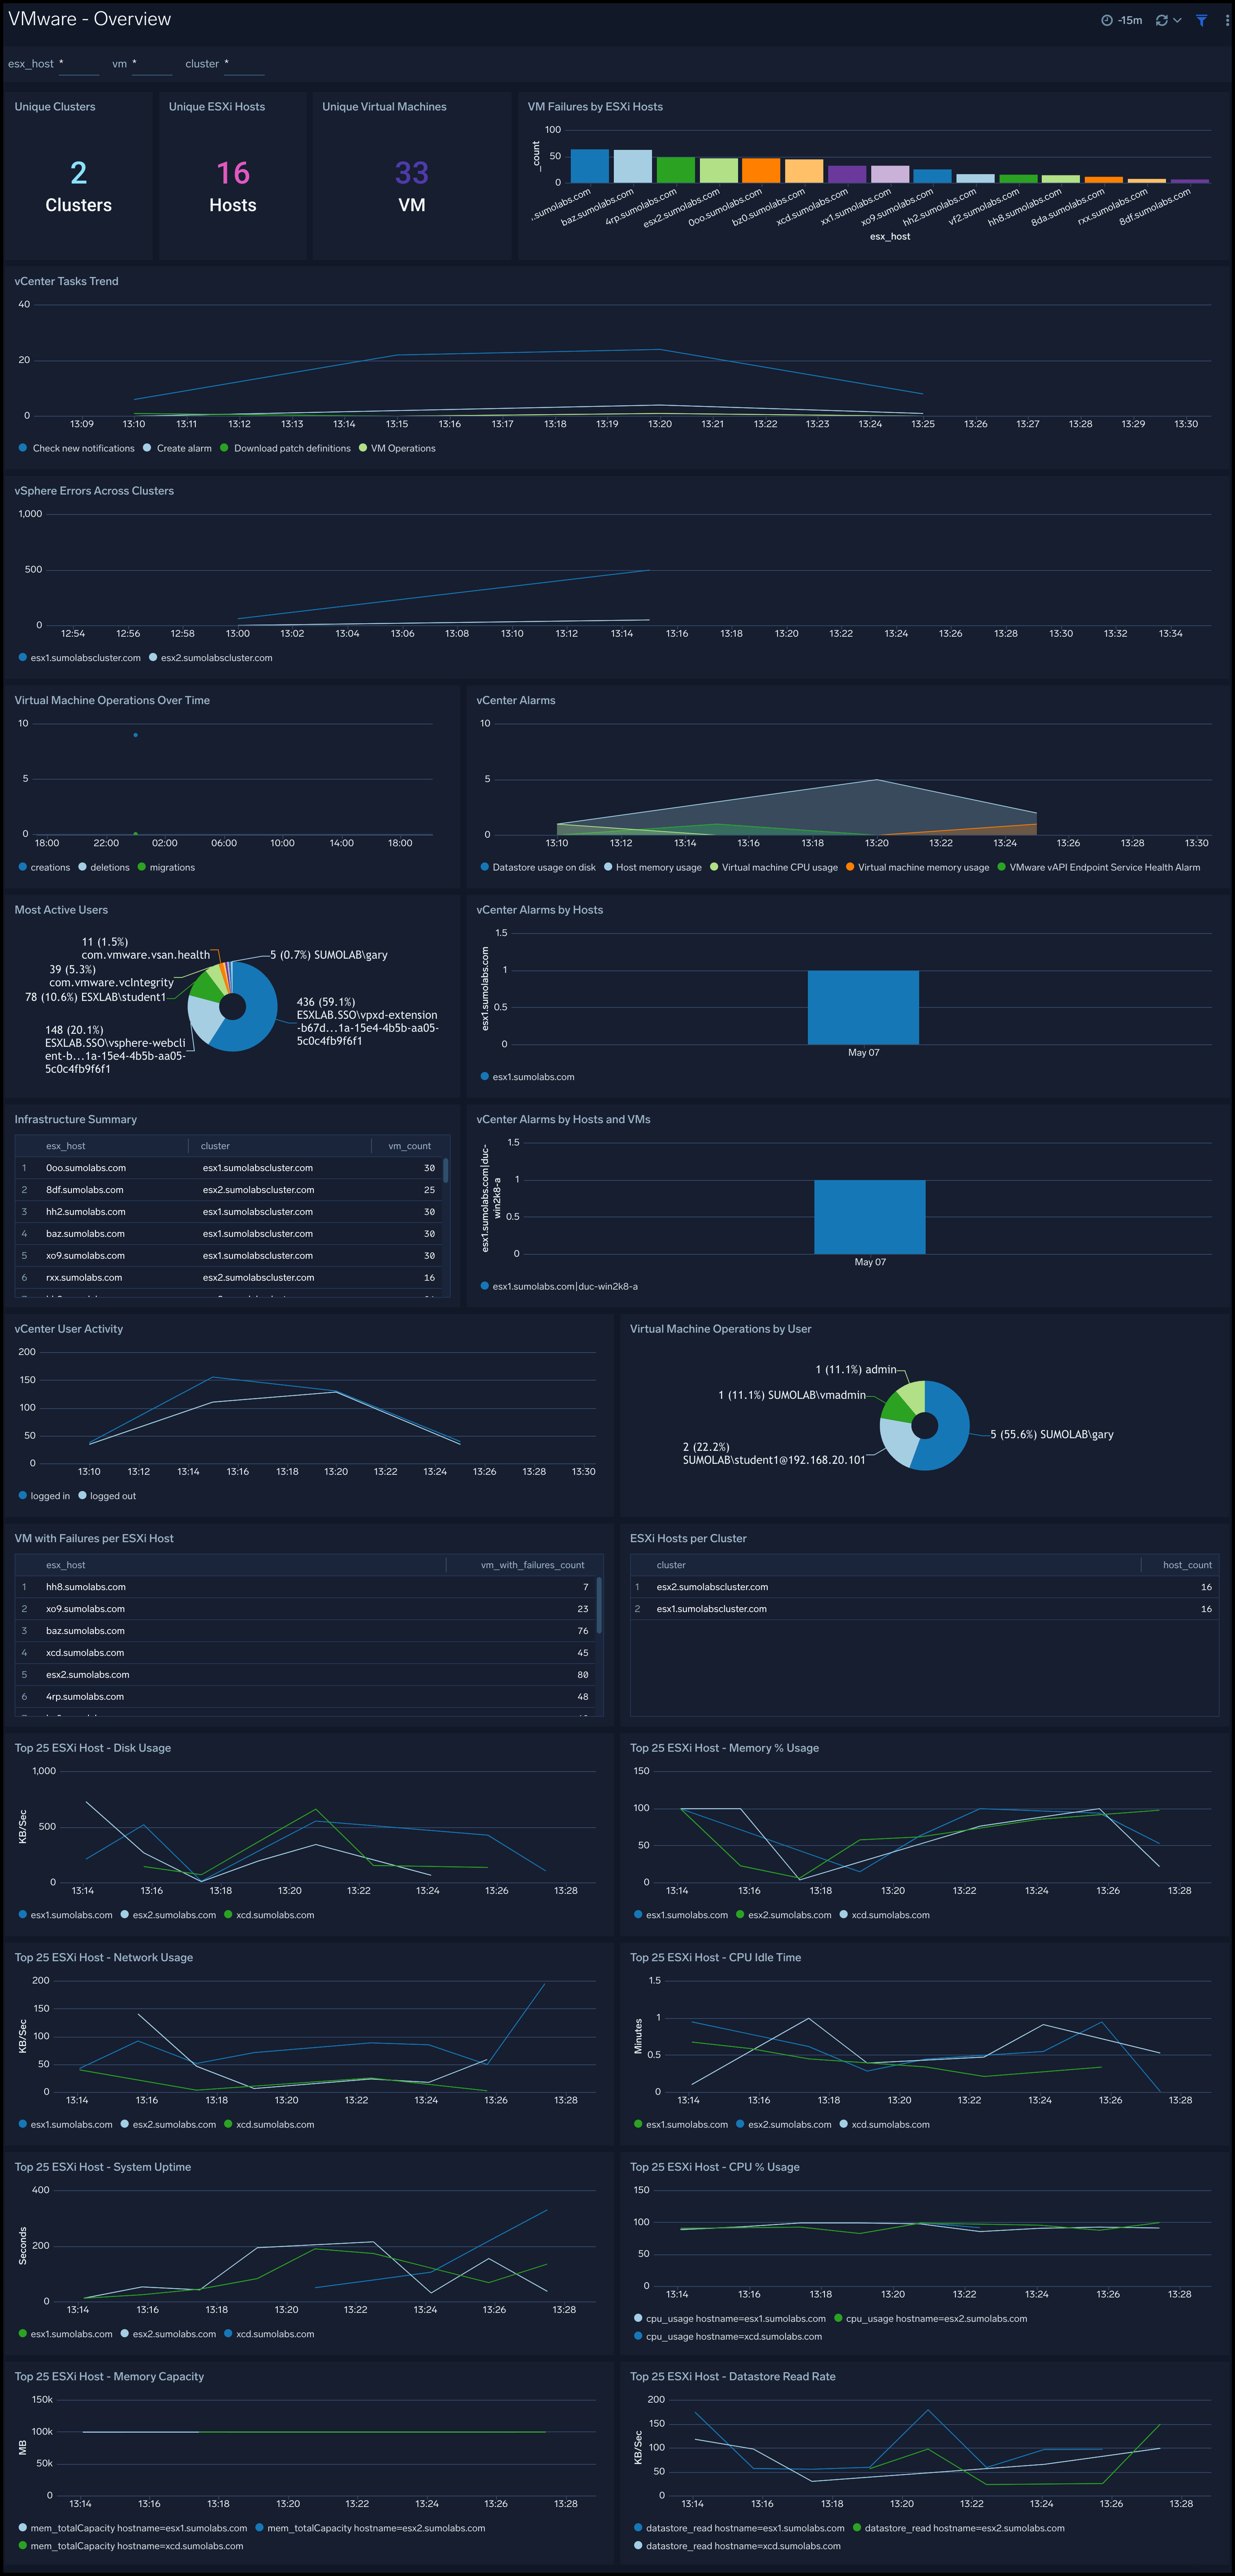
vCenter Operations - Overview
The VMware - vCenter Operations - Overview dashboard provides an at-a-glance view of unique clusters, ESXi hosts, unique VMs, and VM failures by ESXi host, as well as vCenter task trends, vSphere errors across clusters, VM operations over time, ESXi per-host metrics for CPU usage and idle time, memory usage and capacity, disk usage and datastore read rate, network usage and system uptime. It also displays data for vCenter alarms, user activity, and VM operations by user.
Use this dashboard to:
- Get an at-a-glance overview of your entire VMware infrastructure.
- Monitor VM failures, tasks, and errors.
- Track user activity and operations.
- Review summaries of the state of the components of the VMware infrastructure.
- Assess infrastructure issues at a glance with the dashboard panels.
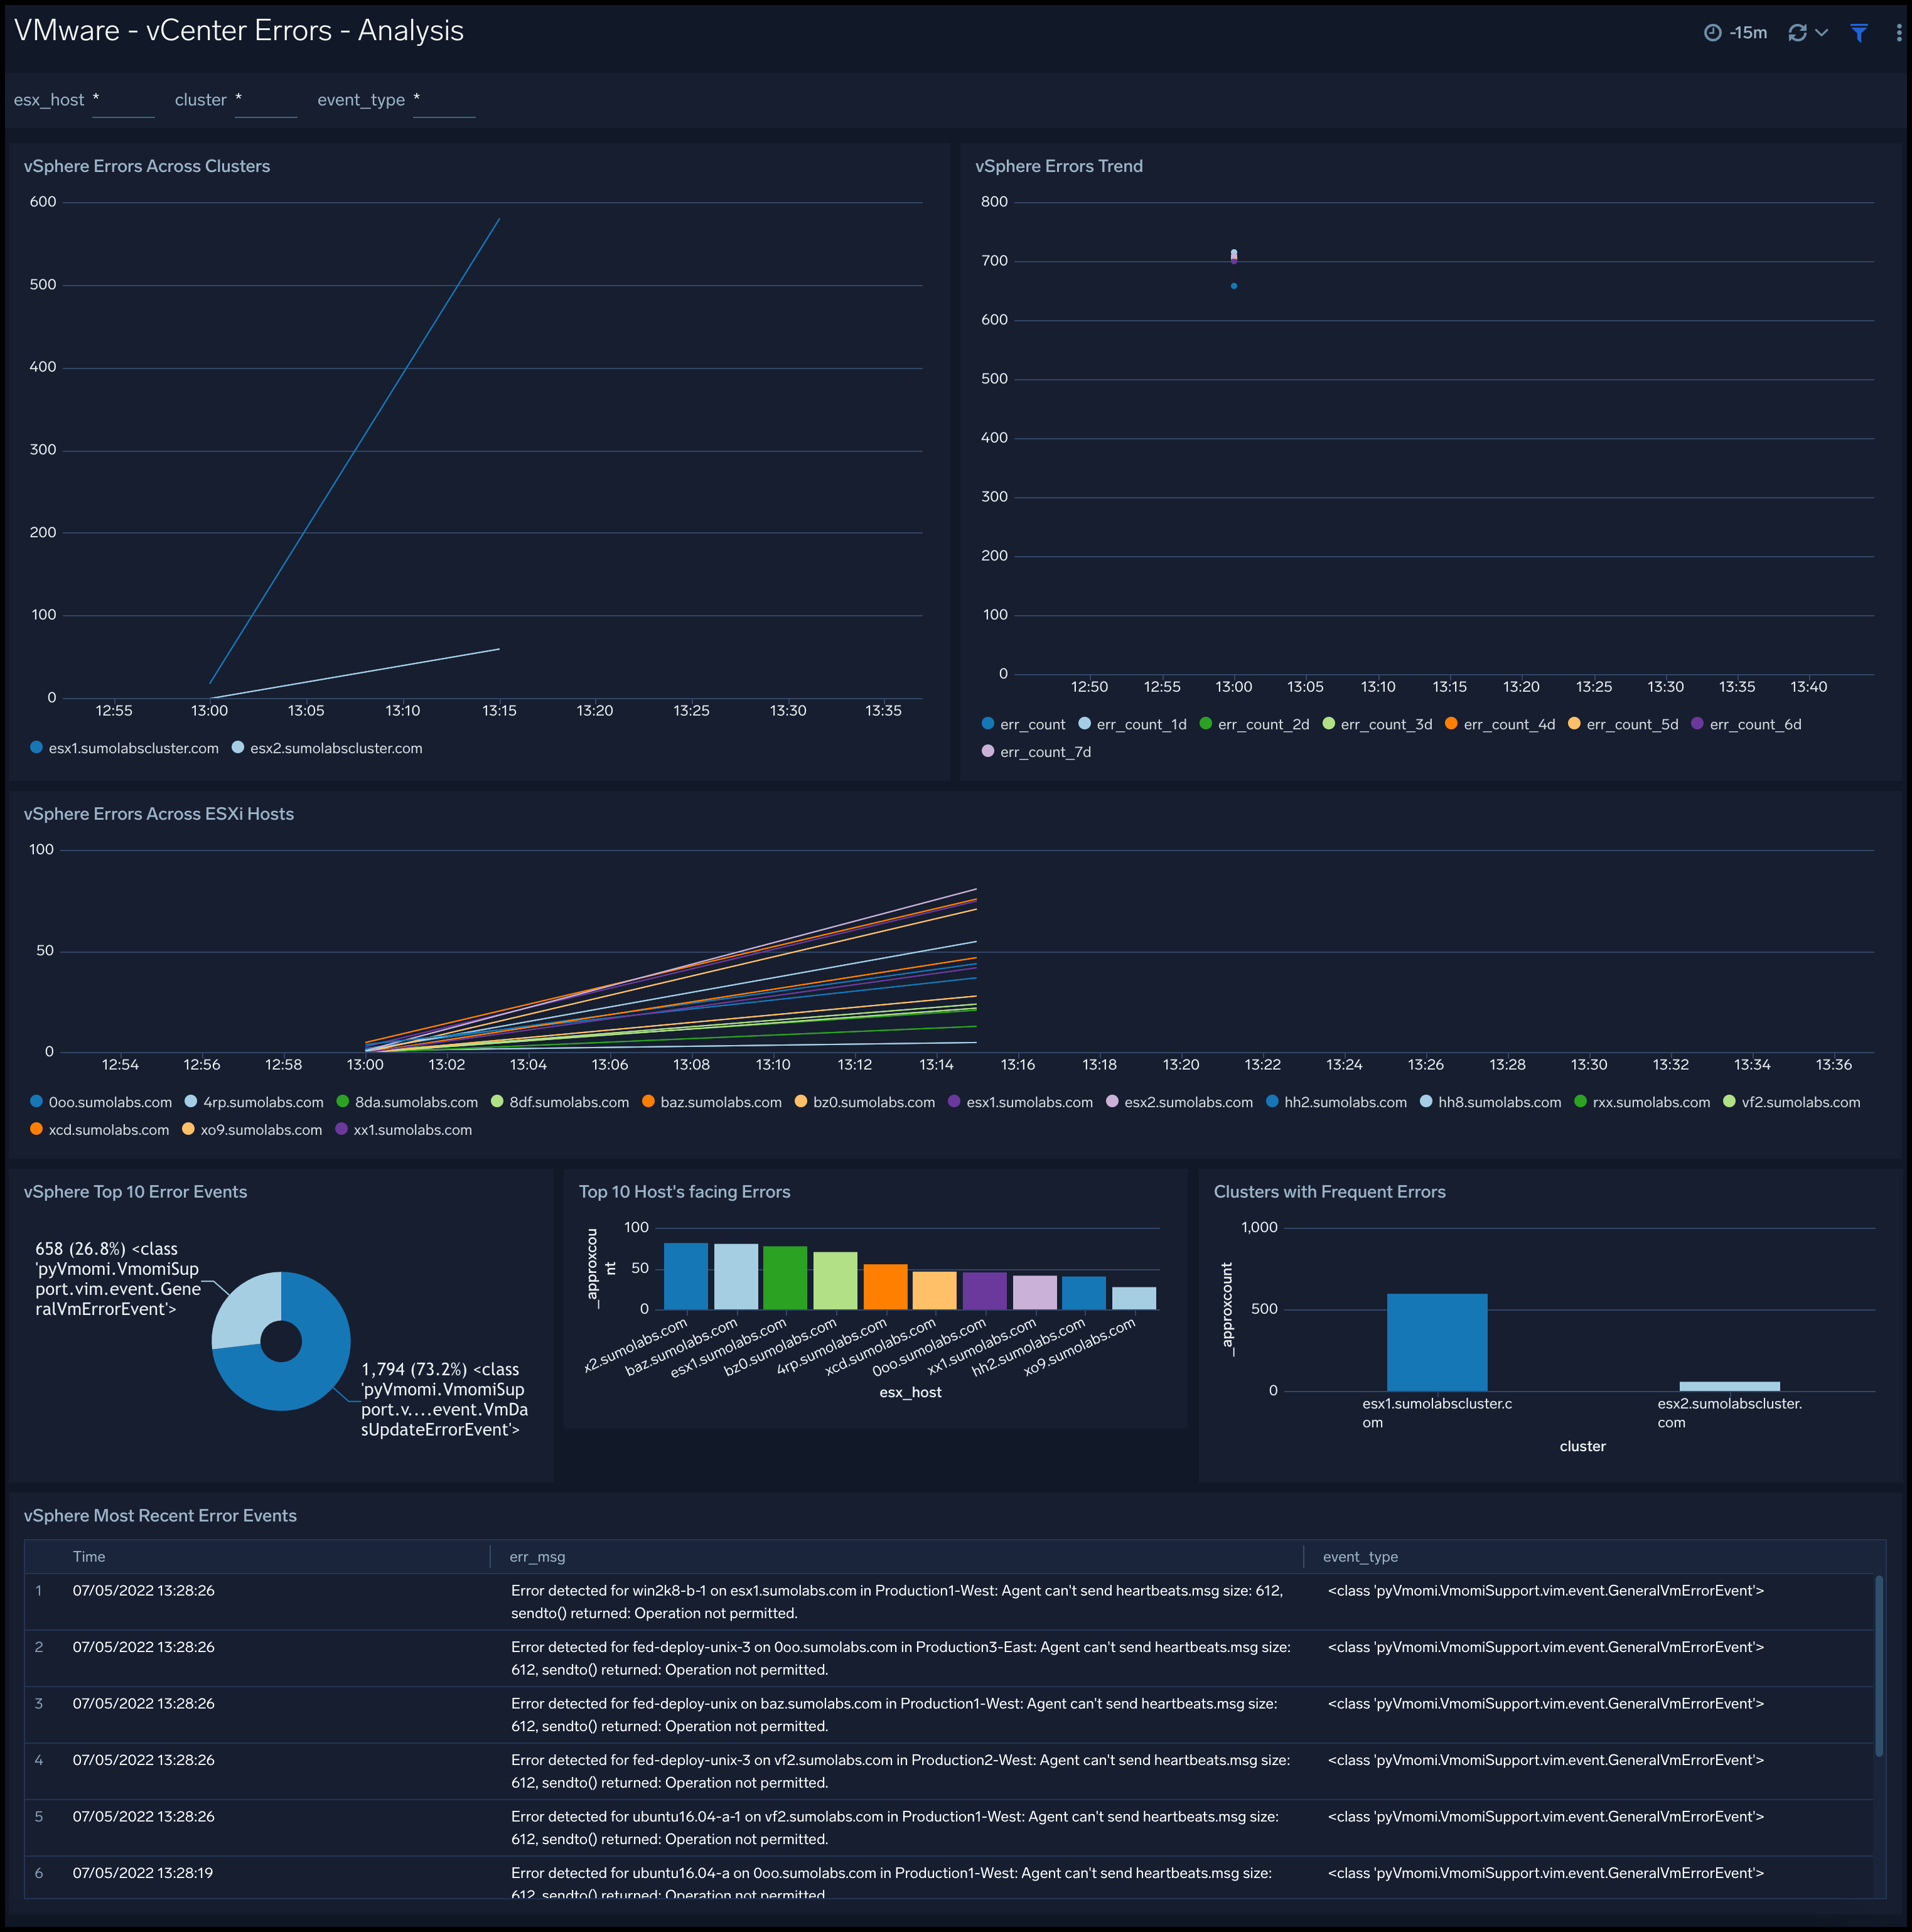
vCenter Errors - Analysis
The VMware - vCenter Errors - Analysis dashboard provides detailed information about the errors across cluster and hosts. You can easily review error trends, top error events, and most recent error events.
Use this dashboard to:
- Review 7 day error trends.
- Quickly assess the most frequent and recurring error conditions.
- Review error messages, host, cluster, and other details to help with debugging.
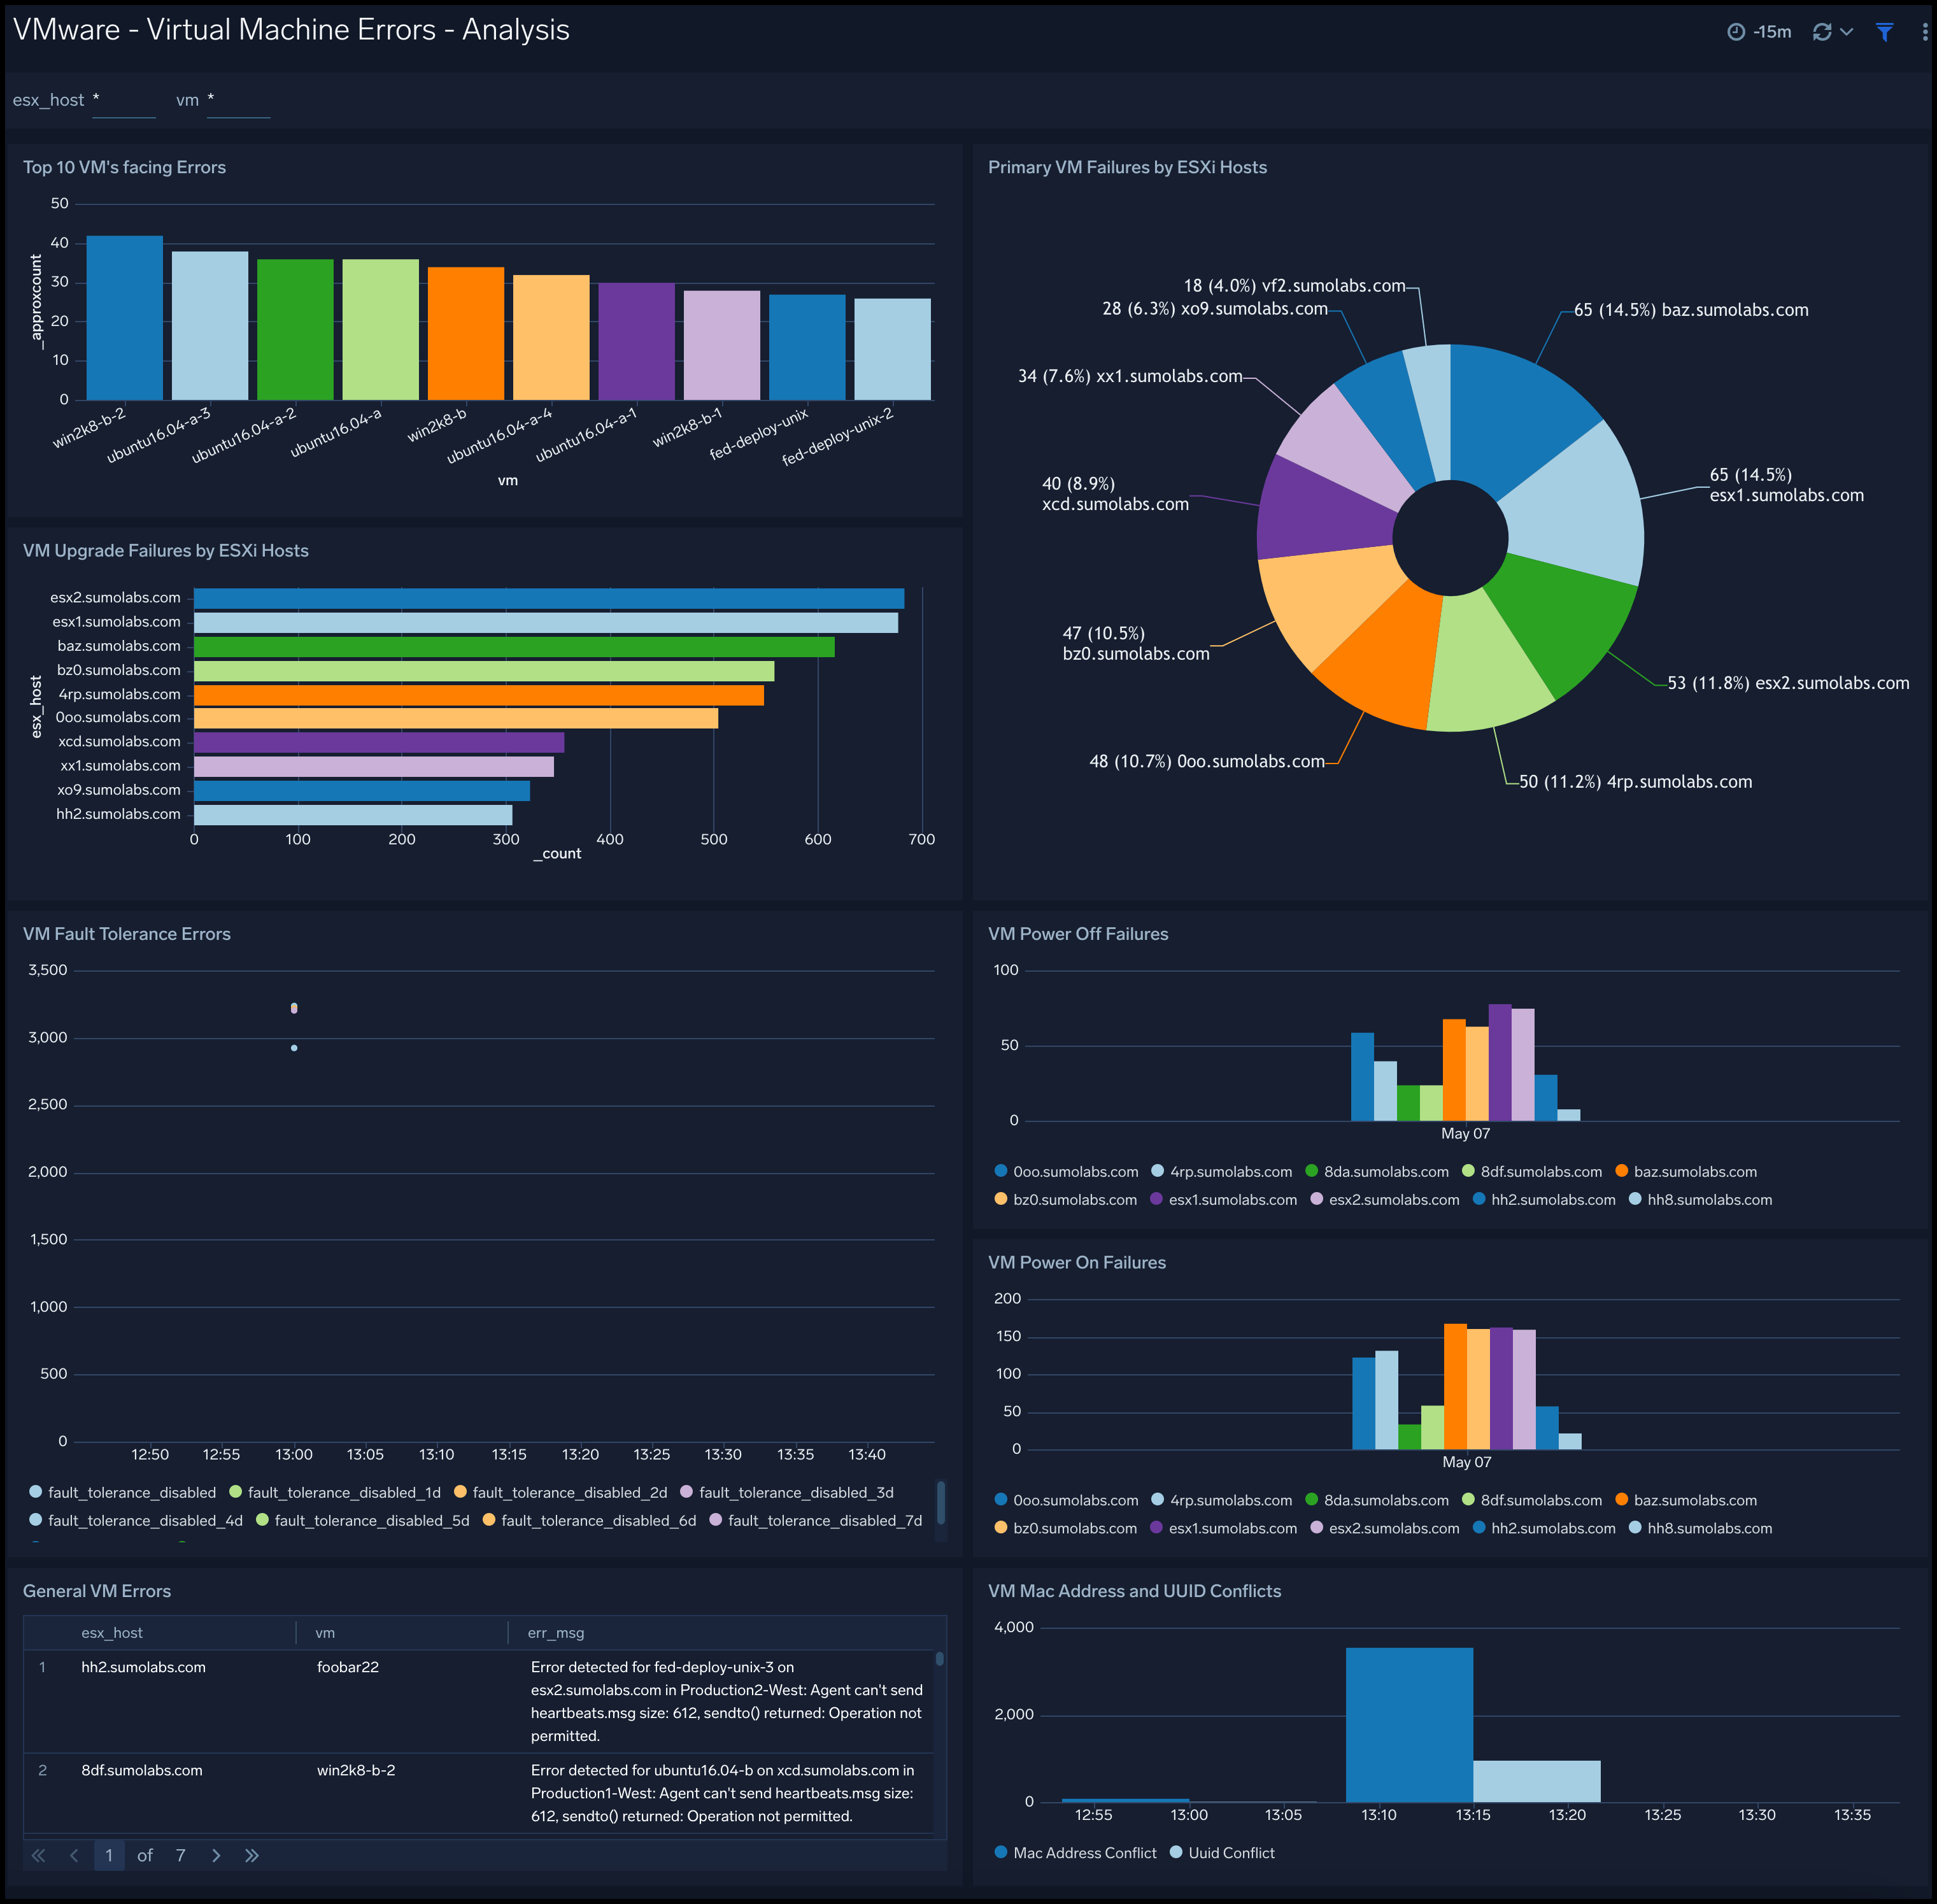
Virtual Machine Errors - Analysis
The VMware - Virtual Machine Errors - Analysis dashboard provides an at-a-glance analysis of VM errors, including MAC address and UUID conflicts, upgrade and VM failures by host, fault tolerance errors, VM power failures, and general VM errors.
Use this dashboard to:
- Monitor faulty VMs with performance or other issues.
- Determine VMs with power on and off failures.
- Assess VMs with fault tolerance issues.
- Determine MAC address and UUID conflicts, as well as primary VM failures.
- Monitor overall VM health.
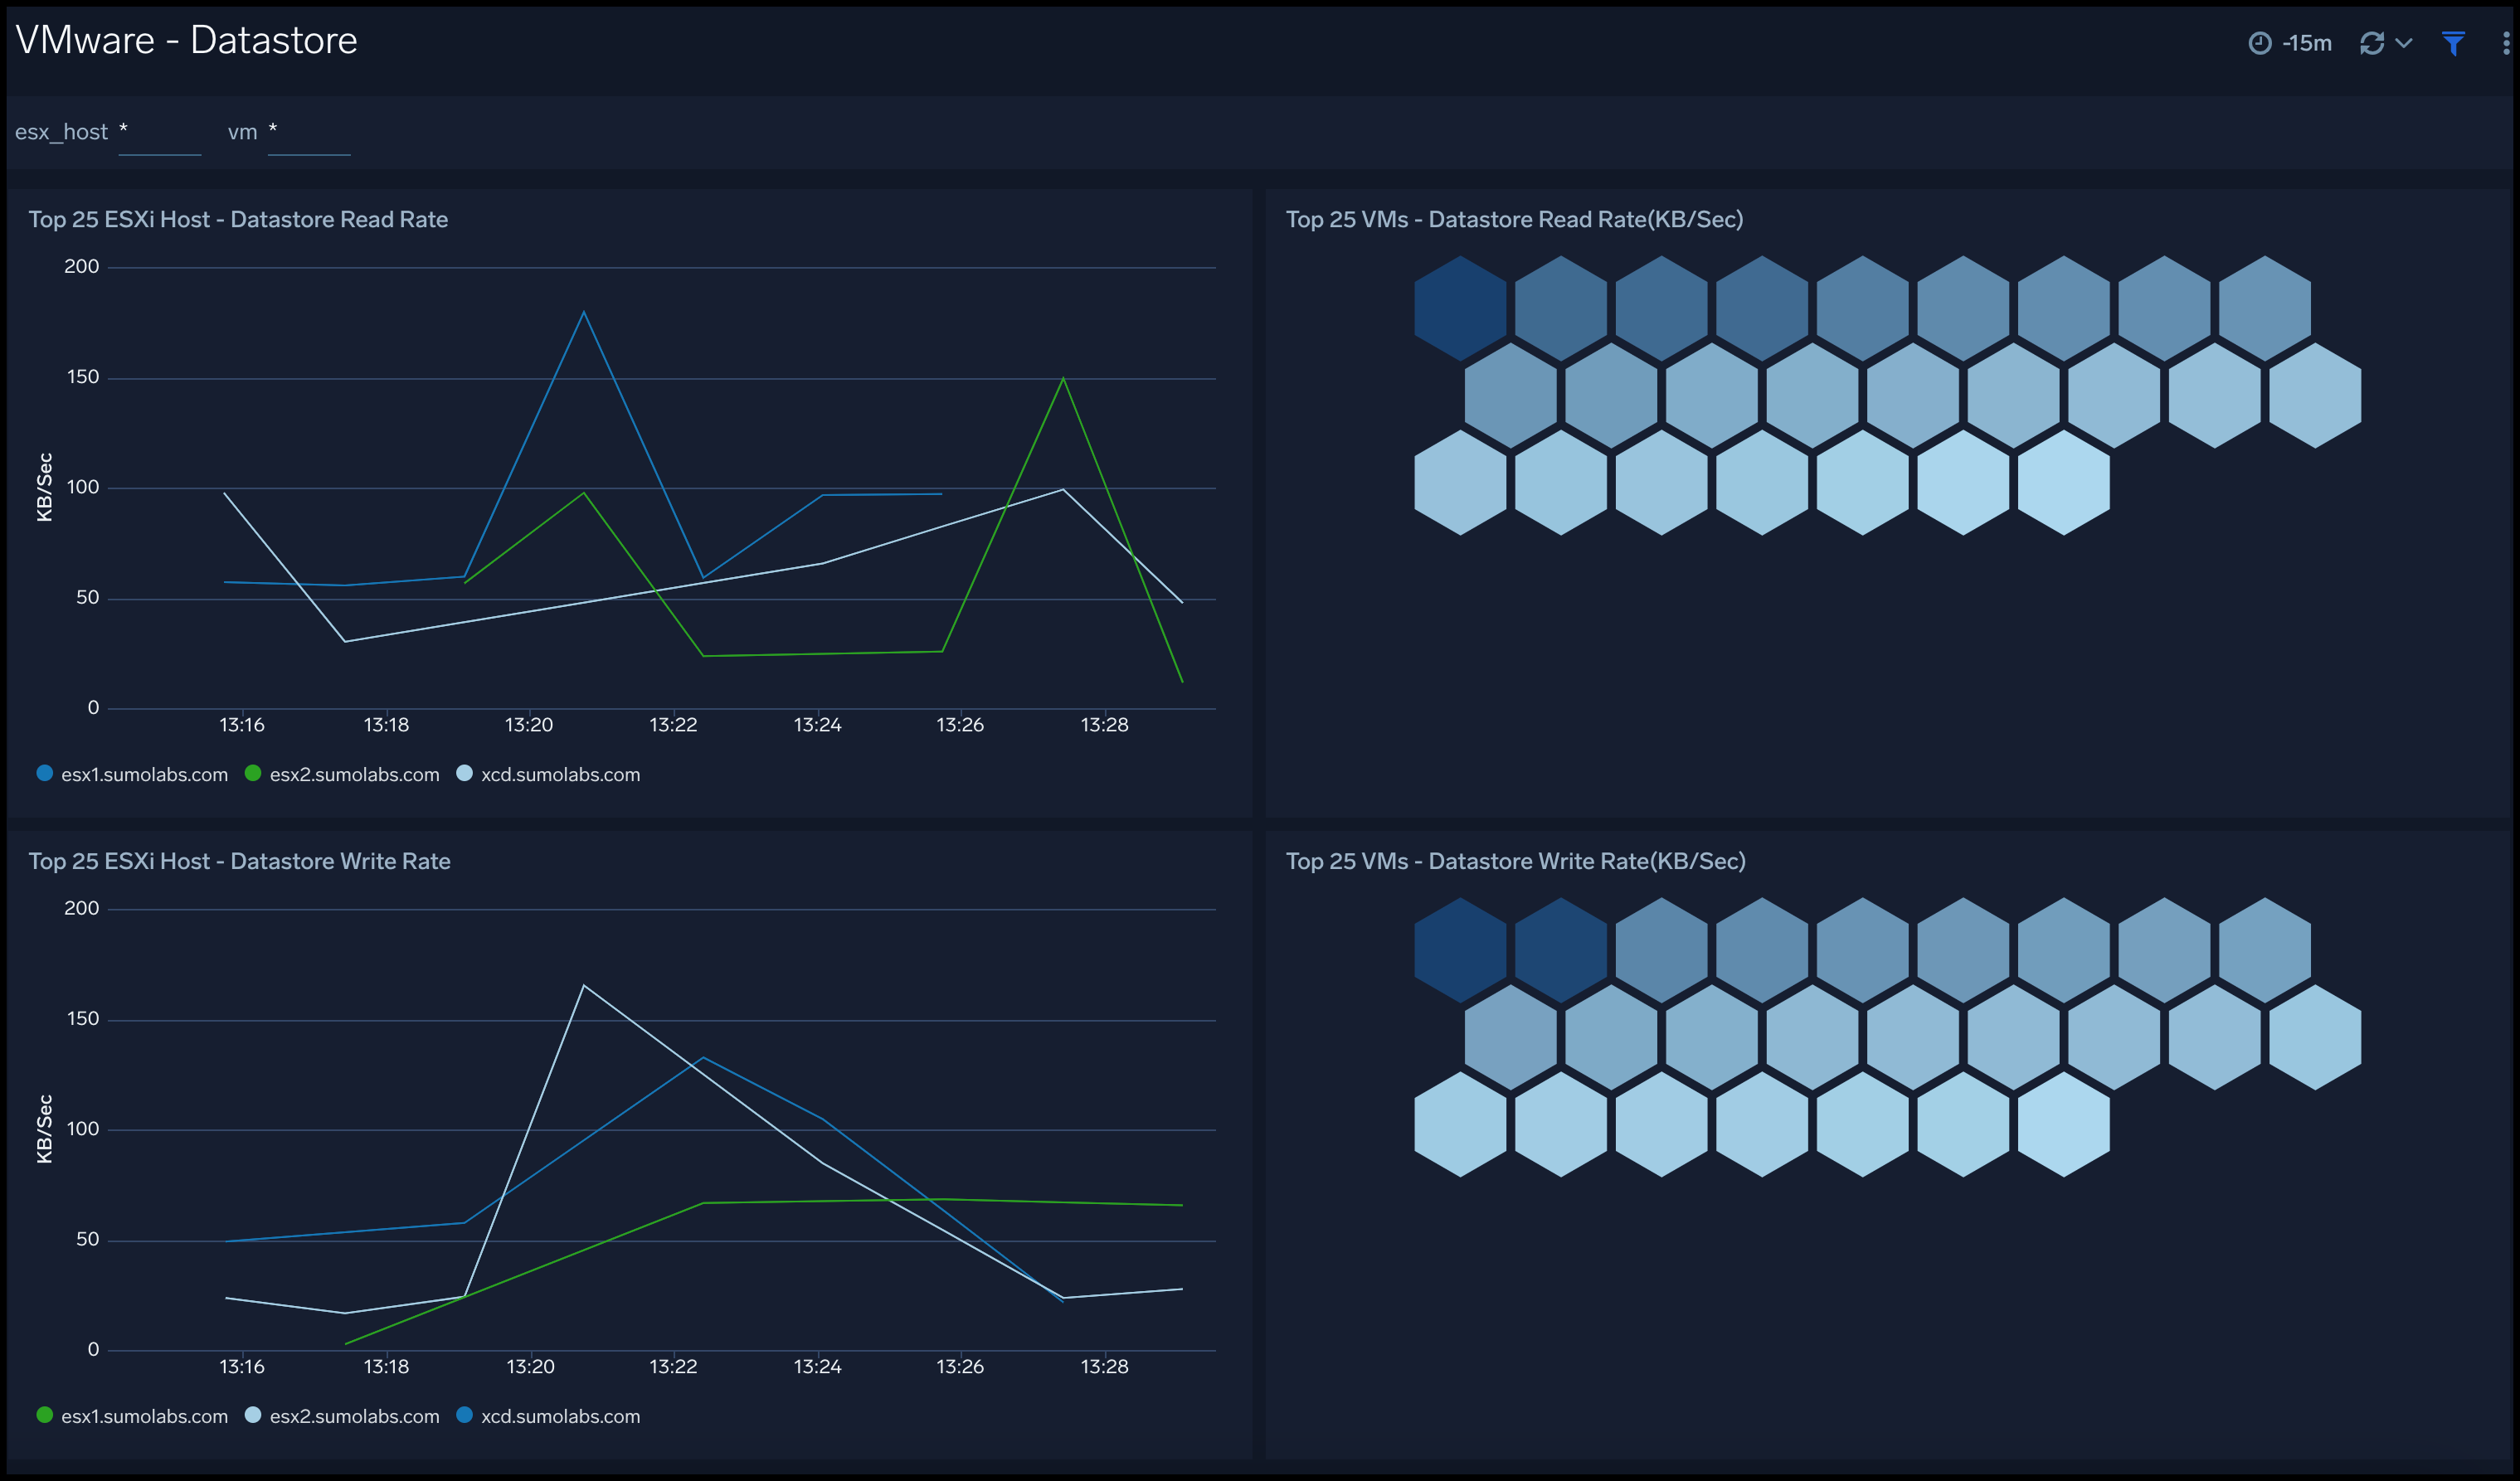
Datastore
The VMware - Datastore dashboard provides performance metrics on datastore read rates per ESXi host and VM, and datastore write rates per ESXi host and VM. A datastore is a manageable storage entity, usually used as a repository for virtual machine files including log files, scripts, configuration files, virtual disks, and so on.
Use this dashboard to:
- Review of the datastore reads and writes by the virtual machines and ESXi hosts.
- Identify excessive writes or reads by a VM or ESXi host.
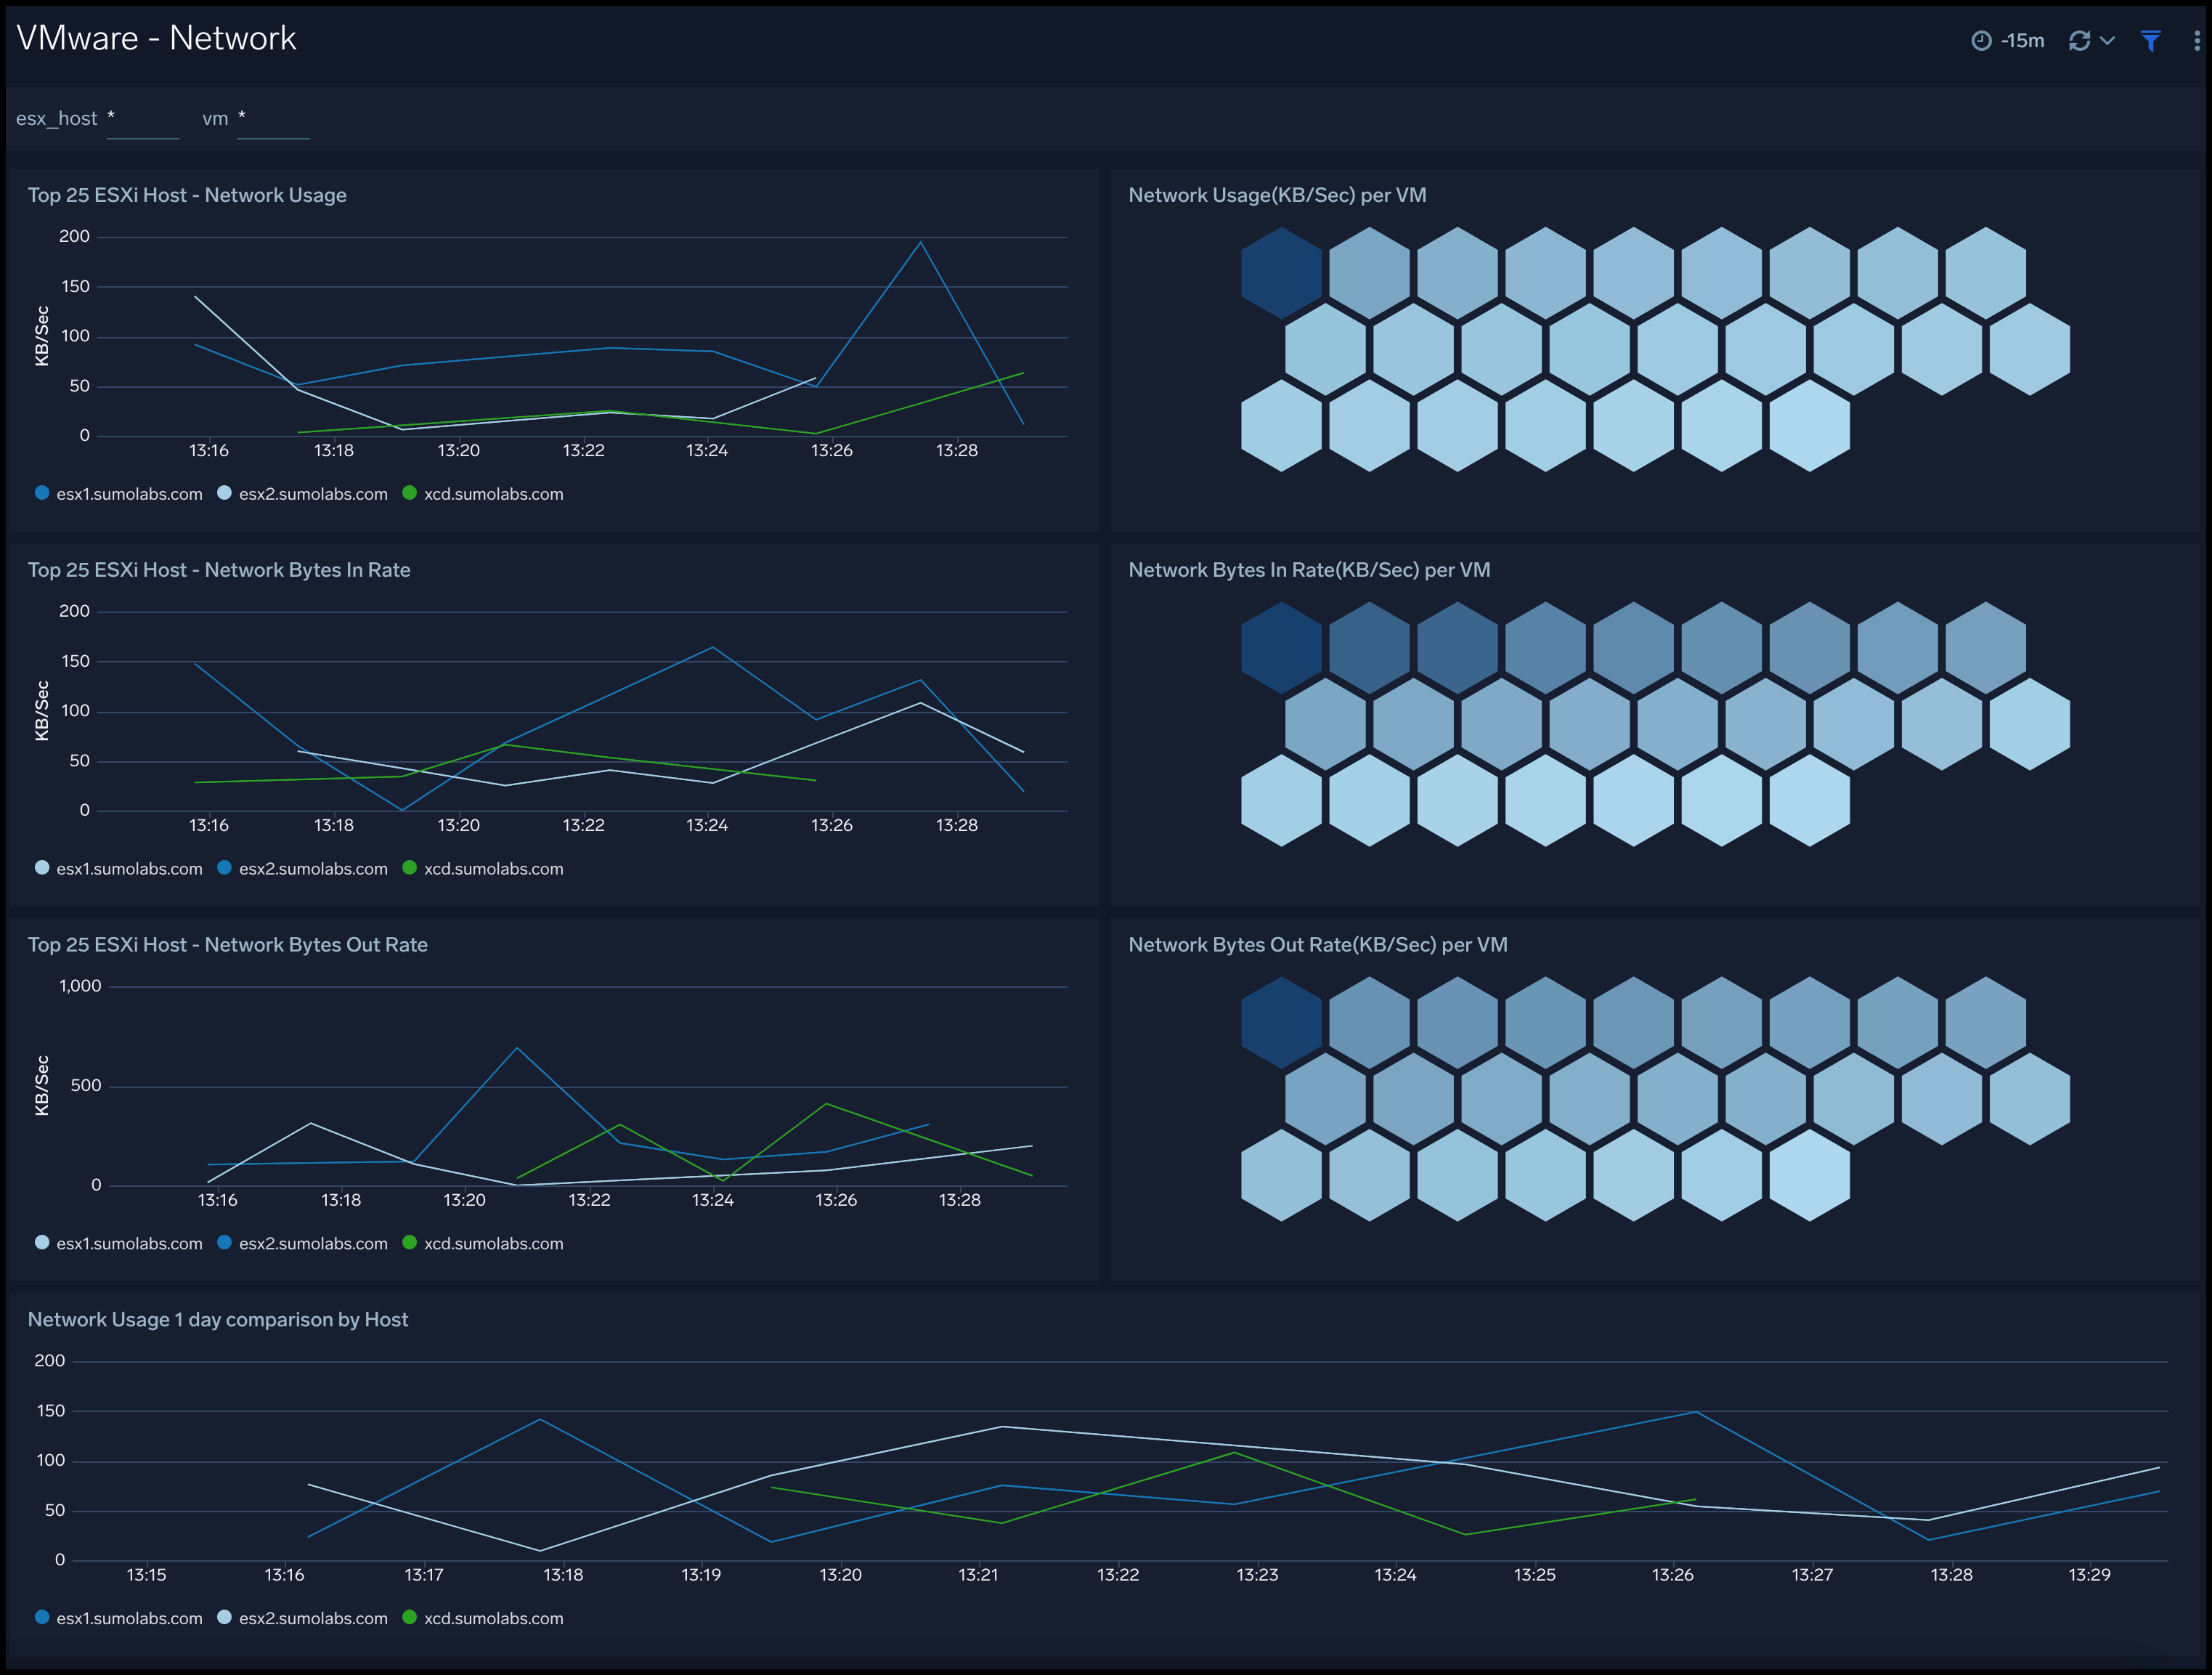
Network
The VMware - Network dashboard keeps track of the data in and data out of the ESXi hosts and virtual machines. This dashboard provides an at-a-glance analysis of network usage per ESXi host and VM, network InPacket rate per ESXi host and VM, network OutPacket rate per ESXi host and VM, and network 1 day comparison by host.
Use this dashboard to:
- Identify excessing packet traffic in or out.
- Identify network inactivity for a VM or host.
- Track network usage.
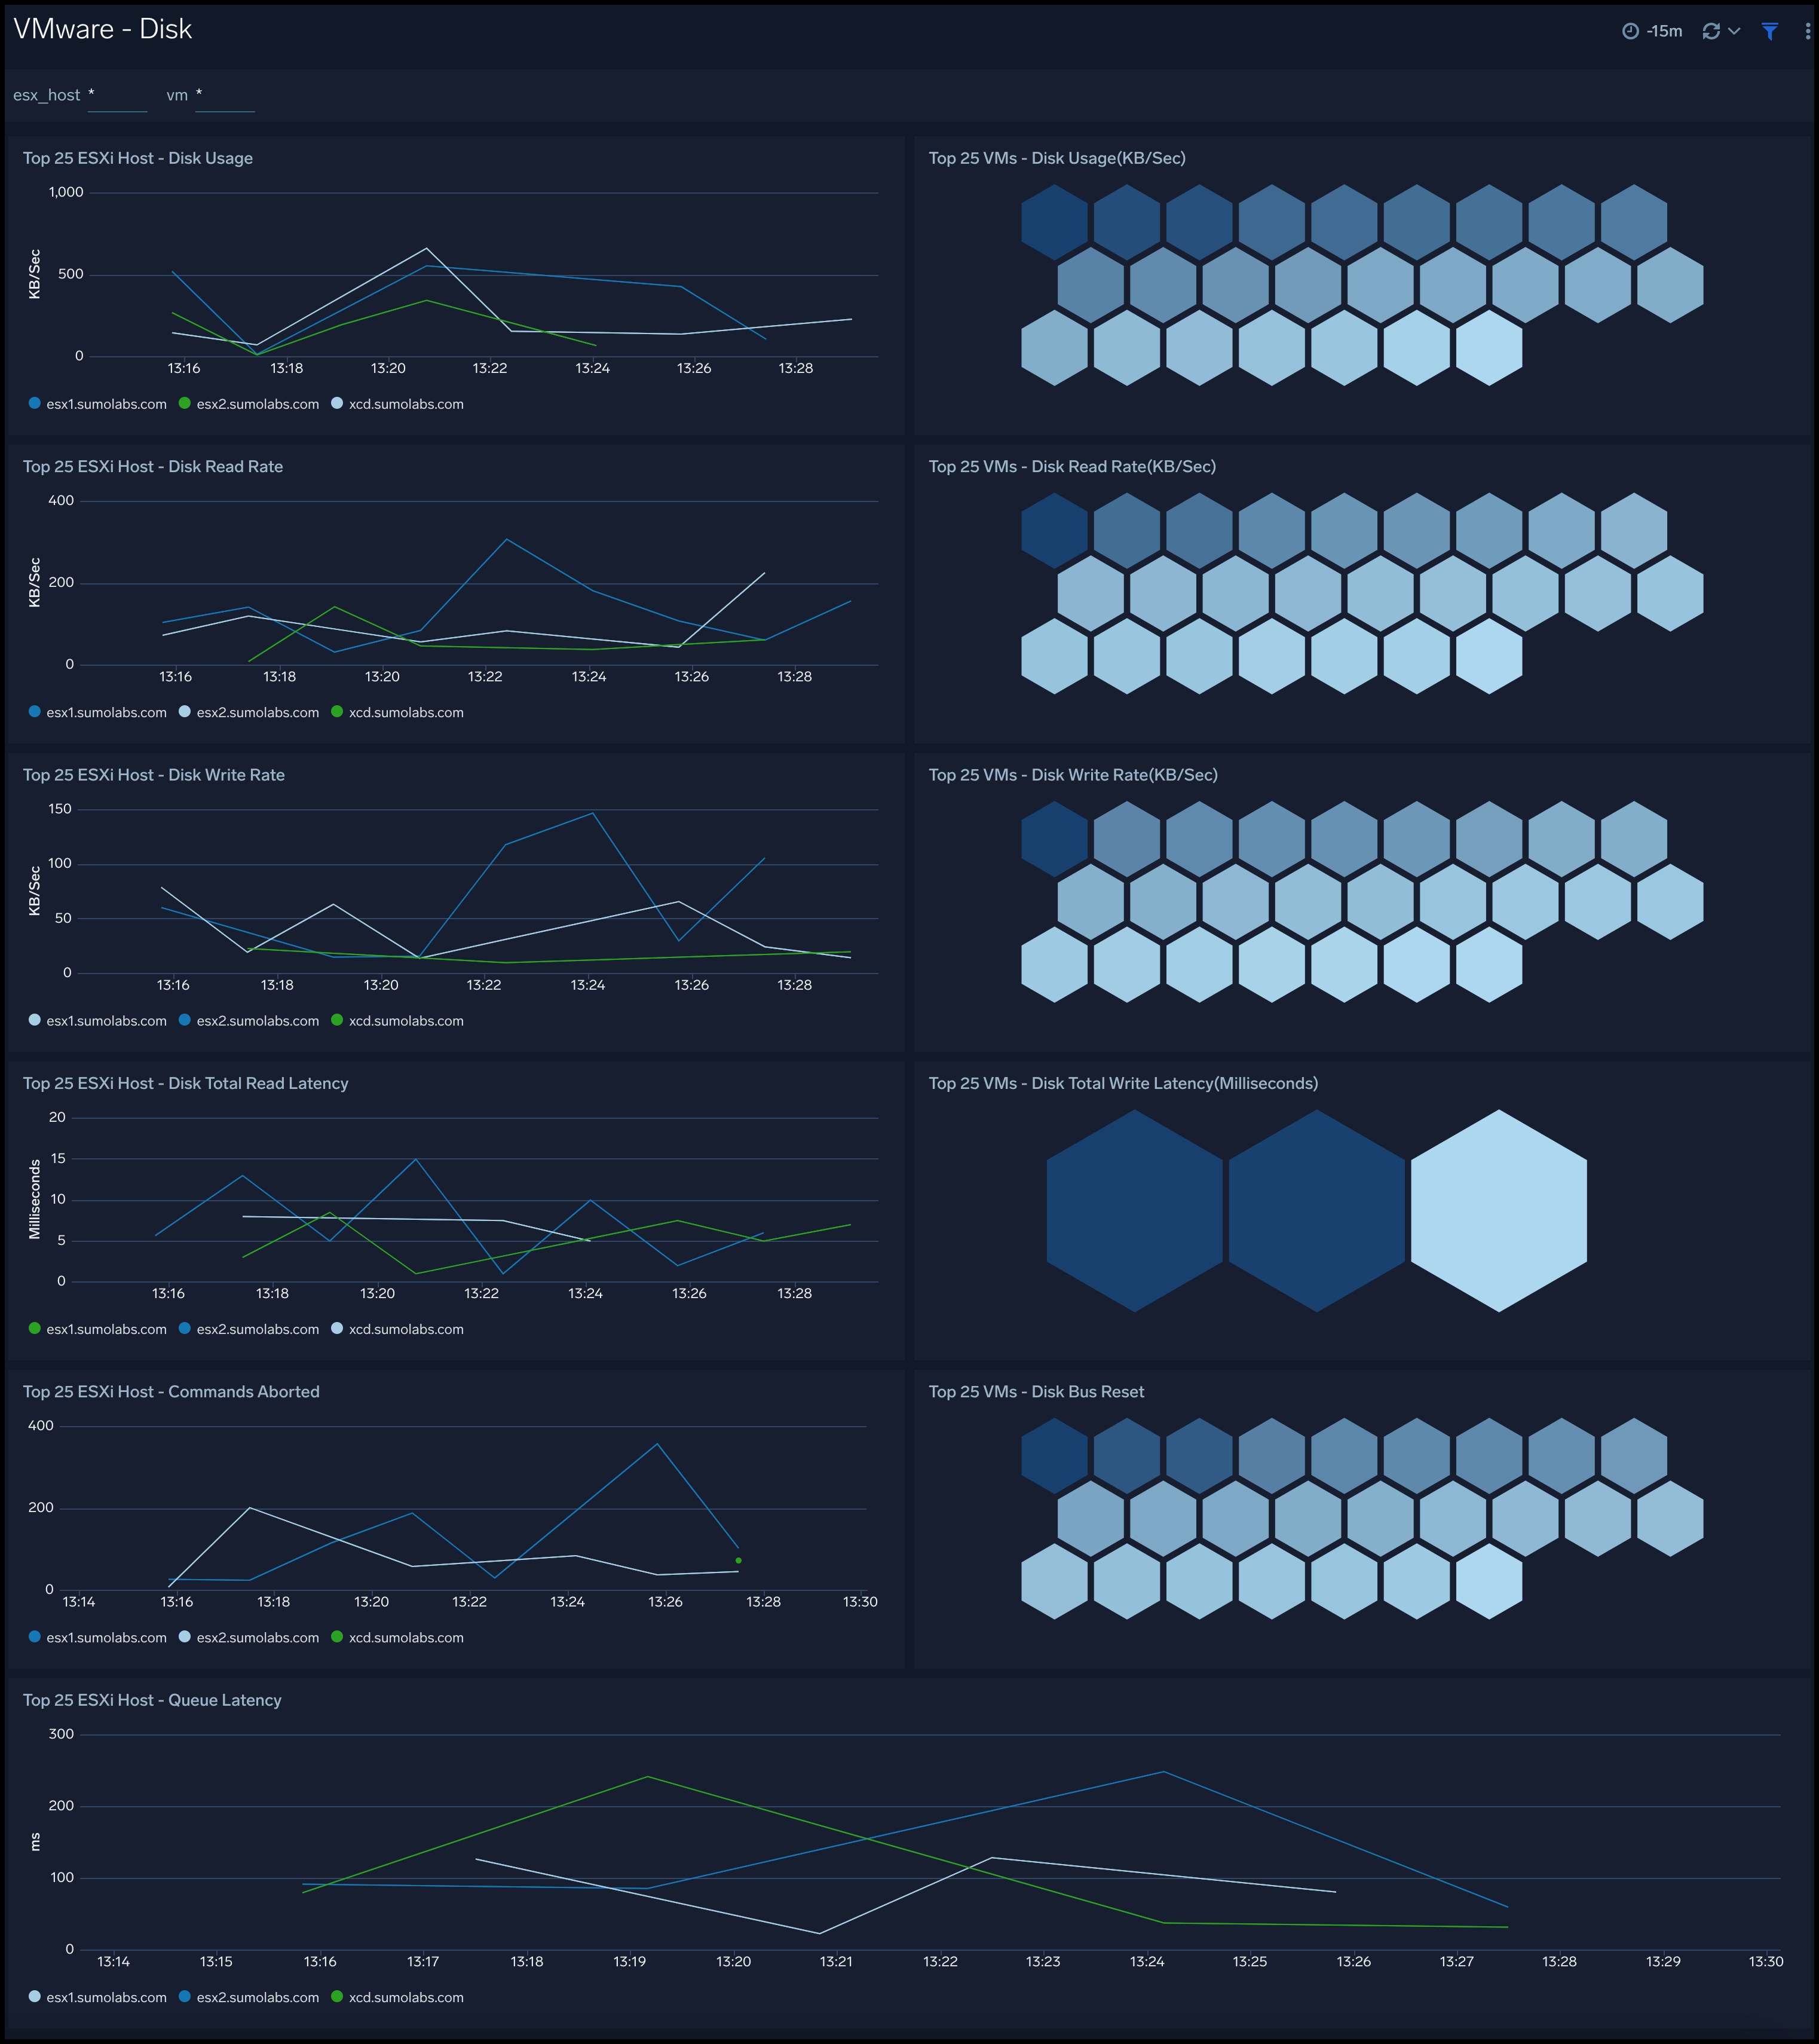
Disk
The VMware - Disk dashboard keeps track of the disk usage, disk writes and reads by the ESXi hosts and virtual machines. You can easily review metrics for disk usage per ESXi host and VM, disk read rate per ESXi host and VM, disk write rate per ESXi host and VM, disk total read latency per host, and disk total write latency per host.
Use this dashboard to:
- Identify excessive writes or reads by a VM or a ESXi host.
- Track disk read and write latency.
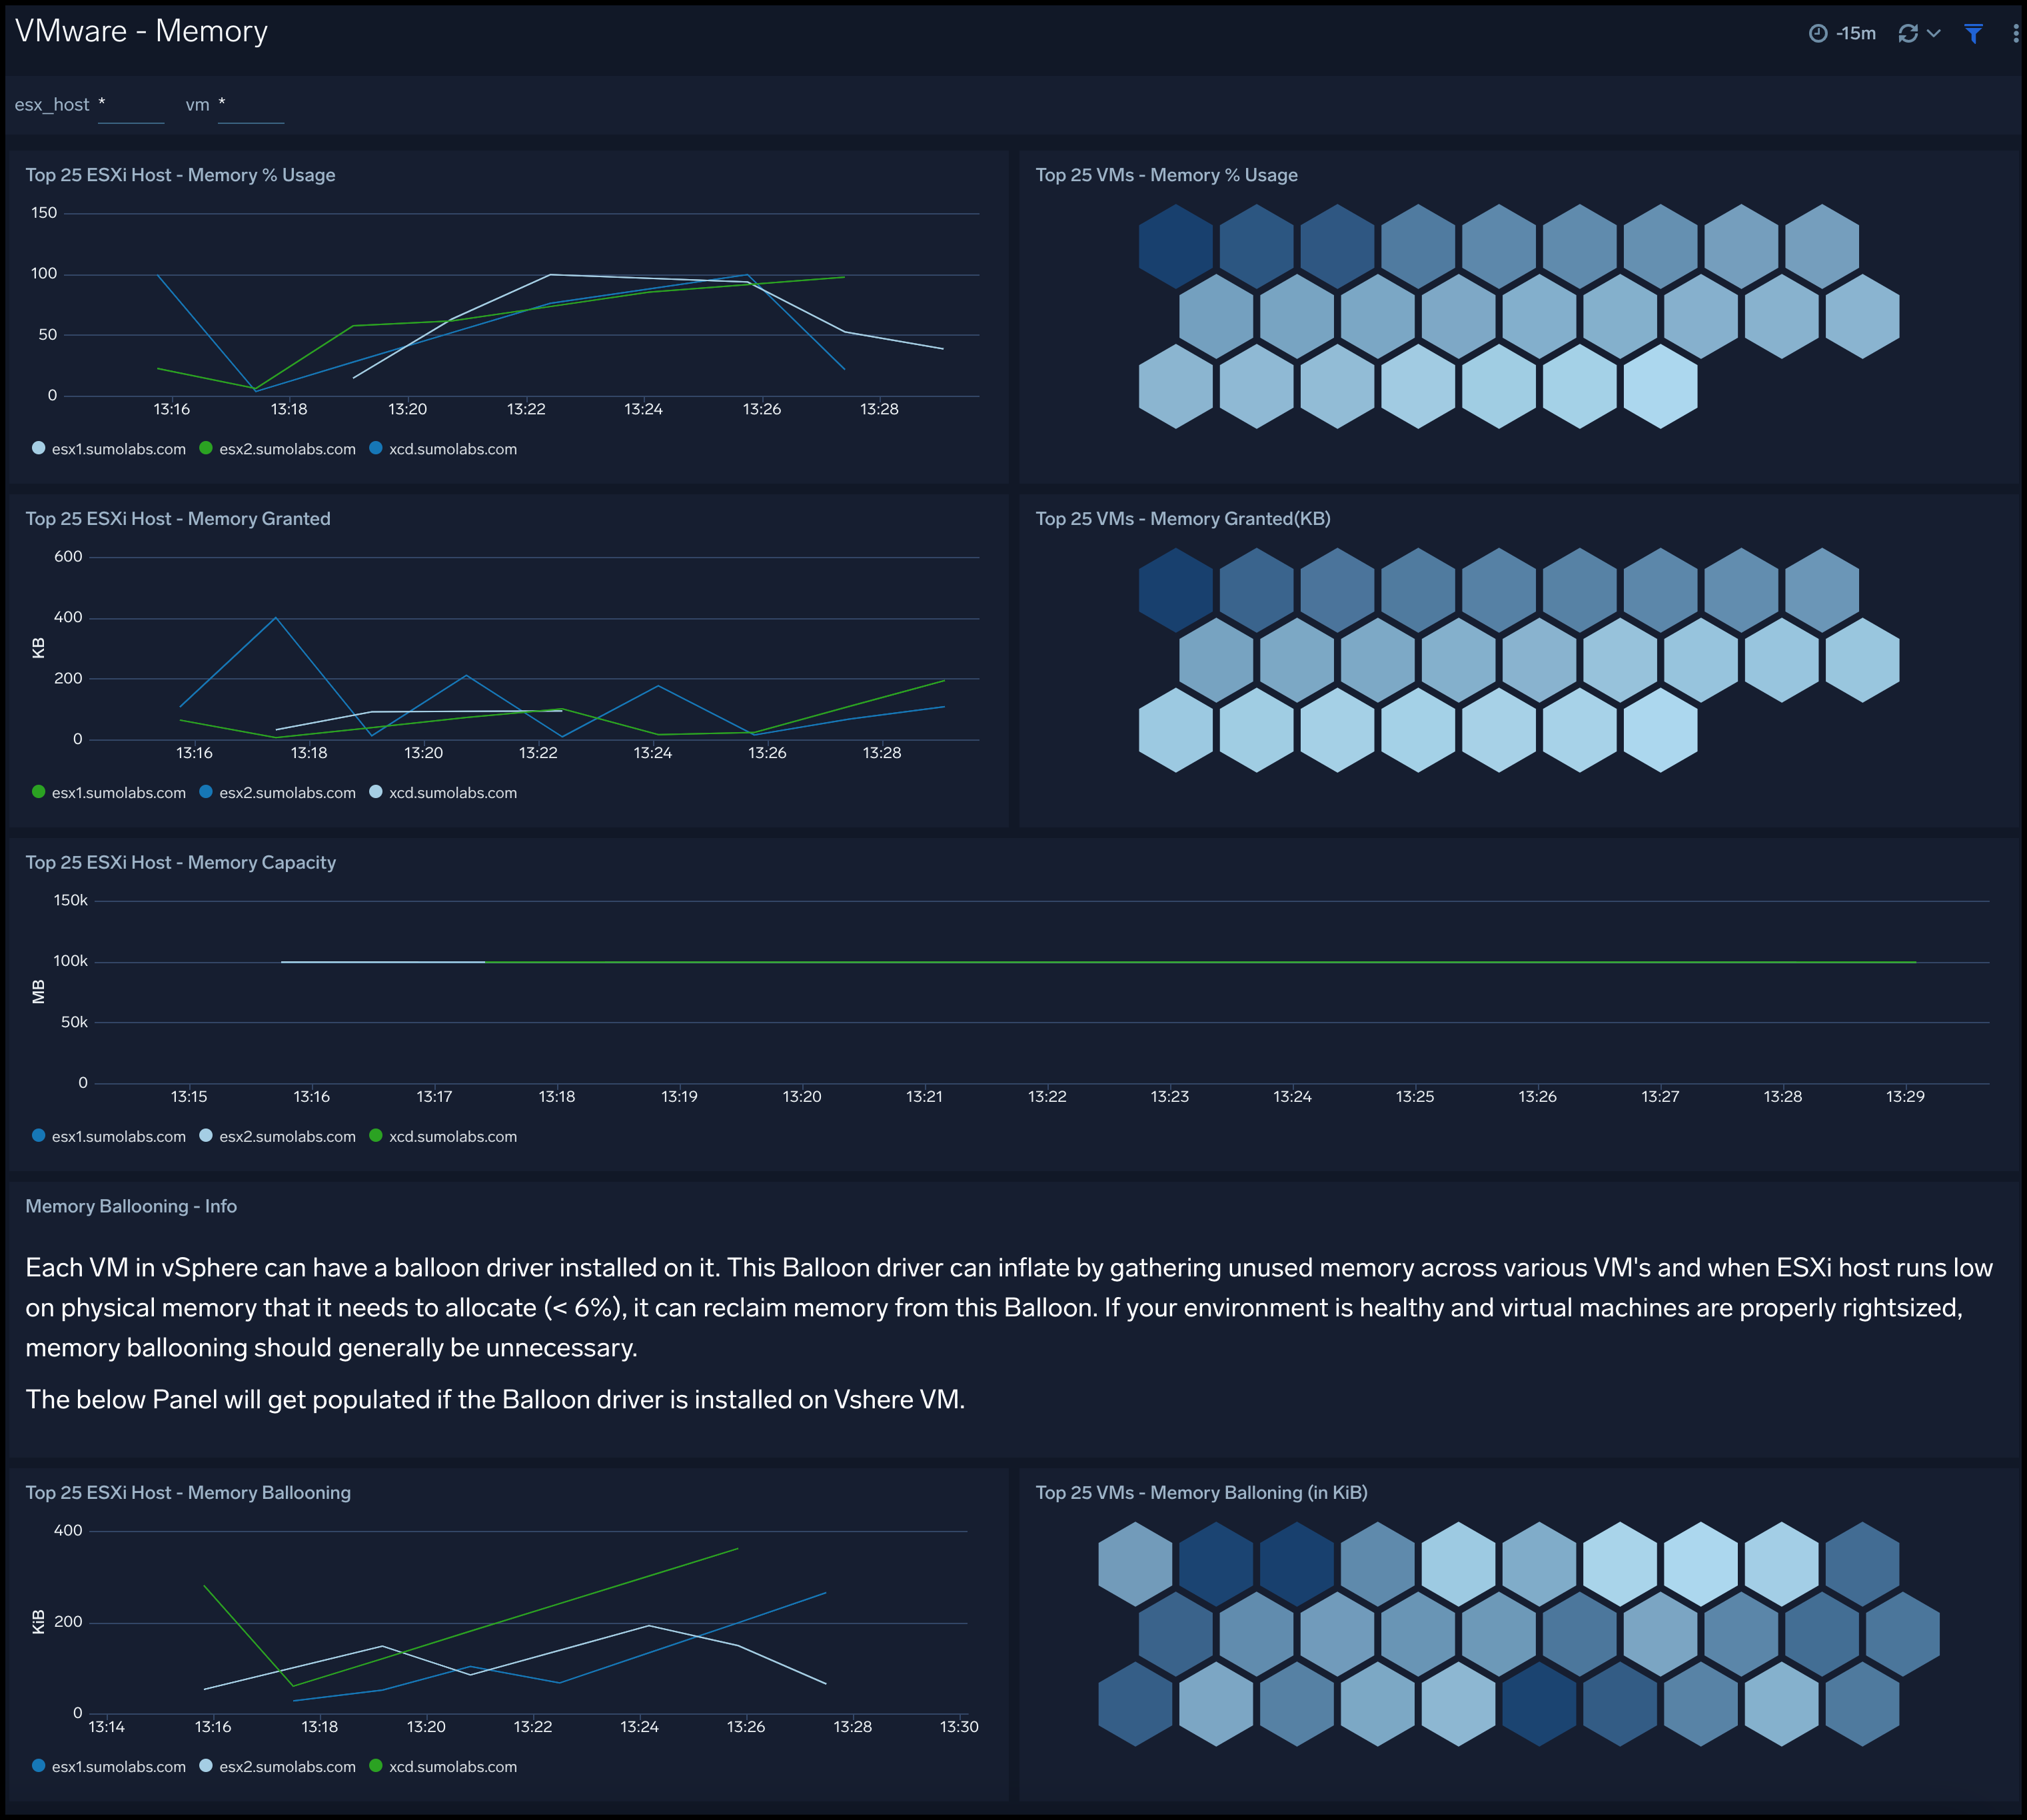
Memory
The VMware - Memory dashboard provides an at-a-glance analysis of memory usage by ESXi host and VM, memory granted by ESXi host and VM, and memory capacity by ESXi host.
Use this dashboard to:
- Review of the memory usage per virtual machine and ESXi host.
- Identify excessive memory usage by VM or ESXi host.
- Track granted memory and memory capacity to determine memory needs and over provisioning.
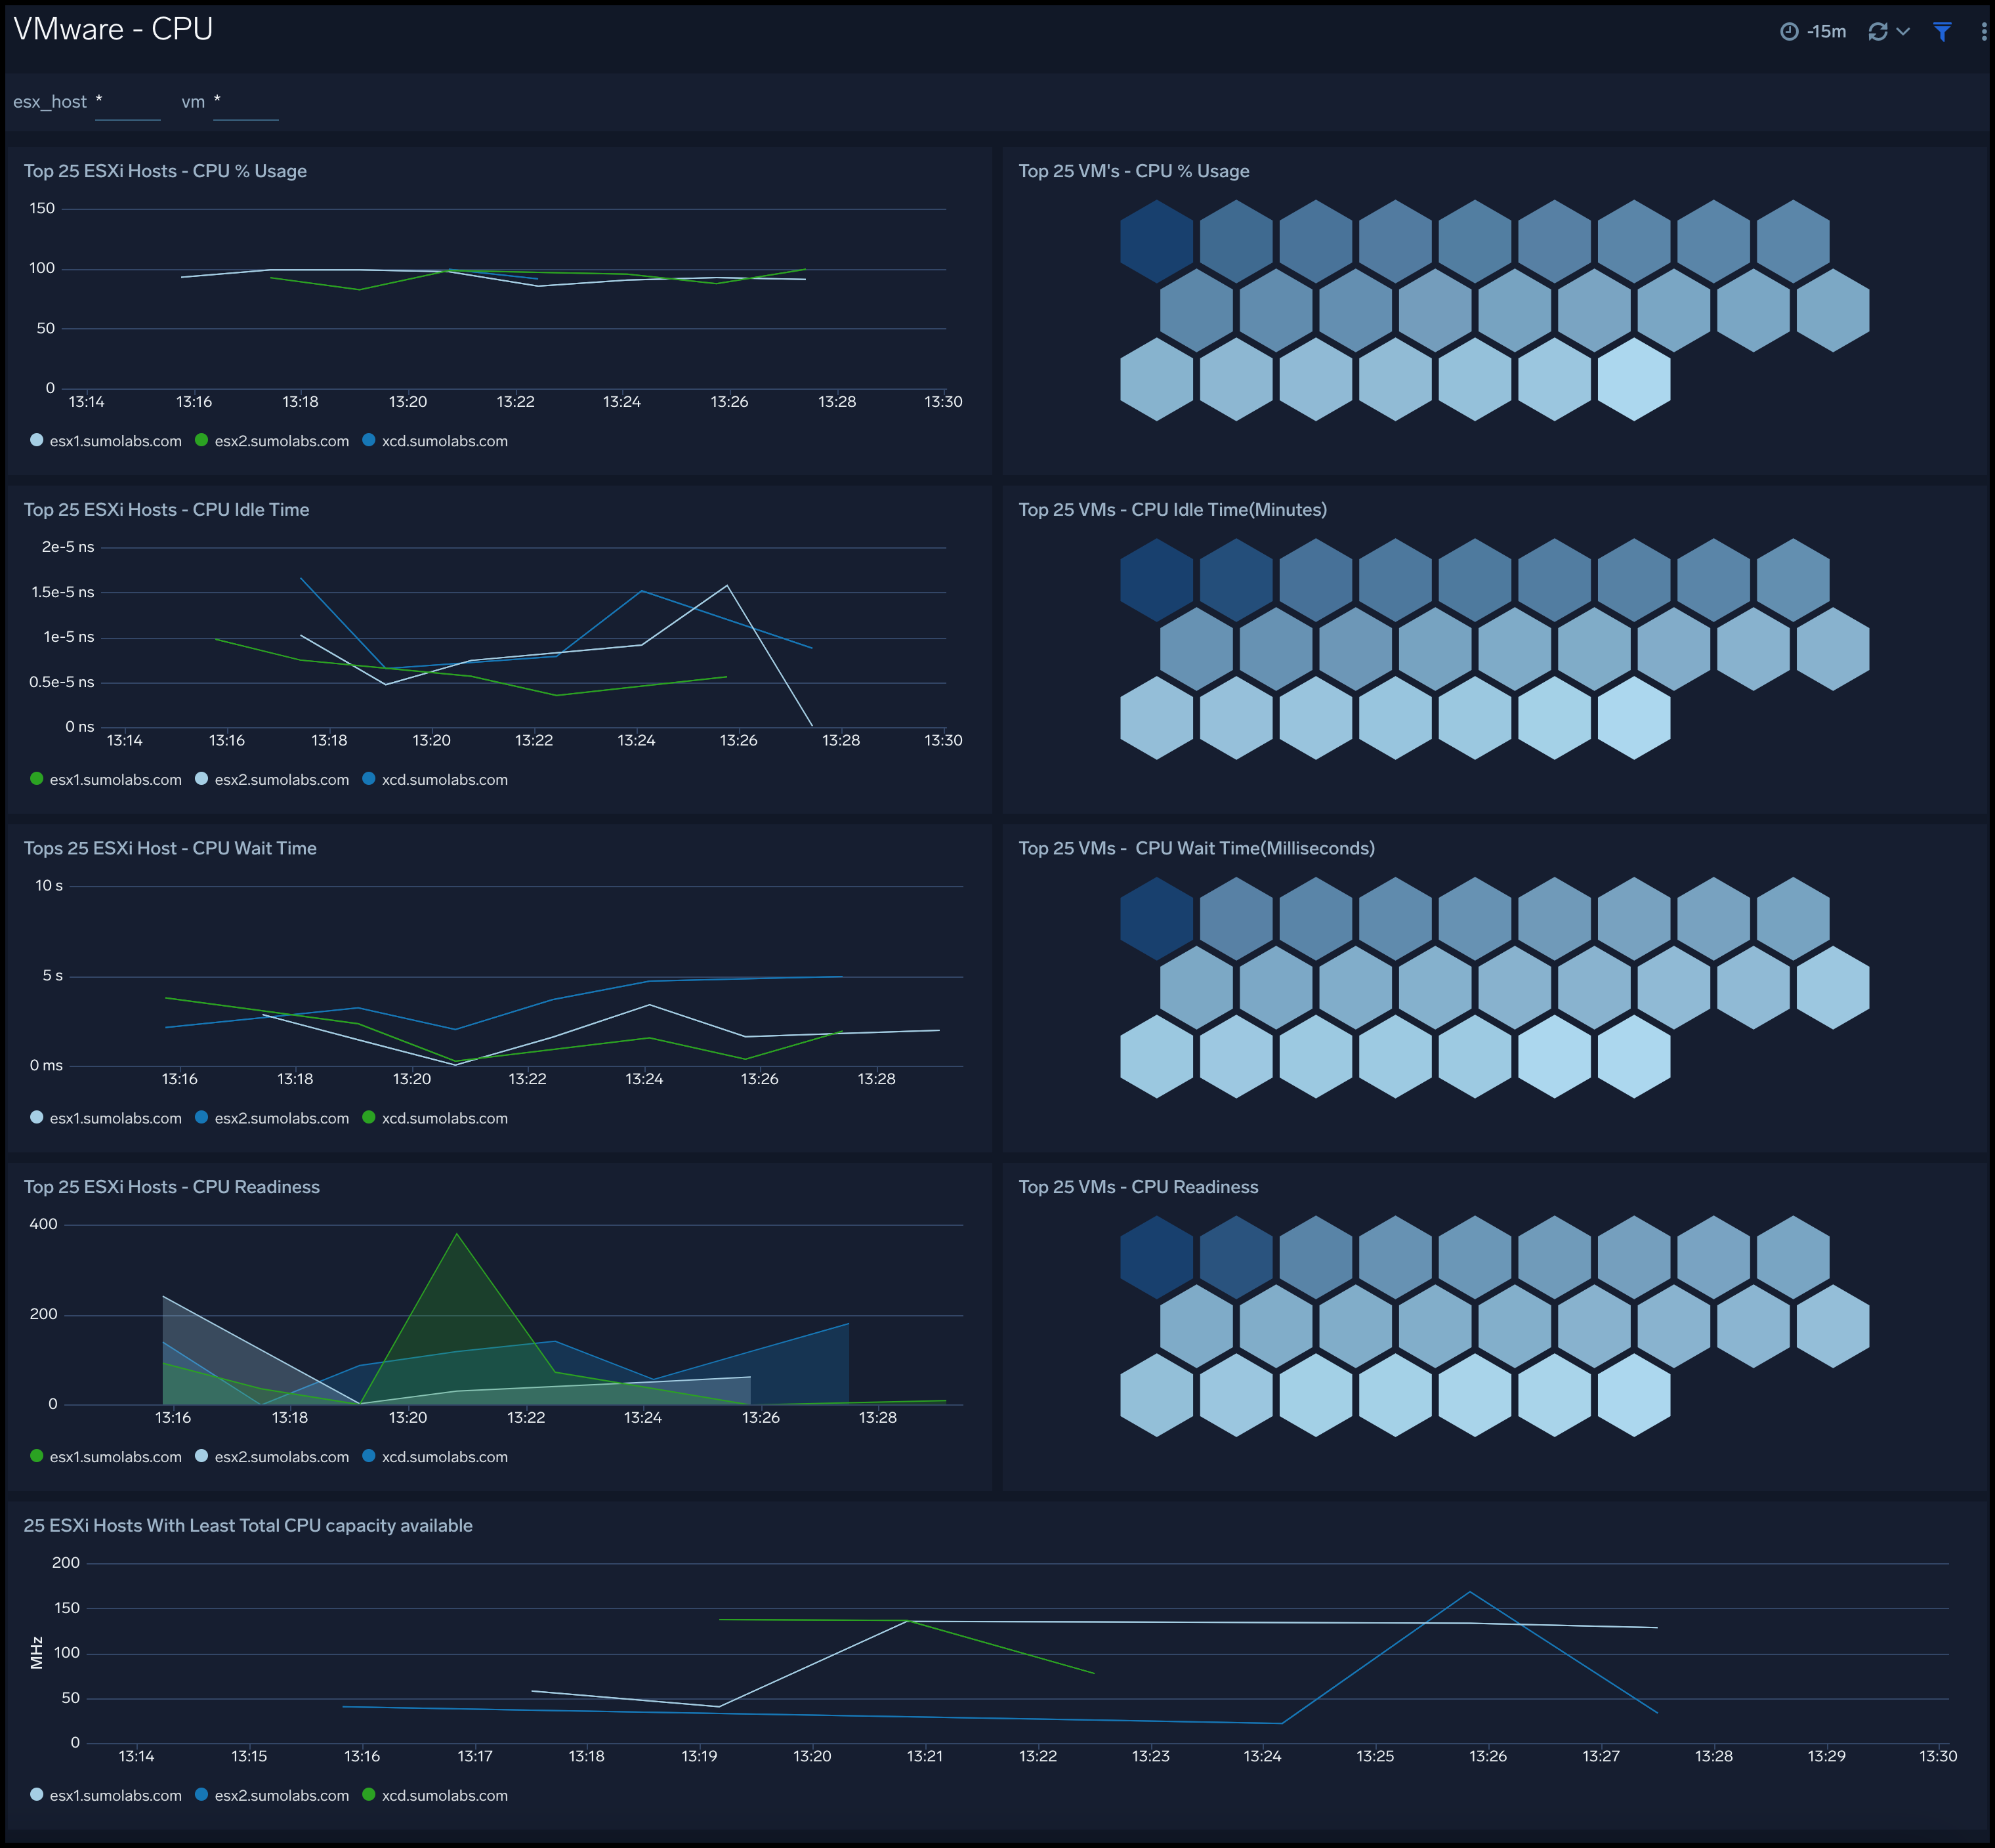
CPU
The VMware - CPU dashboard tracks the CPU consumed by the virtual machines and ESXi hosts with at-a-glance analysis of CPU usage, idle time, and VM CPU wait time.
Use this dashboard to:
- Monitor spikes in CPU activity. Frequent spikes in CPU activity for a VM without any load may signify issues with the VM configurations.
- Track CPU idle time.
- Monitor VM wait time, the time a VM was ready to perform some action but wasn't able to because of CPU unavailability. This can help determine CPU needs of the infrastructure.