Amazon GuardDuty Cloud Security Monitoring and Analytics
The focus of GuardDuty is on protecting AWS accounts, workloads, and data with intelligent threat detection. The corresponding Sumo Logic dashboards are designed to surface the most relevant security insights from that data to yield actionable processes to tackle specific security concerns within your AWS infrastructure. Utilizing this app allows you to stay ahead of changing attack surfaces in a repeatable way via cloud security monitoring and analytics dashboards that provide operational security awareness for Amazon GuardDuty data sources.
Collecting logs
See Collecting Logs for the Amazon GuardDuty App.
Installing the Amazon GuardDuty Cloud Security Monitoring and Analytics App
Now that you have set up the collection for Amazon GuardDuty, install the Sumo Logic App to use the pre-configured searches and dashboards that provide visibility into your environment for real-time analysis of overall usage.
To install the app:
- Select App Catalog.
- In the 🔎 Search Apps field, run a search for your desired app, then select it.
- Click Install App.
note
Sometimes this button says Add Integration.
- On the next configuration page, under Select Data Source for your App, complete the following fields:
- Data Source. Select one of the following options:
- Choose Source Category and select a source category from the list; or
- Choose Enter a Custom Data Filter, and enter a custom source category beginning with an underscore. For example,
_sourceCategory=MyCategory.
- Folder Name. You can retain the existing name or enter a custom name of your choice for the app.
- All Folders (optional). The default location is the Personal folder in your Library. If desired, you can choose a different location and/or click New Folder to add it to a new folder.
- Data Source. Select one of the following options:
- Click Next.
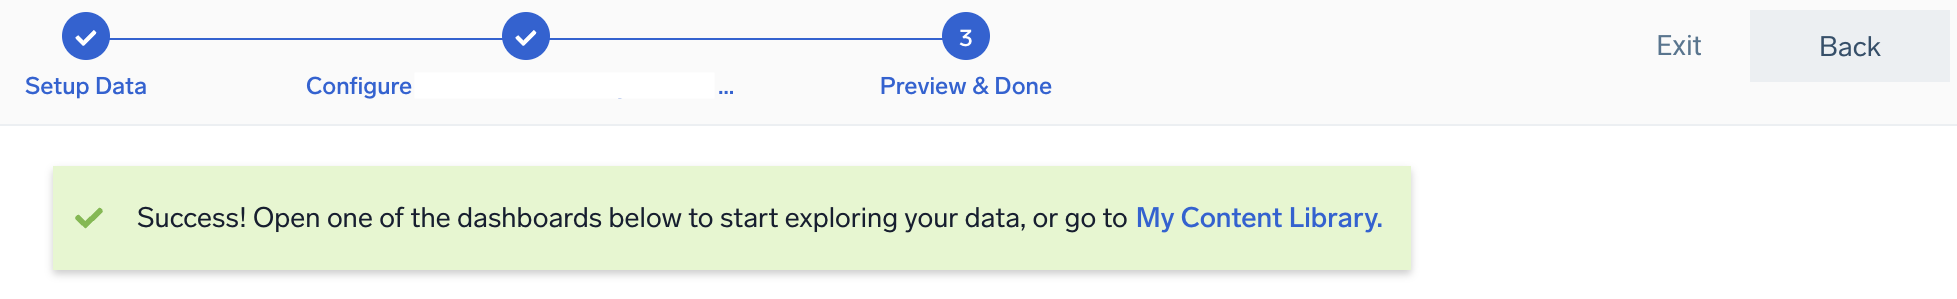
- Look for the dialog confirming that your app was installed successfully.
Post-installation
Once your app is installed, it will appear in your Personal folder or the folder that you specified. From here, you can share it with other users in your organization. Dashboard panels will automatically start to fill with data matching the time range query received since you created the panel. Results won't be available immediately, but within about 20 minutes, you'll see completed graphs and maps.
Viewing the Amazon GuardDuty Dashboards
Each dashboard has a set of filters that you can apply to the entire dashboard. Click the funnel icon in the top dashboard menu bar to display a scrollable list of filters that narrow search results across the entire dashboard.
Overview - Security Monitoring
See the overview of GuardDuty threats broken down by severity. Filters are available to limit the dashboard panels to specific account IDs, regions, and resource types.
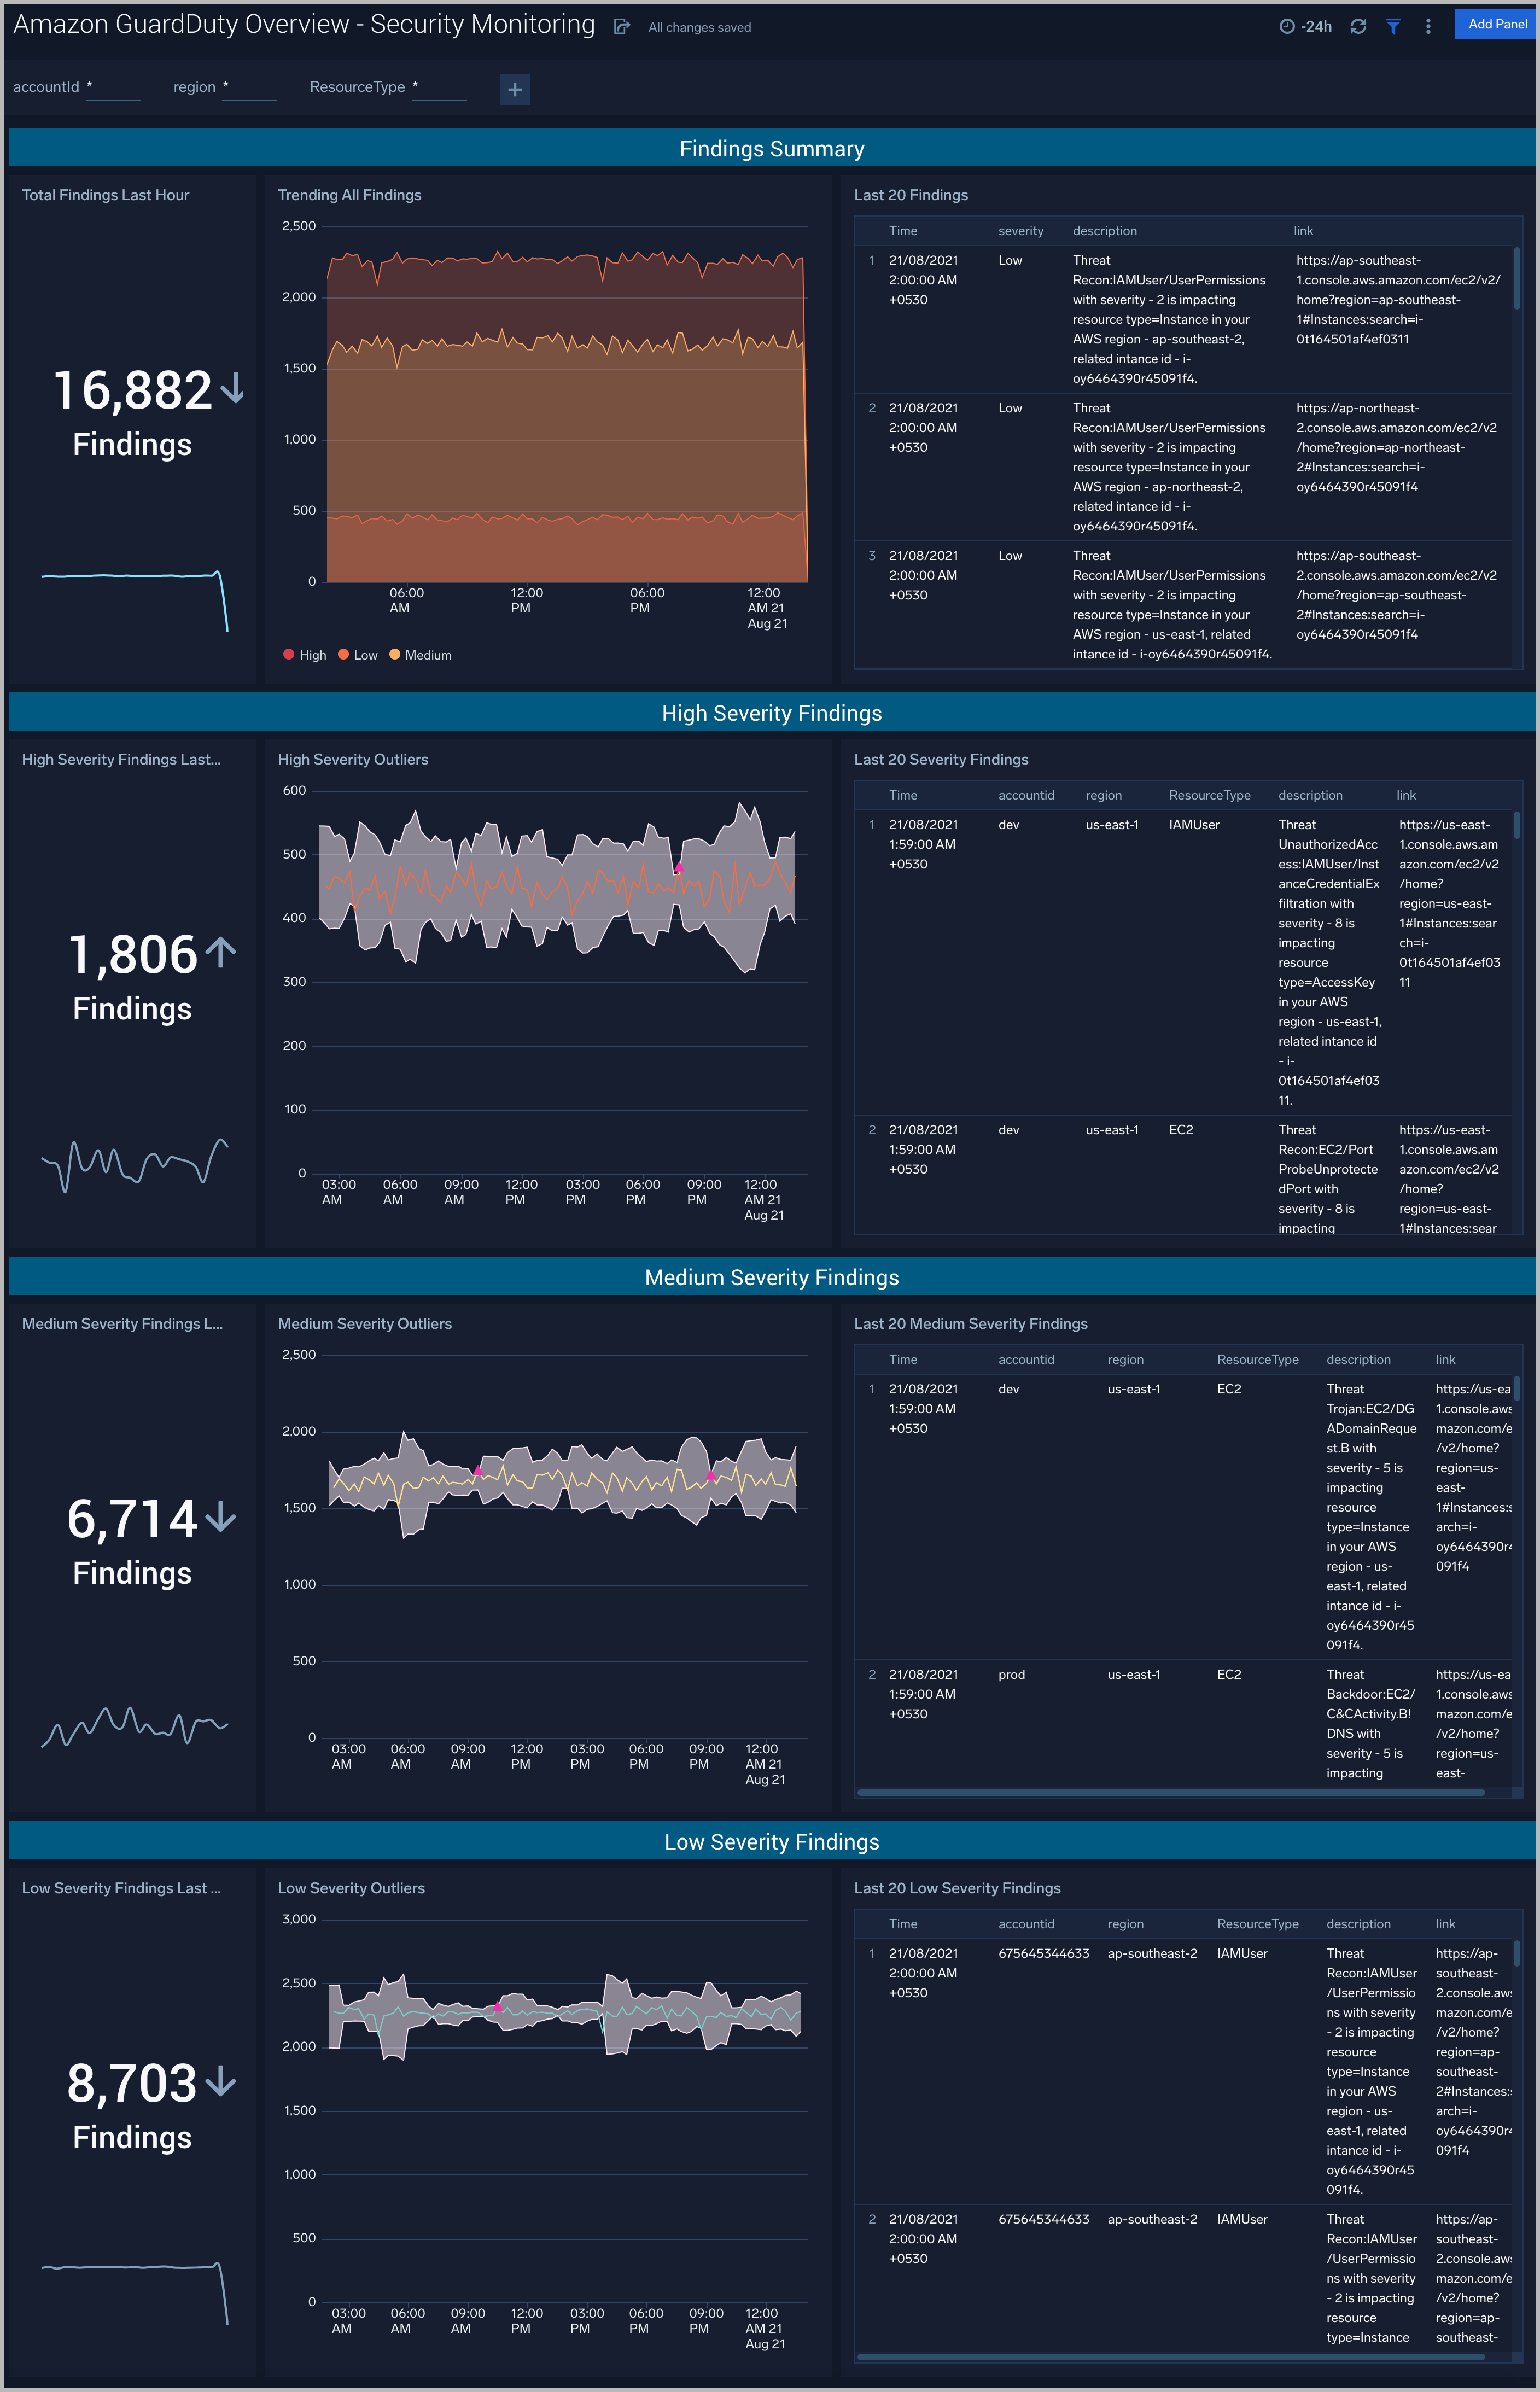
Findings Summary
Total Findings. See the count of total findings in the past hour with a sparkline showing the trending of the last 24 hours by default or the dashboard time window setting.
Trending All Findings. Line chart showing the relative volumes of findings over the last 24 hours by default or the dashboard time window setting separated by severity.
Last 20 Findings. Provides a table detailing the most recent findings.
High, Medium, Low Severity Findings
Note all panels for High, Medium, and Low Severity findings are the same. The only difference is filtering based on the listed severity level.
Severity Findings Last Hour. See the count of findings at this severity in the last hour with a sparkline showing the trending of the last 24 hours by default or the dashboard time window setting.
Severity Outliers. Review the trending volume of findings at this severity level over the last 24 hours by default or the dashboard time window setting. The gray thresholds show ranges within 4 standard deviations of the past 5 mean values. Pink triangles show values that exceed that threshold and are likely points of investigation considering the large change in volume of findings.
Last 20 Severity Findings. See the details of the last 20 findings at this severity level.
Amazon GuardDuty Analysis - Security Analytics
See the details and trending of GuardDuty findings including the severity, threat purpose, threat name , account id, region, resource type, and description. Additionally for more detailed analysis all dashboard panels can be filtered by threat purpose, threat name , severity, region, resource type, and account ID.
Details - Latest Findings. Review a table of the most recent findings. Each column can be sorted and the pagination controls at the bottom can be used to review additional findings.
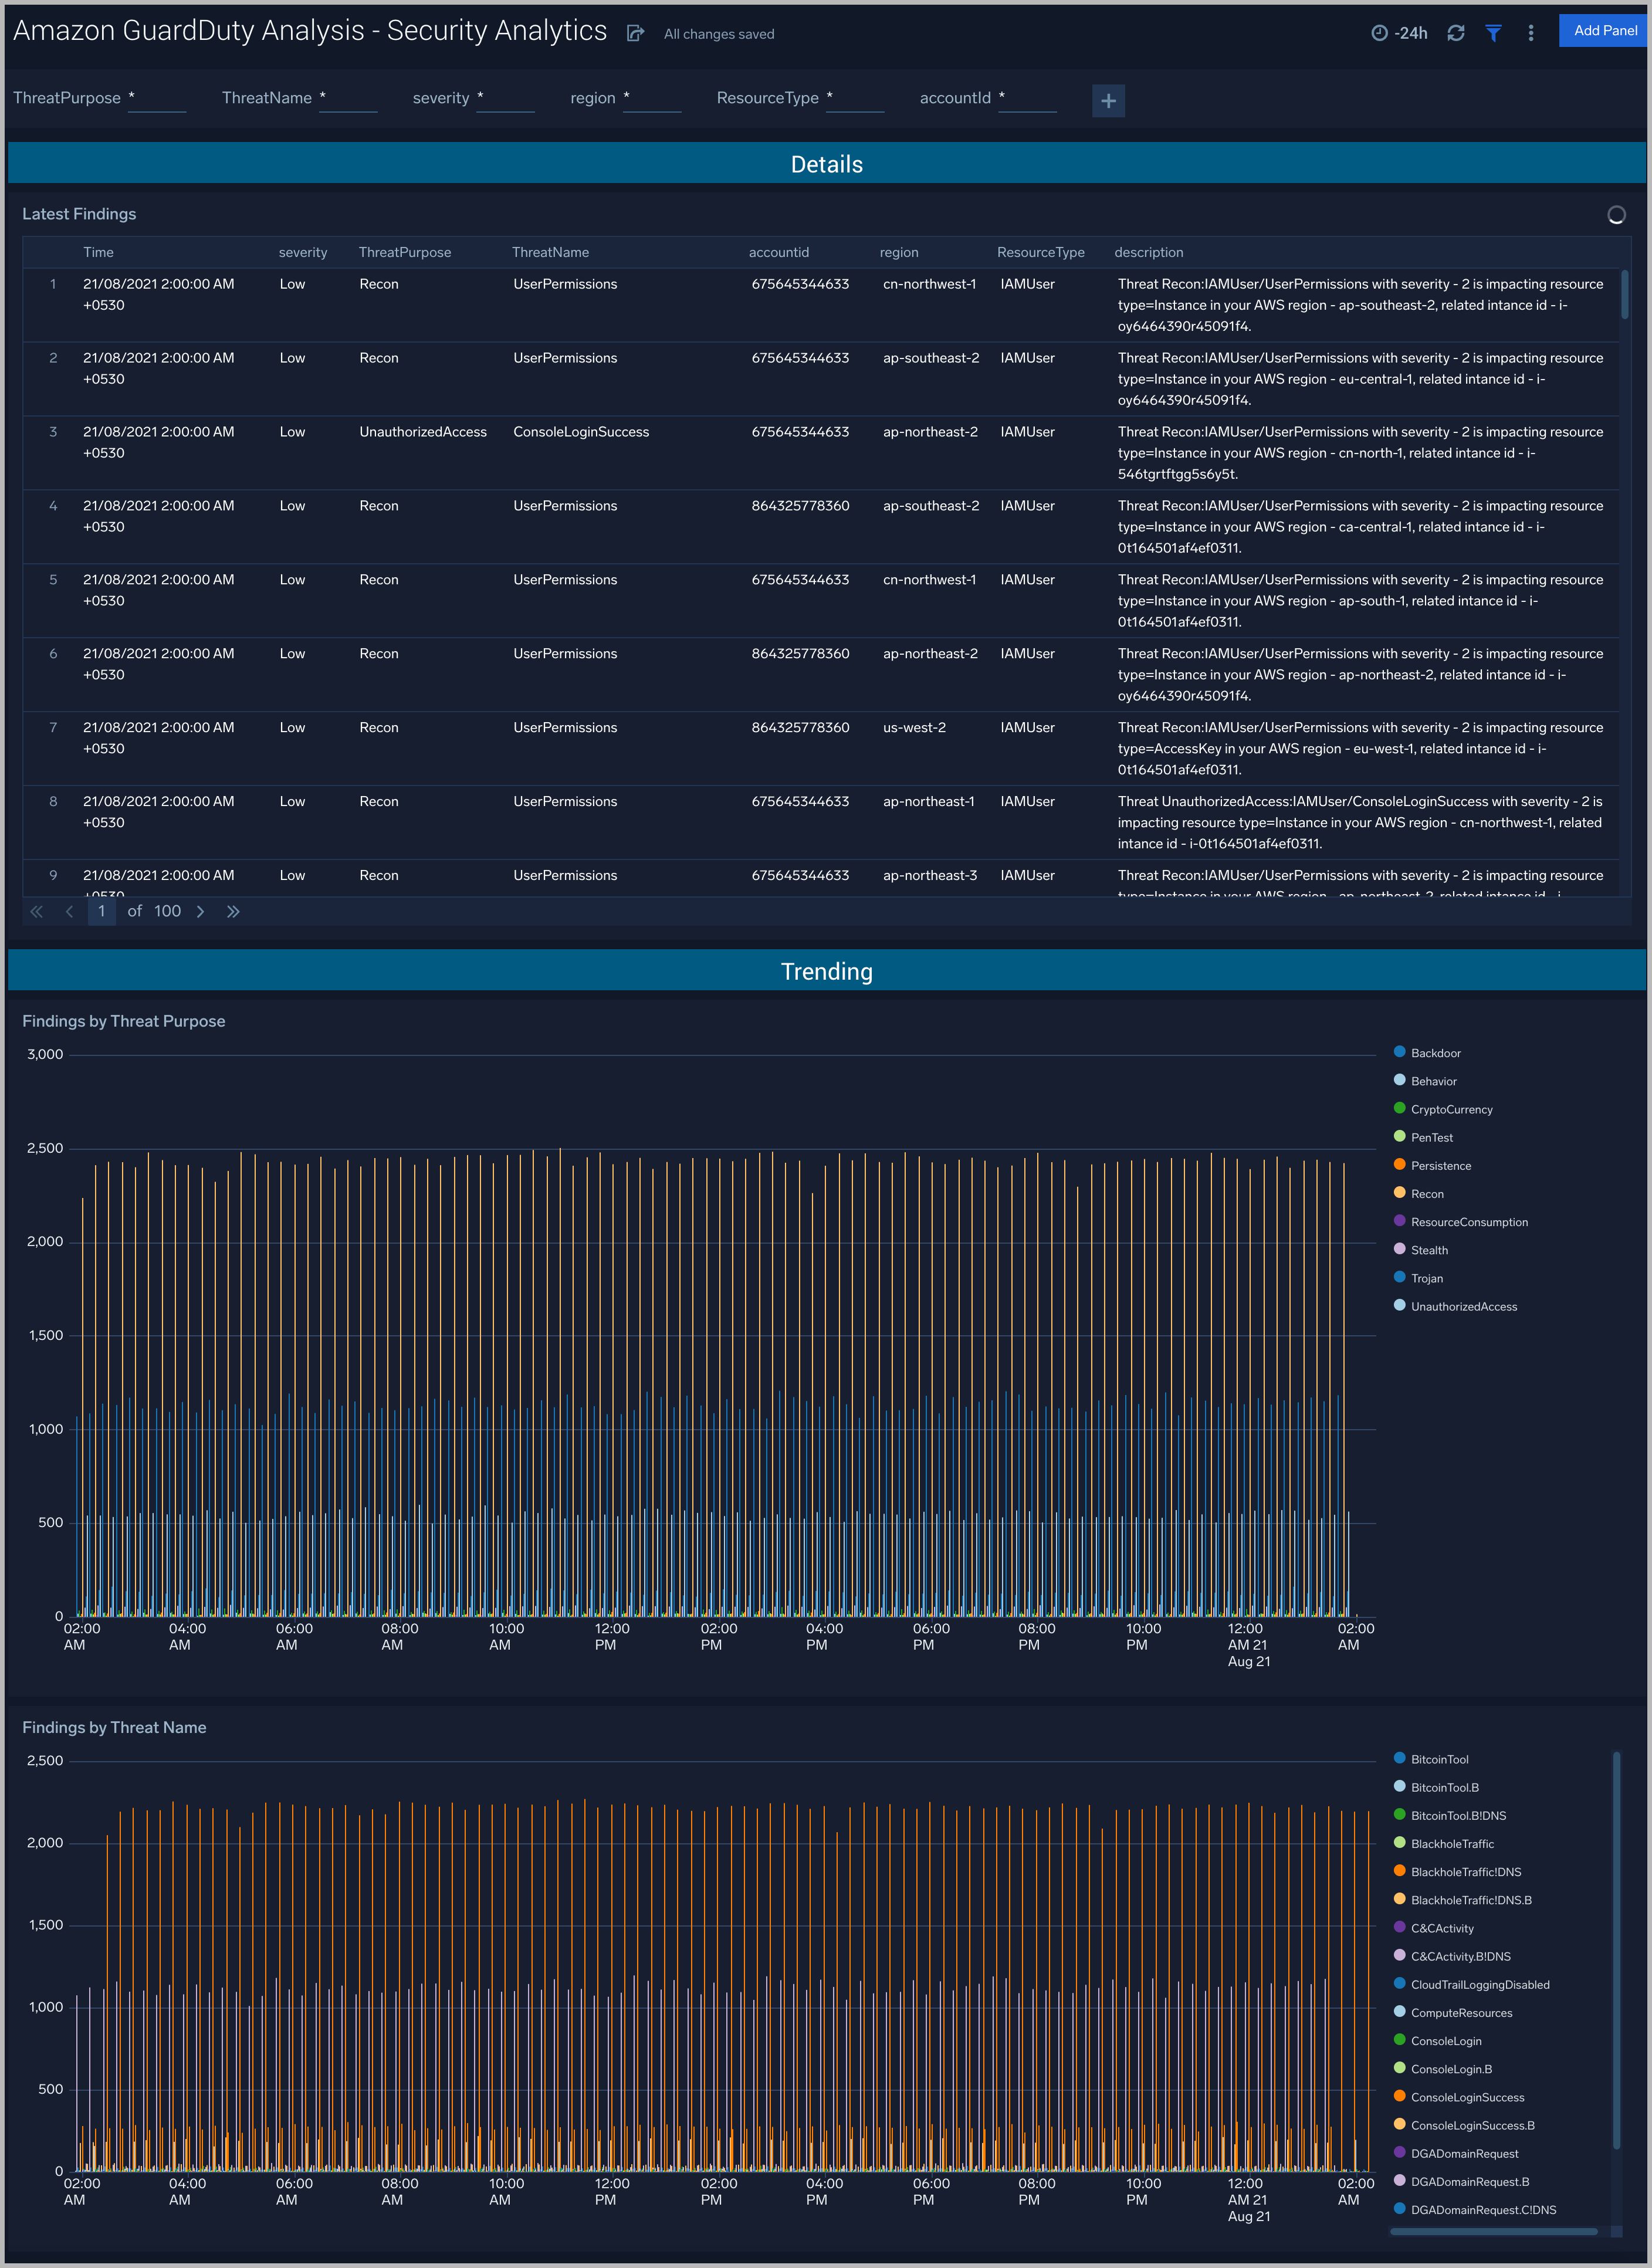
Trending
Findings by Threat Purpose. This column chart shows the relative volumes of findings broken down by threat purpose which describes the primary purpose of a threat, an attack type or a stage of a potential attack. Multiple threat purposes can be filtered by selecting one or more threat purposes from the legend on the right of the chart.
Findings by Threat Name. This column chart shows the relative volumes of findings broken down by threat name which describes the overall threat or potential malicious activity that GuardDuty is detecting. Multiple threat names can be filtered by selecting one or more threat names from the legend on the right of the chart.