AWS EC2 CW Metrics

Amazon Elastic Compute Cloud (Amazon EC2) provides scalable computing capacity in the Amazon Web Services (AWS) Cloud. You can use Amazon EC2 to launch as many or as few virtual servers as you need, configure security and networking, and manage storage.
The Sumo Logic app for AWS EC2 allows you to collect your EC2 instance metrics and display them using predefined dashboards. The app provides dashboards to display analysis of EC2 instance metrics for CPU, disk, network, EBS, Health Status Check, and EC2 CloudTrail Events. Also, it provides detailed insights into all CloudTrail audit events associated with EC2 instances and specifically helps identify changes, errors, and user activities.
Collecting CloudWatch Metrics and CloudTrail logs for AWS EC2
This section describes the AWS EC2 app's data sources and instructions for setting up a metric collection.
Metrics types
For details on the metrics of AWS EC2, see here.
Sample log messages
{
	"eventVersion":"1.08",
	"userIdentity":{
		"type":"IAMUser",
		"principalId":"AIDAJ7LGGLTBHHDFNMPSM",
		"arn":"arn:aws:iam::9XXXX34567898:user/cloudhealthuser",
		"accountId":"9XXXXXXX898",
		"accessKeyId":"AKIAXXXXXX22BUTQ",
		"userName":"cloudhealthuser"
	},
	"eventTime":"2022-06-30T08:05:38Z",
	"eventSource":"ec2.amazonaws.com",
	"eventName":"DescribeReservedInstancesListings",
	"awsRegion":"us-east-1",
	"sourceIPAddress":"177.20.215.222",
	"userAgent":"aws-sdk-ruby2/2.11.447 jruby/2.5.7 java cloudhealth",
	"errorCode":"Client.OptInRequired",
	"errorMessage":"AccountId '9XXXXXX898', You are not authorized to use the requested product. Please complete the seller registration null.",
	"requestParameters":{
		"reservedInstancesListingSet":{

		},
		"reservedInstancesSet":{

		},
		"filterSet":{

		}
	},
	"responseElements":null,
	"requestID":"fe609b44-dbc5-454b-8f72-9475d1639441",
	"eventID":"6fc6df43-1ba1-4eb3-948a-0aebc569c024",
	"readOnly":true,
	"eventType":"AwsApiCall",
	"managementEvent":true,
	"recipientAccountId":"9XXXXX7898",
	"eventCategory":"Management",
	"tlsDetails":{
		"tlsVersion":"TLSv1.2",
		"cipherSuite":"ECDHE-RSA-XXXXX-SHA",
		"clientProvidedHostHeader":"ec2.us-west-1.amazonaws.com"
	}
}
Sample queries
account=* region=* namespace=aws/ec2 instanceid=* metric=CPUUtilization Statistic=average | avg
account={{account}} region={{region}} namespace={{namespace}} eventname eventsource "ec2.amazonaws.com" errorCode
| json "eventSource", "awsRegion", "requestParameters", "responseElements", "recipientAccountId" as event_source, region, requestParameters, responseElements, accountid nodrop
| json "userIdentity", "eventName", "sourceIPAddress", "userAgent", "eventType", "requestID", "errorCode", "errorMessage", "eventCategory", "managementEvent" as userIdentity, event_name, src_ip, user_agent, event_type, request_id, error_code, error_message, event_category, management_event nodrop
| where event_source = "ec2.amazonaws.com"
| "aws/ec2" as namespace
| json field=userIdentity "type", "principalId", "arn", "userName", "accountId" nodrop
| json field=userIdentity "sessionContext.attributes.mfaAuthenticated" as mfaAuthenticated nodrop
| parse field=arn ":assumed-role/*" as user nodrop
| parse field=arn "arn:aws:iam::*:*" as accountId, user nodrop
| json field=requestParameters "instanceType", "instancesSet", "instanceId", "DescribeInstanceCreditSpecificationsRequest.InstanceId.content" as req_instancetype, req_instancesSet, req_instanceid_1, req_instanceid_2 nodrop
| json field=req_instancesSet "item", "items" as req_instancesSet_item, req_instancesSet_items nodrop
| parse regex field=req_instancesSet_item "\"instanceId\":\s*\"(?<req_instanceid_3>.*?)\"" nodrop
| parse regex field=req_instancesSet_items "\"instanceId\":\s*\"(?<req_instanceid_4>.*?)\"" nodrop
| json field=responseElements "instancesSet.items" as res_responseElements_items nodrop
| parse regex field=res_responseElements_items "\"instanceType\":\s*\"(?<res_instanceType>.*?)\"" nodrop
| parse regex field=res_responseElements_items "\"instanceId\":\s*\"(?<res_instanceid>.*?)\"" nodrop
| if (!isBlank(req_instanceid_1), req_instanceid_1,  if (!isBlank(req_instanceid_2), req_instanceid_2, if (!isBlank(req_instanceid_3), req_instanceid_3, if (!isBlank(req_instanceid_4), req_instanceid_4, "")))) as req_instanceid
| if (!isBlank(req_instanceid), req_instanceid, res_instanceid) as instanceid
| if (!isBlank(req_instancetype), req_instancetype, res_instancetype) as instanceType
| if (isEmpty(error_code), "Success", "Failure") as event_status
| if (isEmpty(userName), user, userName) as user
| tolowercase(instanceid) as instanceid
| count as count by error_code | sort by count, error_code asc | limit 10
AWS EC2 CloudWatch Metrics
AWS EC2 automatically monitors functions on your behalf, reporting AWS EC2 metrics through Amazon CloudWatch. These metrics are collected by our Hosted Collector by configuring the Amazon CloudWatch source.
The Sumo Logic app for AWS EC2 (CloudWatch Metrics) allows you to collect your EC2 instance metrics and display them using predefined dashboards. The app provides dashboards to analyze EC2 instance metrics for CPU, disk, network, EBS, and Health Status Check.
CloudTrail EC2 Data Events
CloudTrail EC2 Data Events allow you to continuously monitor the execution activity of your EC2 instance and record details of all the related events.
Collect Amazon CloudWatch EC2 Metrics
Sumo Logic supports collecting metrics using two source types:
- Configure an AWS Kinesis Firehose for Metrics Source (recommended) or
- Configure an Amazon CloudWatch Source for Metrics
Namespace for Amazon EC2 Service is AWS/EC2.
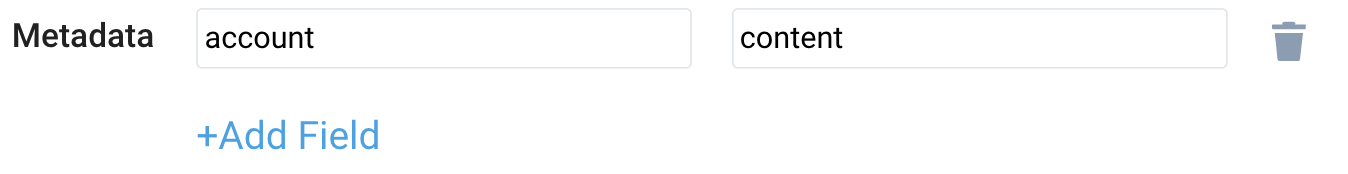
- Metadata: Add an account field to the source and assign it a value which is a friendly name / alias to your AWS account from which you are collecting metrics. Metrics can be queried through the account field.
Collect CloudTrail EC2 Data Events
To configure a CloudTrail Source, perform these steps:
- Grant Sumo Logic access to an Amazon S3 bucket.
- Configure DataEvents with CloudTrail in your AWS account.
- Confirm that logs are being delivered to the Amazon S3 bucket.
- Add an AWS CloudTrail Source to Sumo Logic.
- Name. Enter a name to display the new Source.
- Description. You may skip the description as it's optional.
- S3 Region. Select the Amazon Region for your API Gateway S3 bucket.
- Bucket Name. Enter the exact name of your API Gateway S3 bucket.
- Path Expression. Enter the string that matches the S3 objects you'd like to collect. You can use a wildcard
*in this string.
noteDO NOT use a leading forward slash. See Amazon Path Expressions. The S3 bucket name is not part of the path. Don’t include the S3 bucket name when you are setting the Path Expression.
- Source Category. Enter
aws/observability/cloud trail/logs. - Fields. Add an account field and assign it a value that is a friendly name/alias to your AWS account from which you are collecting logs. Logs can be queried through the account field.

- Access Key ID and Secret Access Key. Enter your Access Key ID and Secret Access Key. Learn how to use Role-based access to AWS here.
- Log File Discovery -> Scan Interval. Use the default of 5 minutes. Alternately, enter the frequency. Sumo Logic will scan your S3 bucket for new data. Learn how to configure Log File Discovery here.
- Enable Timestamp Parsing. Select the Extract timestamp information from log file entries check box.
- Time Zone. Select Ignore time zone from the log file and instead use, and select UTC from the dropdown.
- Timestamp Format. Select Automatically detect the format.
- Enable Multiline Processing. Select the Detect messages spanning multiple lines check box, and select Infer Boundaries.
- Click Save.
Field in Field Schema
- In the main Sumo Logic menu, select Manage Data > Logs > Fields.
- Search for the “instanceid” field.
- If not present, create it. Learn how to create and manage fields here.
CloudTrail Field Extraction Rule
Rule Name: AwsObservabilityEC2CloudTrailLogsFER
Applied at: Ingest Time
Scope (Specific Data): account=* eventname eventsource "ec2.amazonaws.com"
Parse Expression
| json "eventSource", "awsRegion", "requestParameters", "responseElements", "recipientAccountId" as eventSource, region, requestParameters, responseElements, accountid nodrop
| where eventSource = "ec2.amazonaws.com"
| "aws/ec2" as namespace
| json field=requestParameters "instanceType", "instancesSet", "instanceId", "DescribeInstanceCreditSpecificationsRequest.InstanceId.content" as req_instancetype, req_instancesSet, req_instanceid_1, req_instanceid_2 nodrop
| json field=req_instancesSet "item", "items" as req_instancesSet_item, req_instancesSet_items nodrop
| parse regex field=req_instancesSet_item "\"instanceId\":\s*\"(?<req_instanceid_3>.*?)\"" nodrop
| parse regex field=req_instancesSet_items "\"instanceId\":\s*\"(?<req_instanceid_4>.*?)\"" nodrop
| json field=responseElements "instancesSet.items" as res_responseElements_items nodrop
| parse regex field=res_responseElements_items "\"instanceType\":\s*\"(?<res_instanceType>.*?)\"" nodrop
| parse regex field=res_responseElements_items "\"instanceId\":\s*\"(?<res_instanceid>.*?)\"" nodrop
| if (!isBlank(req_instanceid_1), req_instanceid_1,  if (!isBlank(req_instanceid_2), req_instanceid_2, if (!isBlank(req_instanceid_3), req_instanceid_3, if (!isBlank(req_instanceid_4), req_instanceid_4, "")))) as req_instanceid
| if (!isBlank(req_instanceid), req_instanceid, res_instanceid) as instanceid
| if (!isBlank(req_instancetype), req_instancetype, res_instancetype) as instanceType
| tolowercase(instanceid) as instanceid
| fields region, namespace, accountid, instanceid
Centralized AWS CloudTrail log collection
If you have a centralized collection of CloudTrail logs and are ingesting them from all accounts into a single Sumo Logic CloudTrail log source, create following Field Extraction Rule to map proper AWS account(s) friendly name / alias. Create it if not already present / update it as required.
Rule Name: AWS Accounts
Applied at: Ingest Time
Scope (Specific Data): _sourceCategory=<SourceCategory_of_CloudTrail_source_created_in_sumo>
Parse Expression
Enter a parse expression to create an “account” field that maps to the alias you set for each sub account. For example, if you used the “dev” alias for an AWS account with ID "528560886094" and the “prod” alias for an AWS account with ID "567680881046", your parse expression would look like:
| json "recipientAccountId"
// Manually map your aws account id with the AWS account alias you setup earlier for individual child account
| "" as account
| if (recipientAccountId = "528560886094",  "dev", account) as account
| if (recipientAccountId = "567680881046",  "prod", account) as account
| fields account
Installing the AWS EC2 app
Now that you have set up collection for AWS EC2 metrics install the Sumo Logic app to use the pre-configured searches and dashboards that provide visibility into your environment for real-time analysis of overall usage.
To install the app:
- Select App Catalog.
- In the 🔎 Search Apps field, run a search for your desired app, then select it.
- Click Install App.
note
Sometimes this button says Add Integration.
- On the next configuration page, under Select Data Source for your App, complete the following fields:
- Data Source. Select one of the following options:
- Choose Source Category and select a source category from the list; or
- Choose Enter a Custom Data Filter, and enter a custom source category beginning with an underscore. For example,
_sourceCategory=MyCategory.
- Folder Name. You can retain the existing name or enter a custom name of your choice for the app.
- All Folders (optional). The default location is the Personal folder in your Library. If desired, you can choose a different location and/or click New Folder to add it to a new folder.
- Data Source. Select one of the following options:
- Click Next.
- Look for the dialog confirming that your app was installed successfully.
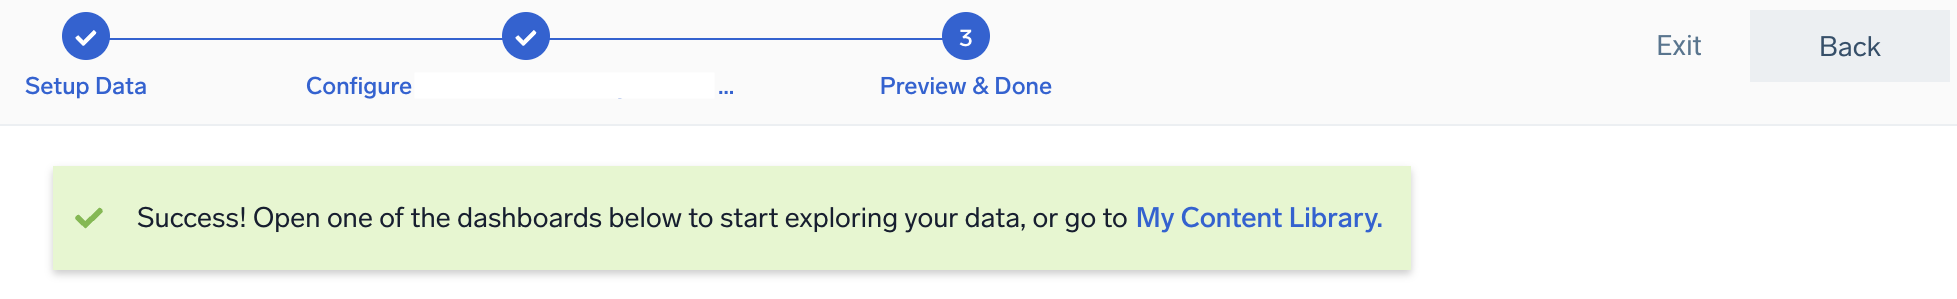
Post-installation
Once your app is installed, it will appear in your Personal folder or the folder that you specified. From here, you can share it with other users in your organization. Dashboard panels will automatically start to fill with data matching the time range query received since you created the panel. Results won't be available immediately, but within about 20 minutes, you'll see completed graphs and maps.
Viewing AWS EC2 dashboards
Overview (CloudWatch Metrics)
The AWS EC2 Overview (CloudWatch Metrics) dashboard provides at-a-glance information about a EC2 CPU, instance disk store, network and EBS volume usage along with EC2 instance health status.
Use this dashboard to:
- Monitor average CPU utilization and dedicated host CPU utilization, along with instances with High and Low CPU utilization
- Monitor CPU credit Usage,Balance,Surplus Credit Charge,Surplus Credit balance
- EBS related metrics like IO Balance, Byte Balance, Read/Write - bytes,ops
- Identify count of Status checks
- Observe all relevant metrics for CPU, Internal Disk Store, Network utilization per instance type

Summary (CloudWatch Metrics)
The AWS EC2 Summary (CloudWatch Metrics) dashboard provides at-a-glance information about a EC2 CPU, instance disk store, network and EBS volume usage along with EC2 instance health status.
Use this dashboard to:
- Monitor CPU utilization along with CPU credit details & status check counts for EC2
- EBS related metrics for EC2 instance
- Observe Instance Disk Store (Disk Read/Write - Bytes & ops) for EC2 instance.
- Monitor Network usage metrics (Network in/out - Byes & packets) for EC2 instance

Events
The AWS EC2 - Events (CloudTrail) dashboard provides detailed insights into all CloudTrail audit events associated with EC2 instances and specifically helps identify changes, errors, and user activities.
Use this dashboard to:
- Monitor the geo location for successful and failed events
- Observed the event status and top error codes
- Track distribution and top event types and trends
- Monitor top IAM Users, Assumed Role Users, and User agents
- Monitor distribution of Successful and failed events with the list of latest events.

CPU (CloudWatch Metrics)
The AWS EC2 CPU (CloudWatch Metrics) dashboard provides detailed information about EC2 CPU usage like CPU utilization and CPU credits for burstable performance instances.
Use this dashboard to:
- Monitor Average CPU utilization over time for EC2.
- Observe CPU Credits metrics (Usage and balance) over time.
- Identify CPU Surplus Credits (Charged and Balance) over time.

EBS (CloudWatch Metrics)
The AWS EC2 EBS (CloudWatch Metrics) dashboard provides detailed information about EC2 EBS volumes for Nitro-based instances based on EBS volumes read and write bytes, operations, and information on the percentage of I/O and throughput credits remaining in the burst bucket.
Use this dashboard to:
- Monitor EBS volumes read and write bytes over time
- Monitor EBS read and write ops over time
- EBS IO balance and Byte Balance % metric over time for Ec2 instances.

Disk (CloudWatch Metrics)
The AWS EC2 Disk (CloudWatch Metrics) dashboard provides detailed information about a EC2 Instance Store Disk usage based on disk read and write bytes, operations.
Use this dashboard to:
- Monitor instance store - Disk metrics like Disk read/write Bytes and Byte rate
- Monitor instance store - Disk netrucs like Disk read/write Operations and Operation rate.

Network (CloudWatch Metrics)
The AWS EC2 Network (CloudWatch Metrics) dashboard provides detailed information about EC2 Network activities based on In and out packets, bytes.
Use this dashboard to:
- Monitor imported network metrics like - Byte rate for input and out put and Bytes going in and out of Ec2 instances
- Observe network metrics for Ec2 for packet in/out and rate of the packets.

Status Check (CloudWatch Metrics)
The AWS EC2 Status Check (CloudWatch Metrics) dashboard provides detailed information about an EC2 instance's health check status based on an instance, system, and overall health status.
Use this dashboard to:
- Monitor status check for instances
- Monitor if the instance has passed the status check at last minute
- Monitor if an instance has passed the system status check at last minute
