Airtable
The Airtable App for Sumo Logic monitors and analyzes your organization's Airtable audit logs, providing insights into user activity, data trends, and security events. This app is based on the Airtable Audit Logs, which provide detailed information on all actions performed in your Airtable account.
The Airtable App makes it simple to import data from your Airtable audit logs into Sumo Logic, where you can perform real-time analysis and build dashboards to visualize key metrics. You can monitor security events and gain insights into user activity across your organization.
The Airtable App allows you to:
- Keep track of user activity within your Airtable account in real-time.
- Analyze user actions, identify failed executions, and track trends over time.
- View a summary of audit logs in table format, enabling you to identify anomalous behavior and potential security threats.
- Create customized dashboards to visualize important metrics and track key performance indicators.
The Airtable App also offers a pre-built dashboard that enables you to start monitoring your Airtable audit logs right away. The Airtable App for Sumo Logic is especially useful for organizations that must comply with regulatory requirements or maintain a high level of security. With the ability to monitor user activity and track changes in real time, you can quickly identify potential issues and respond to security incidents as they occur.
Log type
The Sumo Logic app for Airtable consumes Audit logs from your Airtable Enterprise account. Audit Logs track user activity and record changes made to the data in the system.
To understand how to access detailed records of changes made to the Airtable Enterprise account, refer to the Airtable Audit logs documentation. This documentation provides information on the different types of logs that are available, how to access them, and what information they contain.
Sample log messages
{
  "enterpriseaccountid": "entdfgc0BXGp",
  "originatinguserid": "usrcdagdfQ1B",
  "apiname": "PUBLIC_API",
  "apiversion": "0.1",
  "actionid": "acfdgdfCht9zR",
  "client": {
    "ipaddress": "100.108.203.58"
  },
  "context": {
    "workspaceid": null,
    "applicationid": null,
    "tableid": null
  },
  "request": {
    "requestid": "reqesfgstSbadd",
    "starttime": "2023-01-18T10:26:45.281Z",
    "modelclassname": "enterpriseAccount",
    "modelid": "entmDsrgfc0BXGp",
    "action": "getEnterpriseAuditLog",
    "parametersjson": "{\"enterpriseAuditLogTaskId\":\"ealtossregfCp47\"}"
  },
  "response": {
    "success": true,
    "message": null
  }
}
Sample queries
_sourceCategory="Labs/airtable"
| Json "enterprise_account_id", "originating_user_id", "api_name", "api_version", "action_id", "client.ipaddress", "request.requestid", "request.starttime", "request.modelclassname", "request.modelid", "request.action", "response.success" as enterprise_account_id, originating_user_id, api_name, api_version, action_id, ipaddress, requestid, starttime, modelclassname, modelid, action, success nodrop
| where api_name matches "{{api}}" or isNull(api_name)
| where modelclassname matches "{{model}}" or isNull(modelclassname)
| where action matches "{{action}}" or isNull(action)
| count_distinct (action_id)
Installing the Airtable app
Before you begin, collect logs from Airtable API and ingest them into Sumo Logic. Refer to the Airtable API Cloud-to-Cloud Integration to create the source and use the same source category while installing the app.
To install the app, do the following:
- Select App Catalog.
- In the 🔎 Search Apps field, run a search for your desired app, then select it.
- Click Install App.
note
Sometimes this button says Add Integration.
- Click Next in the Setup Data section.
- In the Configure section of your respective app, complete the following fields.
- Key. Select either of these options for the data source.
- Choose Source Category and select a source category from the list for Default Value.
- Choose Custom, and enter a custom metadata field. Insert its value in Default Value.
- Key. Select either of these options for the data source.
- Click Next. You will be redirected to the Preview & Done section.
Post-installation
Once your app is installed, it will appear in your Installed Apps folder, and dashboard panels will start to fill automatically.
Each panel slowly fills with data matching the time range query and received since the panel was created. Results will not immediately be available, but will update with full graphs and charts over time.
Upgrading the Airtable app (Optional)
To update the app, do the following:
- Select App Catalog.
- In the Search Apps field, search for and then select your app.
Optionally, you can identify apps that can be upgraded in the Upgrade available section. - To upgrade the app, click Upgrade.
- If the upgrade does not have any configuration or property changes, you will be redirected to the Preview & Done section.
- If the upgrade has any configuration or property changes, you will be redirected to Setup Data page.
- In the Configure section of your respective app, complete the following fields.
- Key. Select either of these options for the data source.
- Choose Source Category and select a source category from the list for Default Value.
- Choose Custom and enter a custom metadata field. Insert its value in Default Value.
- Key. Select either of these options for the data source.
- Click Next. You will be redirected to the Preview & Done section.
- In the Configure section of your respective app, complete the following fields.
Post-update
Your upgraded app will be installed in the Installed Apps folder, and dashboard panels will start to fill automatically.
See our Release Notes changelog for new updates in the app.
Uninstalling the Airtable app (Optional)
To uninstall the app, do the following:
- Select App Catalog.
- In the 🔎 Search Apps field, run a search for your desired app, then select it.
- Click Uninstall.
Viewing Airtable dashboards
All dashboards have a set of filters that you can apply to the entire dashboard. Use these filters to drill down and examine the data to a granular level.
- You can change the time range for a dashboard or panel by selecting a predefined interval from a drop-down list, choosing a recently used time range, or specifying custom dates and times. Learn more.
- You can use template variables to drill down and examine the data on a granular level. For more information, see Filter with template variables.
- Most Next-Gen apps allow you to provide the scope at the installation time and are comprised of a key (
_sourceCategoryby default) and a default value for this key. Based on your input, the app dashboards will be parameterized with a dashboard variable, allowing you to change the dataset queried by all panels. This eliminates the need to create multiple copies of the same dashboard with different queries.
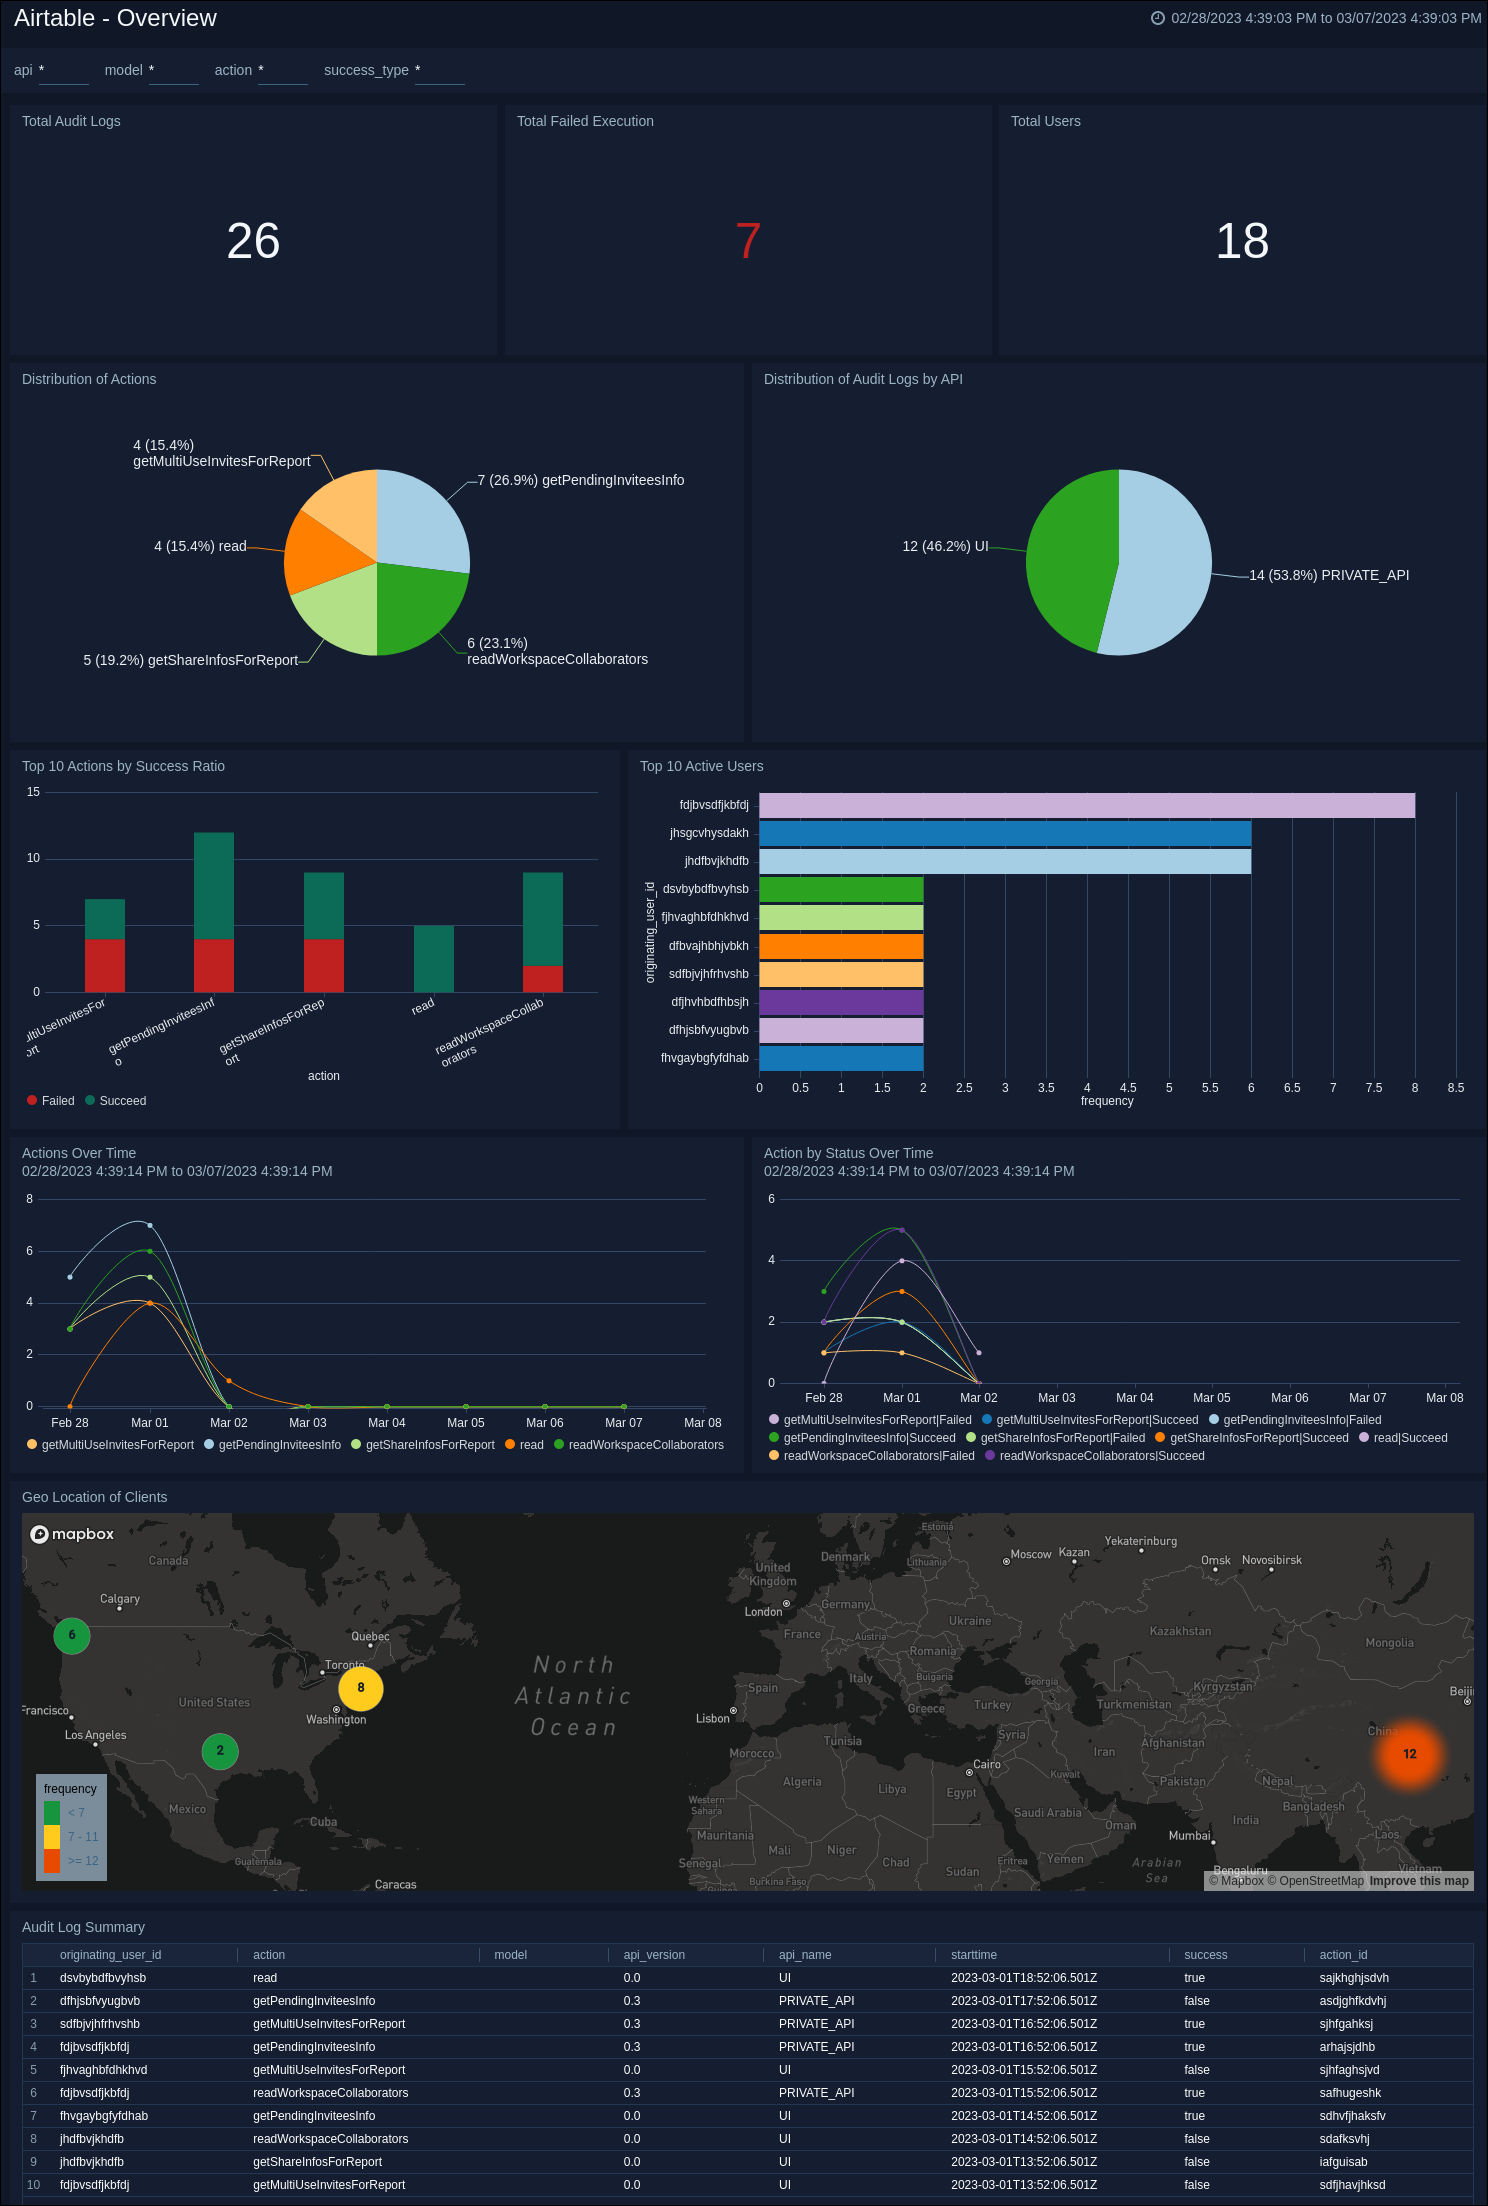
Overview
Airtable - Overview dashboard provides a high-level view of key metrics related to Airtable platform user activity, audits, and execution. It contains widgets that display data such as total audit logs and failed executions, action distribution, and top-performing actions and users. The dashboard also provides information on activity trends over time and user locations. The Audit Log Summary widget provides a quick overview of all platform activity. Overall, the dashboard helps users quickly understand how the platform is used and identify areas for improvement.