Druva
The Druva app for Sumo Logic enables real-time monitoring and security insight for your Druva account. This app provides critical event alerts and visibility into user activities, device and app usage, and backup and restore events. With this level of visibility, security teams can quickly detect and respond to potential security incidents. The Druva app for Sumo Logic is an essential tool for organizations looking to enhance their security operations.
The Druva app for Sumo Logic leverages Sumo Logic's cloud-to-cloud Druva source to collect and analyze data from your Druva account. This app delivers granular insights into user activity, alerts, and backup status, enabling organizations to promptly identify and respond to potential security incidents.
The Druva app offers the following capabilities:
- Monitor user activity and identify any unauthorized access to sensitive data.
- Detect and mitigate potential ransomware attacks.
- Ensure compliance with regulatory mandates.
- Monitor endpoint security and identify potential threats.
- Orchestrate incident response workflows by integrating with other security tools.
The Sumo Logic Druva app is a powerful tool for monitoring and protecting your data backups and archives. Organizations may gain important insights into their data security posture and respond quickly and efficiently to possible security events by leveraging Sumo Logic's Events API and advanced analytics capabilities.
Log types
The Druva app utilizes Sumo Logic's Druva Source to gather Audit Events from Druva. For more information on the fields of inSync events, refer to the inSync events fields documentation.
Sample log messages
{
   "eventID": 1203589860,
   "eventType": "Backup",
   "profileName": "Default",
   "inSyncUserName": "Adele Vance",
   "clientVersion": "7.2.0r(e67f3e32)",
   "clientOS": "Office 365 OneDrive",
   "ip": "209.142.167.255",
   "inSyncUserEmail": "adelev@druvaarena.onmicrosoft.com",
   "eventDetails": "Total Backup Size:0, Files Backed up:0, Files Missed:0, System and App Settings:Yes, Total Bytes Transferred:0, eventsGroupId:39583905",
   "timestamp": "2023-03-09T17:48:43Z",
   "inSyncUserID": 4660543,
   "profileID": 44426,
   "initiator": null,
   "inSyncDataSourceID": 6706405,
   "eventState": "Success",
   "inSyncDataSourceName": "OneDrive",
   "severity": 6,
   "facility": 23
 }
Sample queries
_sourceCategory="druva_app"
|json"eventID","eventType","eventState","eventDetails","initiator","inSyncUserID","inSyncUserName","inSyncUserEmail","inSyncDataSourceID","clientOS","ip","timestamp","severity" as event_id,event_type,event_state,event_details,initiator,user_id,user_name,user_email,device_id,client_os,ip,time_stamp,severity nodrop
| where severity matches "{{severity}}"
| where client_os matches "{{client_os}}"
| where event_type matches "{{event_type}}"
| where event_state matches "{{event_state}}"
| if(isNull(user_id),"-",user_id) as user_id
| if(isNull(user_email),"-",user_email) as user_email
| if(isNull(client_os),"-",client_os) as client_os
| if(isNull(user_name),"-",user_name) as user_name
| if(isNull(device_id),"-",device_id) as device_id
| if(isNull(initiator),"-",initiator) as initiator
| if(isEmpty(ip),"-",ip) as ip
| count_distinct(user_id)
Set up collection
To set up Cloud-to-Cloud Integration Druva Source for the Druva App, follow the instructions provided. These instructions will guide you through the process of creating a source using the Druva Source category, which you will need to use when installing the app. By following these steps, you can ensure that your Druva App is properly integrated and configured to collect and analyze your Druva data.
Installing the Druva app
To install the app, do the following:
- Select App Catalog.
- In the 🔎 Search Apps field, run a search for your desired app, then select it.
- Click Install App.
note
Sometimes this button says Add Integration.
- Click Next in the Setup Data section.
- In the Configure section of your respective app, complete the following fields.
- Key. Select either of these options for the data source.
- Choose Source Category and select a source category from the list for Default Value.
- Choose Custom, and enter a custom metadata field. Insert its value in Default Value.
- Key. Select either of these options for the data source.
- Click Next. You will be redirected to the Preview & Done section.
Post-installation
Once your app is installed, it will appear in your Installed Apps folder, and dashboard panels will start to fill automatically.
Each panel slowly fills with data matching the time range query and received since the panel was created. Results will not immediately be available, but will update with full graphs and charts over time.
Upgrading the Druva app (Optional)
To update the app, do the following:
- Select App Catalog.
- In the Search Apps field, search for and then select your app.
Optionally, you can identify apps that can be upgraded in the Upgrade available section. - To upgrade the app, click Upgrade.
- If the upgrade does not have any configuration or property changes, you will be redirected to the Preview & Done section.
- If the upgrade has any configuration or property changes, you will be redirected to Setup Data page.
- In the Configure section of your respective app, complete the following fields.
- Key. Select either of these options for the data source.
- Choose Source Category and select a source category from the list for Default Value.
- Choose Custom and enter a custom metadata field. Insert its value in Default Value.
- Key. Select either of these options for the data source.
- Click Next. You will be redirected to the Preview & Done section.
- In the Configure section of your respective app, complete the following fields.
Post-update
Your upgraded app will be installed in the Installed Apps folder, and dashboard panels will start to fill automatically.
See our Release Notes changelog for new updates in the app.
Uninstalling the Druva app (Optional)
To uninstall the app, do the following:
- Select App Catalog.
- In the 🔎 Search Apps field, run a search for your desired app, then select it.
- Click Uninstall.
Viewing Druva dashboards
All dashboards have a set of filters that you can apply to the entire dashboard. Use these filters to drill down and examine the data to a granular level.
- You can change the time range for a dashboard or panel by selecting a predefined interval from a drop-down list, choosing a recently used time range, or specifying custom dates and times. Learn more.
- You can use template variables to drill down and examine the data on a granular level. For more information, see Filter with template variables.
- Most Next-Gen apps allow you to provide the scope at the installation time and are comprised of a key (
_sourceCategoryby default) and a default value for this key. Based on your input, the app dashboards will be parameterized with a dashboard variable, allowing you to change the dataset queried by all panels. This eliminates the need to create multiple copies of the same dashboard with different queries.
Druva Overview dashboard
The Druva - Overview dashboard in the Druva app provides a comprehensive view of the devices and cloud apps used by your organization. It includes widgets for unique user activities, device and app distribution, top users and administrators' details by device and event counts, and the trend of devices and apps over time. This dashboard is a powerful tool for monitoring activity, with the ability to detect and address potential security threats through the "failed events over time" widget. The "recent events details" widget offers a quick snapshot of the latest events. By using this dashboard, you can identify potential issues or anomalies, track changes in device and app usage, and gain a better understanding of events occurring in your organization's devices and cloud apps.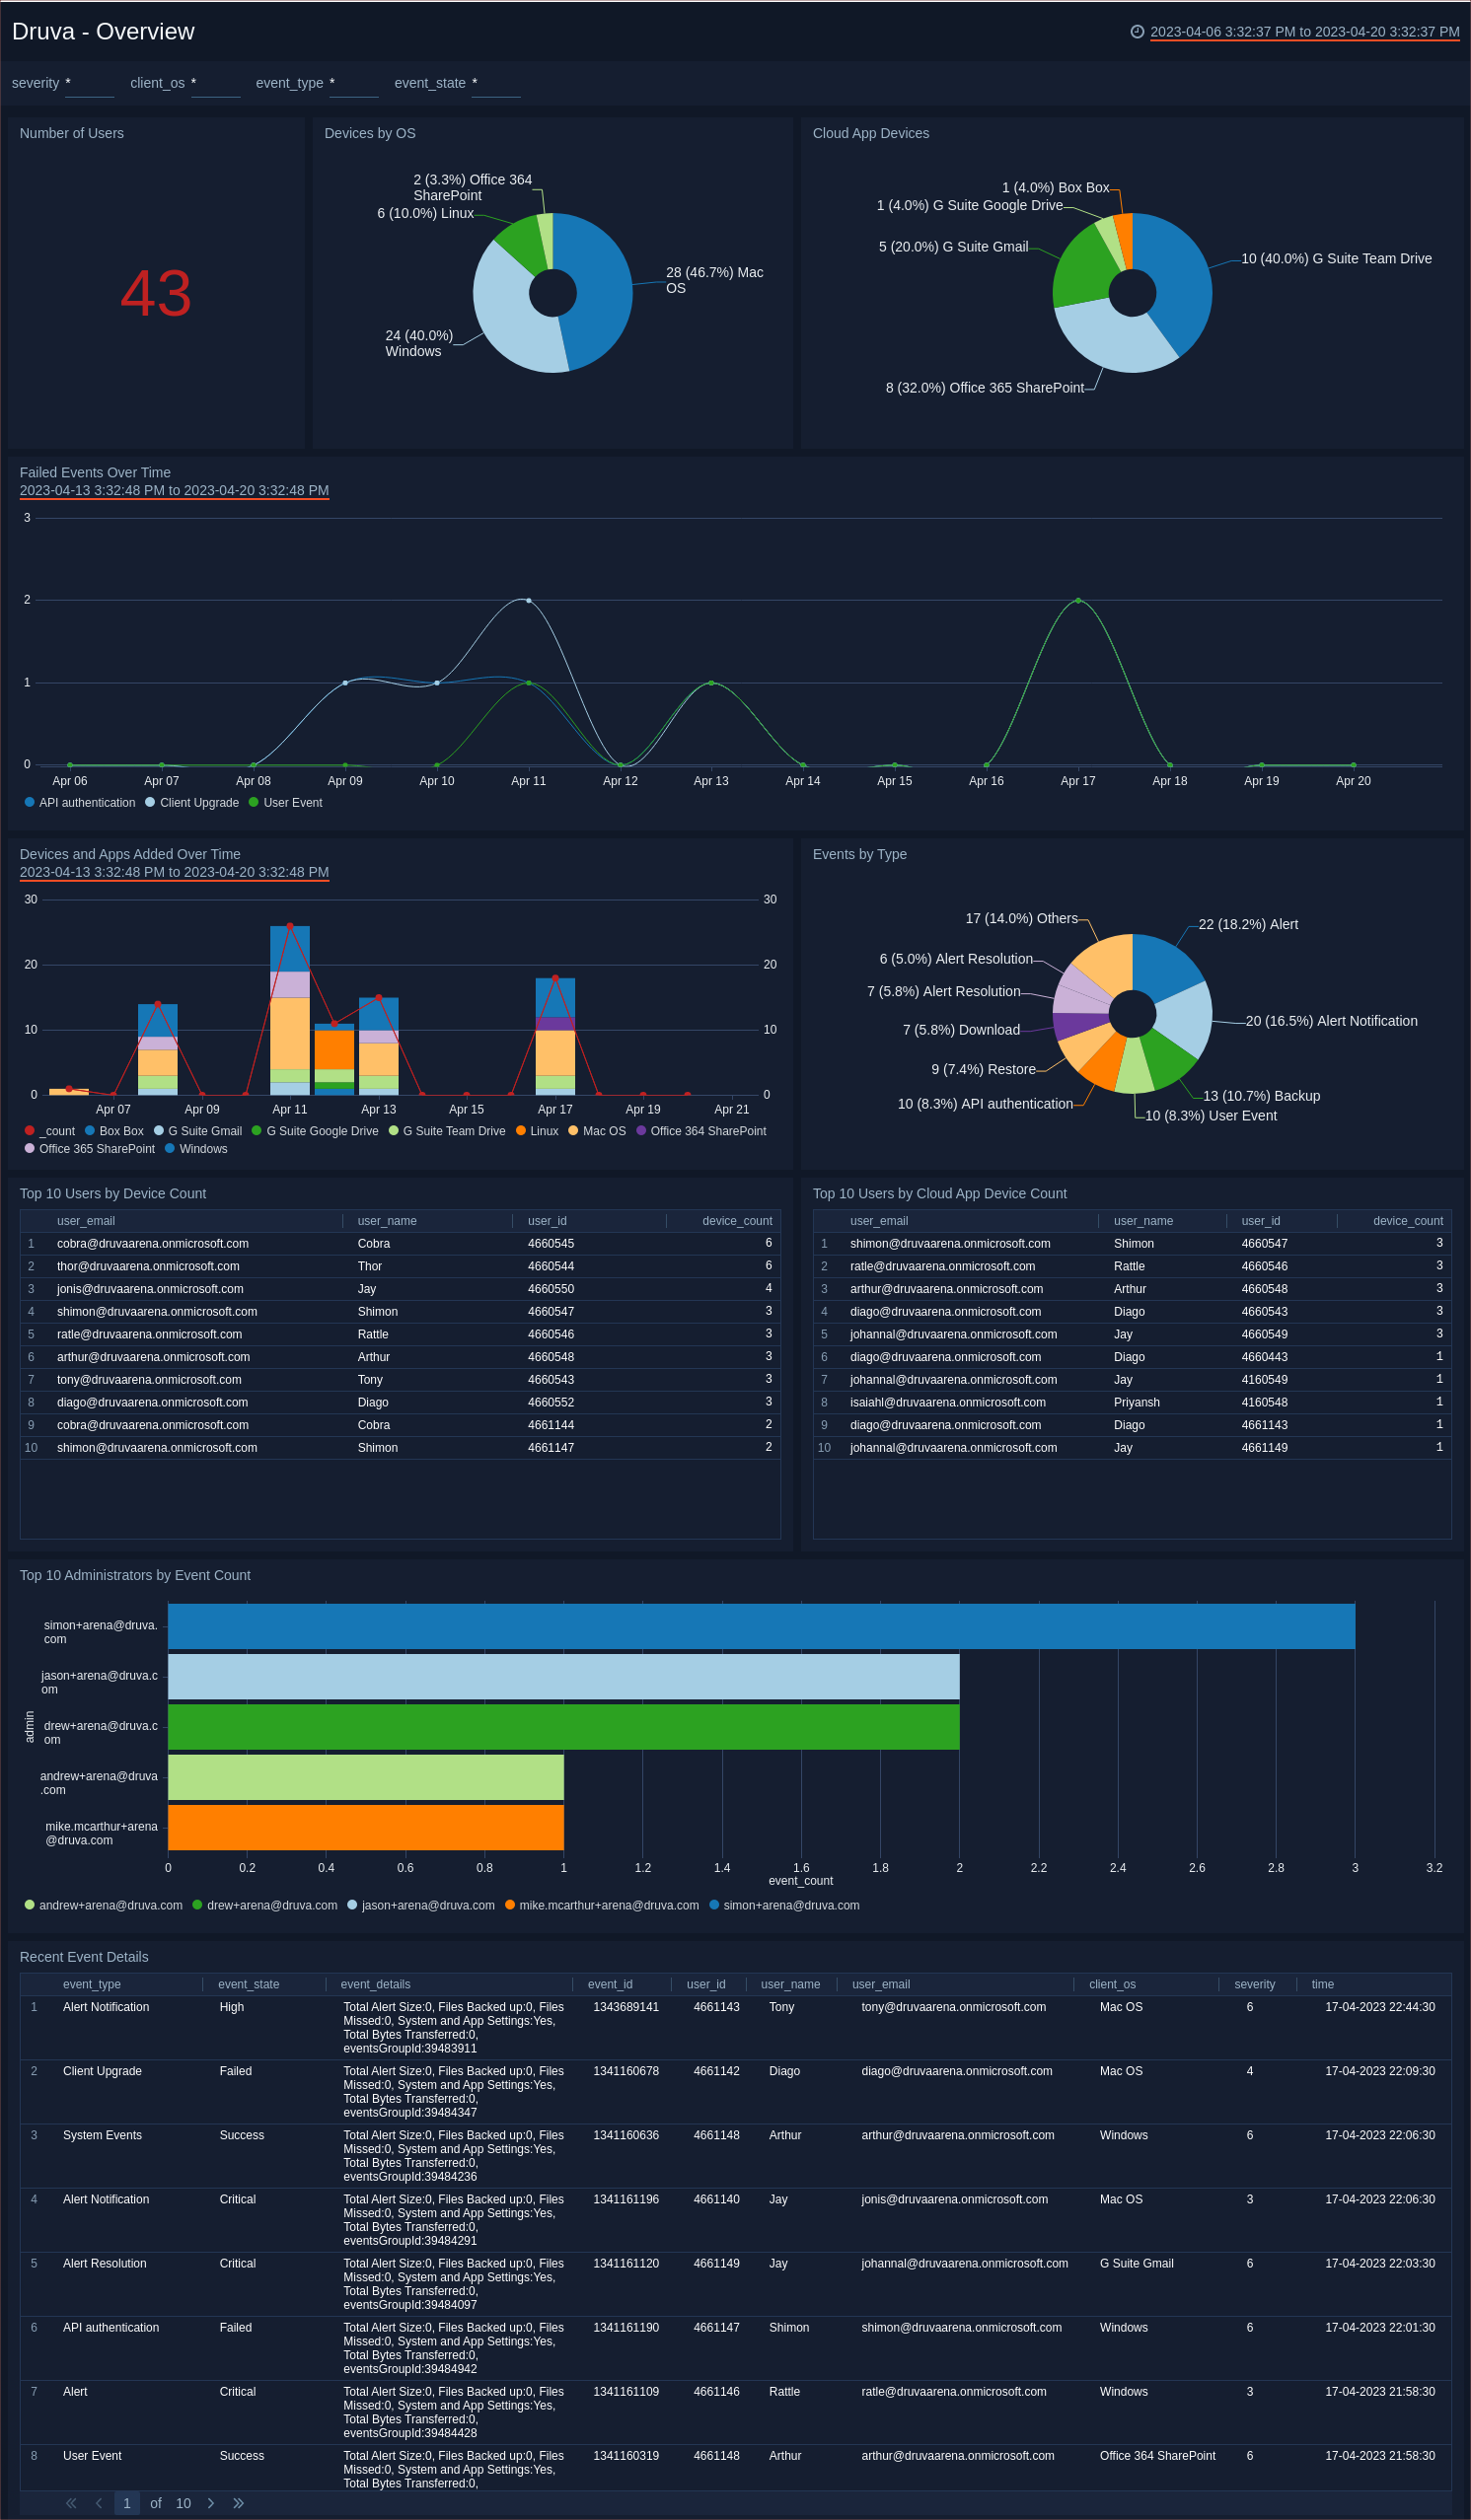
Druva Alerts Overview dashboard
The Druva - Alerts Overview dashboard in the Druva app provides comprehensive widgets to analyze security threats and take proactive measures. It includes widgets for tracking alerts by location, severity, and frequency over time, as well as detailed information on unusual activity events and the top users generating alerts. The recent alerts widget provides a quick snapshot of the latest security activity. By using this dashboard, organizations can identify and respond to potential threats efficiently, safeguarding their data effectively.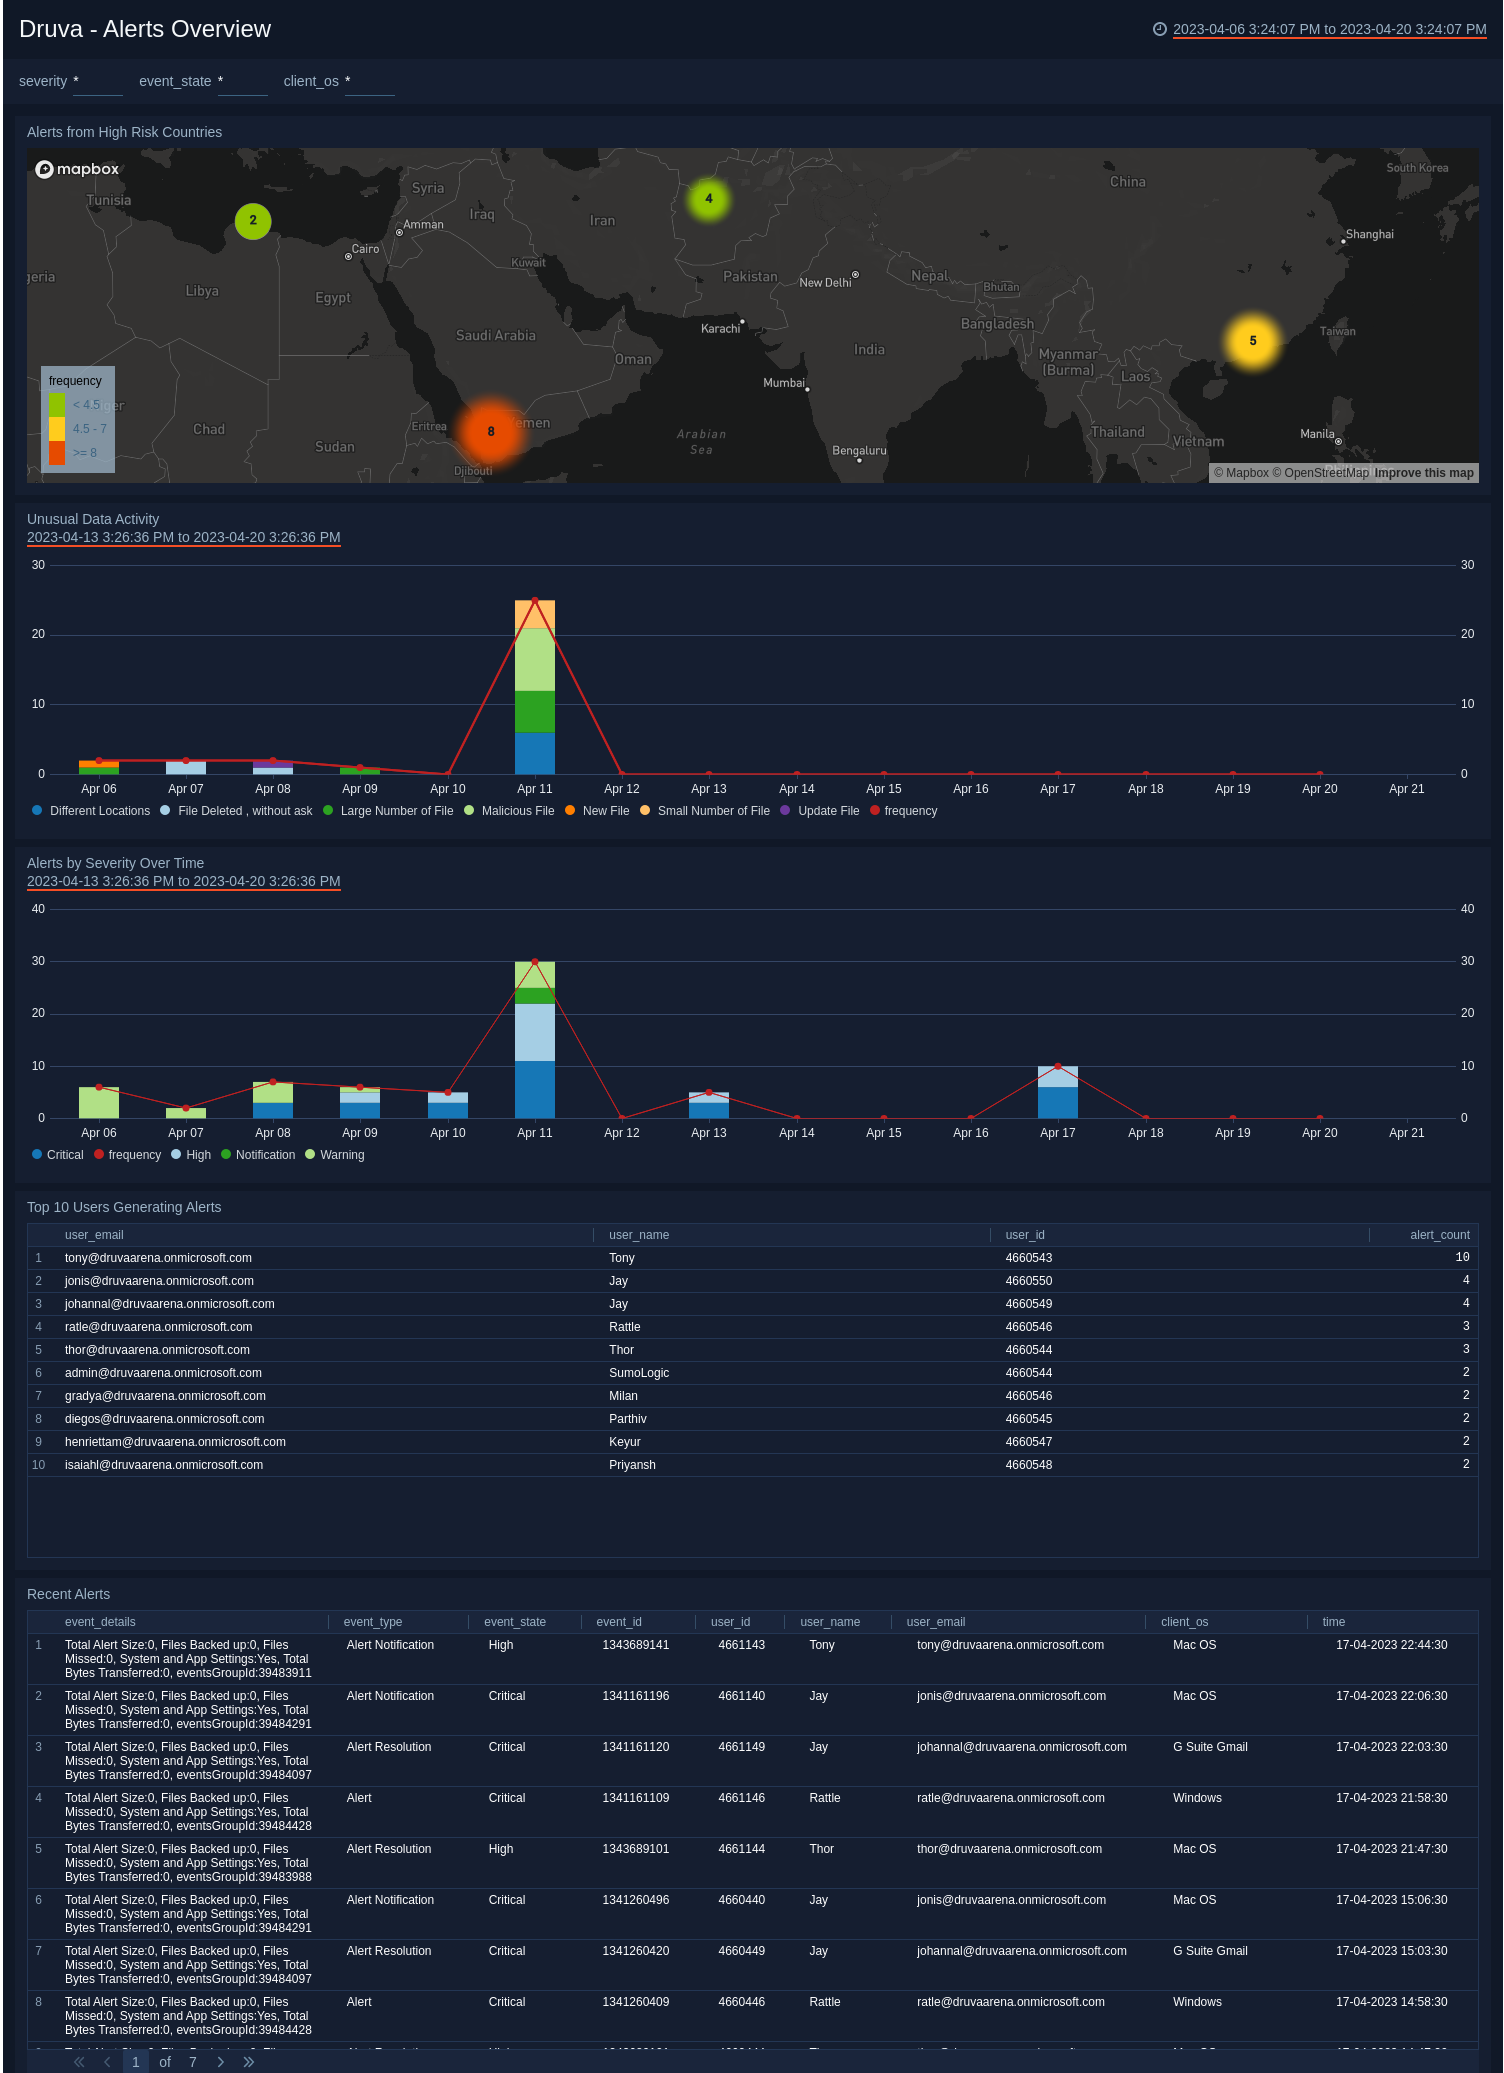
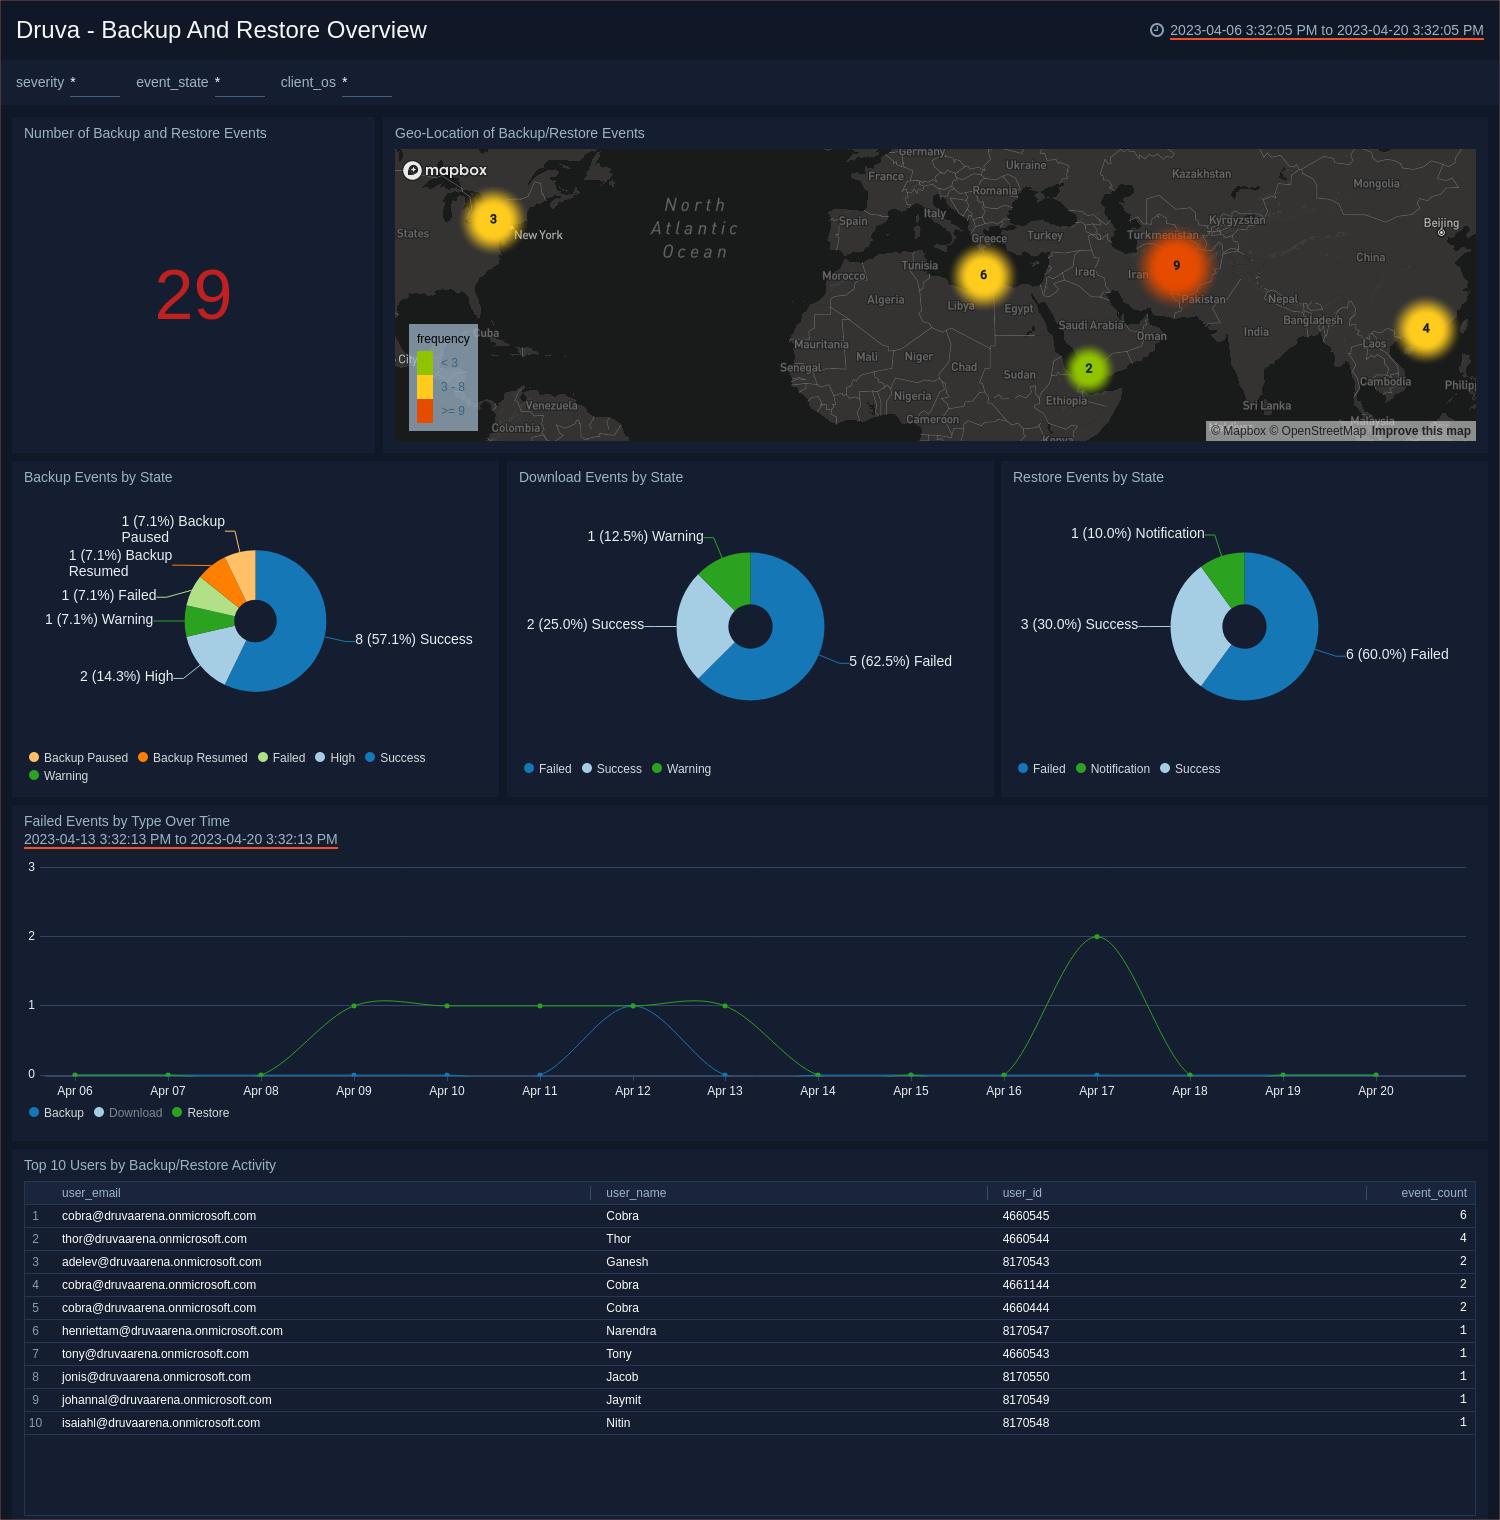
Druva Backup and Restore dashboard
The Druva - Backup and Restore Overview dashboard offers a comprehensive view of backup, restore, and download events, providing valuable insights into your organization's data protection activities. The dashboard's widgets allow you to track and analyze these events, including the count and distribution of backup, restore, and download activities. You can closely monitor the most active users using the top users performing backup/restore activity widget.
The trend of failed backup/restore/download events over time offers an overview of any issues, enabling you to quickly identify and resolve them. The geo-location widget tracks activity locations, helping you identify potential threats or vulnerabilities. With this dashboard, you can monitor your data protection activities closely, ensuring the smooth running of backup and restore processes and securing your data.