SentinelOne
The SentinelOne app for Sumo Logic provides security professionals with a comprehensive view of their organization's security posture. The app, based on Sumo Logic’s SentinelOne Source, allows you to quickly ingest data from your SentinelOne agents into Sumo Logic for real-time analysis.
With the SentinelOne app, you can gain valuable insights into your endpoint security data, including threat intelligence, endpoint activity, and system health. You can monitor your endpoints for suspicious behavior and quickly respond to any security incidents that may arise.
The app provides pre-built dashboards that enable you to quickly visualize your SentinelOne data and gain insights into your organization's security posture. You can customize these dashboards to meet your specific needs and monitor the metrics that matter most. With the SentinelOne App for Sumo Logic, you can:
- Ingest data from SentinelOne agents into Sumo Logic for real-time analysis and response.
- Monitor your endpoints for suspicious behavior and respond to security incidents in real-time.
- Gain valuable insights into your organization's security posture with pre-built dashboards.
- Customize dashboards to meet your specific needs and monitor the metrics that matter most to you.
In summary, the SentinelOne app for Sumo Logic provides security professionals with the tools they need to monitor and respond to security incidents in real-time, ensuring the protection of their organization's critical assets.
Log types
The Sumo Logic app for SentinelOne consumes Threats and Agents logs, refer to the Threats and Agents documentation.
Sample log messages
{
    "agentDetectionInfo": {
        "accountId": "11384404",
        "accountName": "Health",
        "agentDetectionState": null,
        "agentDomain": "",
        "agentIpV4": "1.0.0.1,10.0.0.1",
        "agentIpV6": "f0::f3:af:f4:97",
        "agentLastLoggedInUpn": null,
        "agentLastLoggedInUserMail": null,
        "agentLastLoggedInUserName": "genice.tapia",
        "agentMitigationMode": "detect",
        "agentOsName": "OS X",
        "agentOsRevision": "12.5.1 (21G83)",
        "agentRegisteredAt": "2021-10-28T17:51:49.945302Z",
        "agentUuid": "370-BA-51-D8-E0346",
        "agentVersion": "2.4.2.69",
        "cloudProviders": {},
        "externalIp": "76.153.132.178",
        "groupId": "12600828731",
        "groupName": "MacOS Clients",
        "siteId": "11384659336",
        "siteName": "Default site"
    },
    "agentRealtimeInfo": {
        "accountId": "11384926404",
        "accountName": "HealthChannels",
        "activeThreats": 0,
        "agentComputerName": "FVFG405D",
        "agentDecommissionedAt": null,
        "agentDomain": "",
        "agentId": "12768607002082",
        "agentInfected": false,
        "agentIsActive": true,
        "agentIsDecommissioned": false,
        "agentMachineType": "laptop",
        "agentMitigationMode": "detect",
        "agentNetworkStatus": "connected",
        "agentOsName": "OS X",
        "agentOsRevision": "12.5.1 (21G83)",
        "agentOsType": "macos",
        "agentUuid": "37C120-1BA-51-9D8-E0346",
        "agentVersion": "2.4.2.699",
        "groupId": "1260028731",
        "groupName": "MacOS Clients",
        "networkInterfaces": [
            {
                "id": "163985487",
                "inet": [],
                "inet6": [
                    "f0::f3:af:f4:97"
                ],
                "name": "llw0",
                "physical": "l1:k2:n3:23:3n:o0"
            }
        ],
        "operationalState": "na",
        "rebootRequired": false,
        "scanAbortedAt": "2021-10-28T17:55:16.949997Z",
        "scanFinishedAt": "2021-10-28T19:30:50.006703Z",
        "scanStartedAt": "2021-10-28T17:52:52.671354Z",
        "scanStatus": "finished",
        "siteId": "1138465859336",
        "siteName": "Default site",
        "storageName": null,
        "storageType": null,
        "userActionsNeeded": []
    },
    "containerInfo": {
        "id": null,
        "image": null,
        "isContainerQuarantine": null,
        "labels": null,
        "name": null
    },
    "id": "1642172211953801585",
    "indicators": [
        {
            "category": "Discovery",
            "description": "Process performed system service discovery",
            "ids": [
                969
            ],
            "tactics": [
                {
                    "name": "System Service Discovery",
                    "source": "MITRE",
                    "techniques": [
                        {
                            "link": "https://atta007/",
                            "name": "T7"
                        }
                    ]
                }
            ]
        }
    ],
    "kubernetesInfo": {
        "cluster": null,
        "controllerKind": null,
        "controllerLabels": null,
        "controllerName": null,
        "isContainerQuarantine": null,
        "namespace": null,
        "namespaceLabels": null,
        "node": null,
        "nodeLabels": null,
        "pod": null,
        "podLabels": null
    },
    "mitigationStatus": [],
    "threatInfo": {
        "analystVerdict": "false_positive",
        "analystVerdictDescription": "False positive",
        "automaticallyResolved": false,
        "browserType": null,
        "certificateId": "<Type=DD/ID=ce.jamf/Subject=O43>",
        "classification": "Malware",
        "classificationSource": "Static",
        "cloudFilesHashVerdict": null,
        "collectionId": "1635033841219",
        "confidenceLevel": "suspicious",
        "createdAt": "2023-03-16T18:23:02.706393Z",
        "detectionEngines": [
            {
                "key": "executables",
                "title": "Behavioral AI"
            }
        ],
        "detectionType": "dynamic",
        "engines": [
            "DBT - Executables"
        ],
        "externalTicketExists": false,
        "externalTicketId": null,
        "failedActions": false,
        "fileExtension": null,
        "fileExtensionType": null,
        "filePath": "/usr/local/jamf/bin/jamf",
        "fileSize": 17033056,
        "fileVerificationType": null,
        "identifiedAt": "2023-03-16T18:23:01Z",
        "incidentStatus": "resolved",
        "incidentStatusDescription": "Resolved",
        "initiatedBy": "agent_policy",
        "initiatedByDescription": "Agent Policy",
        "initiatingUserId": null,
        "initiatingUsername": null,
        "isFileless": false,
        "isValidCertificate": true,
        "maliciousProcessArguments": null,
        "md5": null,
        "mitigatedPreemptively": false,
        "mitigationStatus": "marked_as_benign",
        "mitigationStatusDescription": "Marked as benign",
        "originatorProcess": "launchd",
        "pendingActions": false,
        "processUser": "root",
        "publisherName": "JAMF Software",
        "reachedEventsLimit": null,
        "rebootRequired": false,
        "sha1": "7c5d6774855fb32785f73ec2095",
        "sha256": null,
        "storyline": "5D3A-284D-46-A779-1072FA4",
        "threatId": "164213801585",
        "threatName": "jamf",
        "updatedAt": "2023-03-16T18:30:37.284743Z"
    },
    "whiteningOptions": [
        "certificate",
        "hash",
        "path"
    ]
}
{
    "accountId": "113841926404",
    "accountName": "Health Lobby",
    "activeDirectory": {
        "computerDistinguishedName": null,
        "computerMemberOf": [],
        "lastUserDistinguishedName": null,
        "lastUserMemberOf": []
    },
    "activeThreats": 0,
    "agentVersion": "22.3.2.23",
    "allowRemoteShell": true,
    "appsVulnerabilityStatus": "up_to_date",
    "cloudProviders": {},
    "computerName": "FDLV0W3",
    "consoleMigrationStatus": "N/A",
    "coreCount": 4,
    "cpuCount": 1,
    "cpuId": "11th Gen Intel(R) Core(TM) i5-1135G7 @ 2.40GHz",
    "createdAt": "2022-08-09T19:28:45.940230Z",
    "detectionState": "full_mode",
    "domain": "WORKGROUP",
    "encryptedApplications": true,
    "externalId": "",
    "externalIp": "1.1.2.1",
    "firewallEnabled": false,
    "firstFullModeTime": "2022-08-10T08:01:58.651000",
    "groupId": "126008949569",
    "groupIp": "1.1.2.x",
    "groupName": "Windows Clients",
    "id": "148347195130",
    "inRemoteShellSession": false,
    "infected": false,
    "installerType": ".msi",
    "isActive": true,
    "isDecommissioned": false,
    "isPendingUninstall": false,
    "isUninstalled": false,
    "isUpToDate": true,
    "lastActiveDate": "2023-03-17T10:27:24.654796Z",
    "lastIpToMgmt": "1.1.1.1",
    "lastLoggedInUserName": "Heyleigh.leger_scrib",
    "licenseKey": "",
    "locationEnabled": true,
    "locationType": "fallback",
    "locations": [
        {
            "id": "101284689332",
            "name": "Fallback",
            "scope": "global"
        }
    ],
    "machineType": "laptop",
    "mitigationMode": "protect",
    "mitigationModeSuspicious": "detect",
    "modelName": "Dell Inc. - Latitude 3520",
    "networkInterfaces": [
        {
            "gatewayIp": "102.1.1.1",
            "gatewayMacAddress": "f8:f8:f8:f8:f8:f8",
            "id": "16419476902",
            "inet": [
                "922.174.1.225"
            ],
            "inet6": [
                "wd80::8ks4:6f1c:828w:3l80"
            ],
            "name": "Wi-Fi",
            "physical": "q2:5d:a0:2d:0d:95"
        }
    ],
    "networkQuarantineEnabled": false,
    "networkStatus": "connected",
    "operationalState": "na",
    "operationalStateExpiration": null,
    "osArch": "64 bit",
    "osName": "Windows 10 Pro",
    "osRevision": "19044",
    "osStartTime": "2023-03-17T10:22:20Z",
    "osType": "windows",
    "osUsername": null,
    "rangerStatus": "Enabled",
    "rangerVersion": "12.11.1.16",
    "registeredAt": "2022-08-09T19:28:45.932112Z",
    "remoteProfilingState": "disabled",
    "remoteProfilingStateExpiration": null,
    "scanAbortedAt": null,
    "scanFinishedAt": "2022-08-10T08:02:01.732412Z",
    "scanStartedAt": "2022-08-09T19:31:28.742739Z",
    "scanStatus": "finished",
    "serialNumber": "FS6V1B3",
    "siteId": "1138463255859336",
    "siteName": "Default site",
    "storageName": null,
    "storageType": null,
    "tags": {
        "sentinelone": []
    },
    "threatRebootRequired": false,
    "totalMemory": 7926,
    "updatedAt": "2023-03-17T10:25:37.489066Z",
    "userActionsNeeded": [],
    "uuid": "be20d732fc87bd479e0a"
}
Sample queries
_sourceCategory=sentinelone  threatInfo
| json "id", "threatInfo.incidentStatus", "threatInfo.classificationSource", "threatInfo.confidenceLevel", "threatInfo.detectionEngines", "threatInfo.initiatedBy", "threatInfo.rebootRequired", "threatInfo.createdAt", "threatInfo.detectionType", "threatInfo.mitigationStatus", "threatInfo.analystVerdict", "threatInfo.threatName", "agentRealtimeInfo.siteName","agentRealtimeInfo.agentOsType", "agentRealtimeInfo.agentMachineType" as id, incidentStatus, classificationSource, confidenceLevel, detectionEngines, initiatedBy, rebootRequired, createdAt, detectionType, mitigationStatus, analystVerdict, threatName, siteName, agentOsType, agentMachineType nodrop
| where siteName matches "{{site}}" or isNull(siteName)
| where mitigationStatus matches "{{mitigation_status}}" or isNull(mitigationStatus)
| where agentOsType matches "{{os}}" or isNull(agentOsType)
| where agentMachineType matches "{{machine}}" or isNull(agentMachineType)
| where confidenceLevel matches "{{confidence_level}}" or isNull(confidenceLevel)
| where confidenceLevel = "suspicious"
| count_distinct(id)
_sourceCategory=sentinelone  uuid
| Json "uuid","scanStatus","siteName","mitigationMode","infected","firewallEnabled","activeThreats","installerType","osName","mitigationModeSuspicious","isPendingUninstall","networkStatus","osType","isActive","isUninstalled","isDecommissioned","externalIp","modelName","machineType" as id,scan_status,site_name,mitigation_mode,infected,firewall_enabled,active_threats,installer_type,os_name,mitigation,is_pending_uninstall,network_status,os_type,is_active,is_uninstalled,is_decommissioned,ip,model_name,machine_type nodrop
| where site_name matches "{{site}}" or isNull(site_name)
| where os_type matches "{{os}}" or isNull(os_type)
| where machine_type matches "{{machine}}" or isNull(machine_type)
| where installer_type matches "{{installer}}" or isNull(installer_type)
| count_distinct (id)
Installing the SentinelOne app
To install the app, do the following:
- Select App Catalog.
- In the 🔎 Search Apps field, run a search for your desired app, then select it.
- Click Install App.
note
Sometimes this button says Add Integration.
- Click Next in the Setup Data section.
- In the Configure section of your respective app, complete the following fields.
- Key. Select either of these options for the data source.
- Choose Source Category and select a source category from the list for Default Value.
- Choose Custom, and enter a custom metadata field. Insert its value in Default Value.
- Key. Select either of these options for the data source.
- Click Next. You will be redirected to the Preview & Done section.
Post-installation
Once your app is installed, it will appear in your Installed Apps folder, and dashboard panels will start to fill automatically.
Each panel slowly fills with data matching the time range query and received since the panel was created. Results will not immediately be available, but will update with full graphs and charts over time.
Upgrading the SentinelOne app (Optional)
To update the app, do the following:
- Select App Catalog.
- In the Search Apps field, search for and then select your app.
Optionally, you can identify apps that can be upgraded in the Upgrade available section. - To upgrade the app, click Upgrade.
- If the upgrade does not have any configuration or property changes, you will be redirected to the Preview & Done section.
- If the upgrade has any configuration or property changes, you will be redirected to Setup Data page.
- In the Configure section of your respective app, complete the following fields.
- Key. Select either of these options for the data source.
- Choose Source Category and select a source category from the list for Default Value.
- Choose Custom and enter a custom metadata field. Insert its value in Default Value.
- Key. Select either of these options for the data source.
- Click Next. You will be redirected to the Preview & Done section.
- In the Configure section of your respective app, complete the following fields.
Post-update
Your upgraded app will be installed in the Installed Apps folder, and dashboard panels will start to fill automatically.
See our Release Notes changelog for new updates in the app.
Uninstalling the SentinelOne app (Optional)
To uninstall the app, do the following:
- Select App Catalog.
- In the 🔎 Search Apps field, run a search for your desired app, then select it.
- Click Uninstall.
Viewing SentinelOne dashboards
All dashboards have a set of filters that you can apply to the entire dashboard. Use these filters to drill down and examine the data to a granular level.
- You can change the time range for a dashboard or panel by selecting a predefined interval from a drop-down list, choosing a recently used time range, or specifying custom dates and times. Learn more.
- You can use template variables to drill down and examine the data on a granular level. For more information, see Filter with template variables.
- Most Next-Gen apps allow you to provide the scope at the installation time and are comprised of a key (
_sourceCategoryby default) and a default value for this key. Based on your input, the app dashboards will be parameterized with a dashboard variable, allowing you to change the dataset queried by all panels. This eliminates the need to create multiple copies of the same dashboard with different queries.
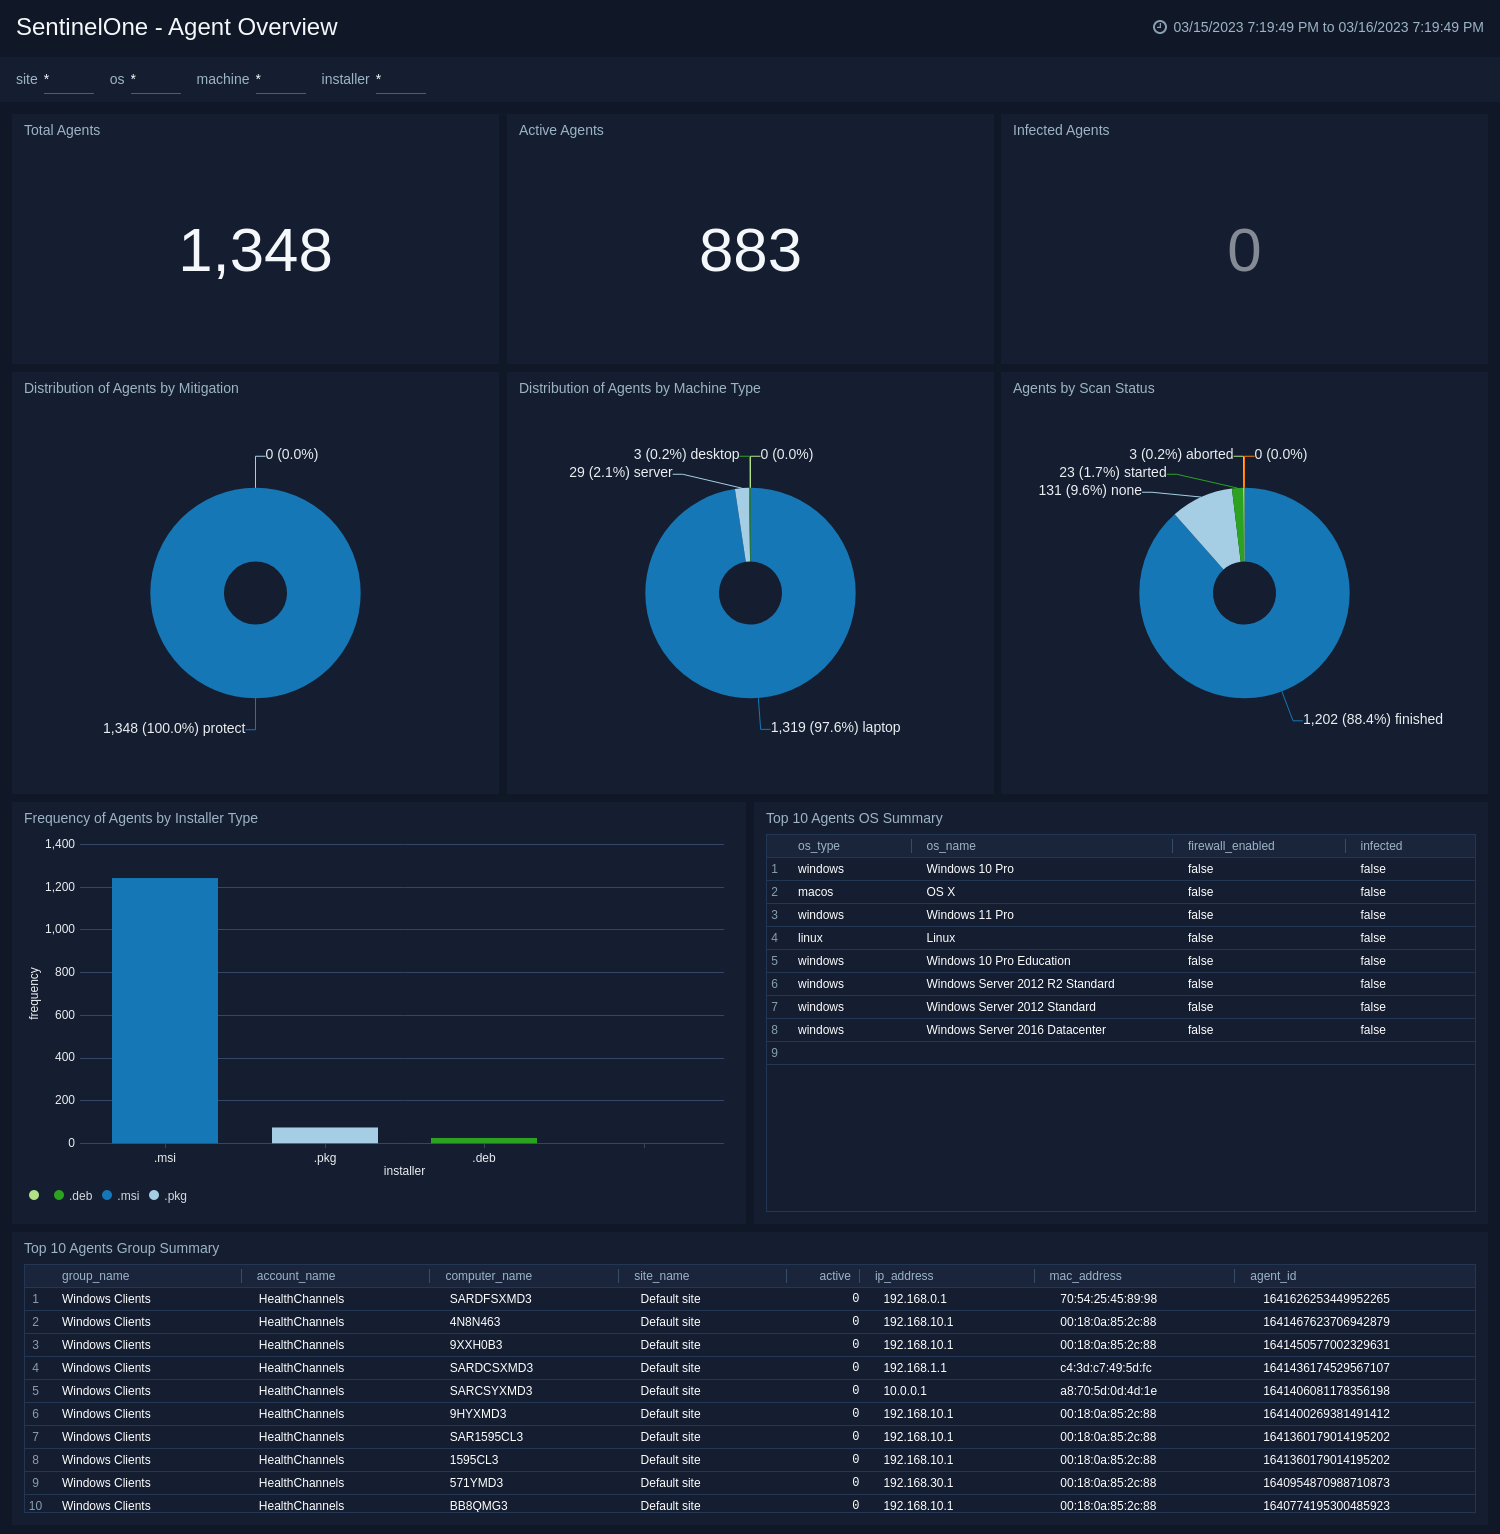
Agent Overview
The SentinelOne - Agent Overview provides valuable insights related to SentinelOne agents deployed across an organization. The dashboard includes widgets that display key information on the total number of agents, active threats, and infected agents. It also provides information on the distribution of agents by mitigation, machine type, and scan status.
Additionally, the dashboard includes information on the frequency of agents by installer type and the top 10 agents' operating systems and group summary. With this dashboard, security teams can easily monitor the performance of agents and ensure that they are adequately protecting their organization from potential threats.
The SentinelOne Agent Overview enables organizations to quickly identify any issues with agent deployment or performance and take corrective action to improve their overall security posture. It is a powerful tool for any organization looking to ensure the effectiveness and efficiency of its threat protection solutions.
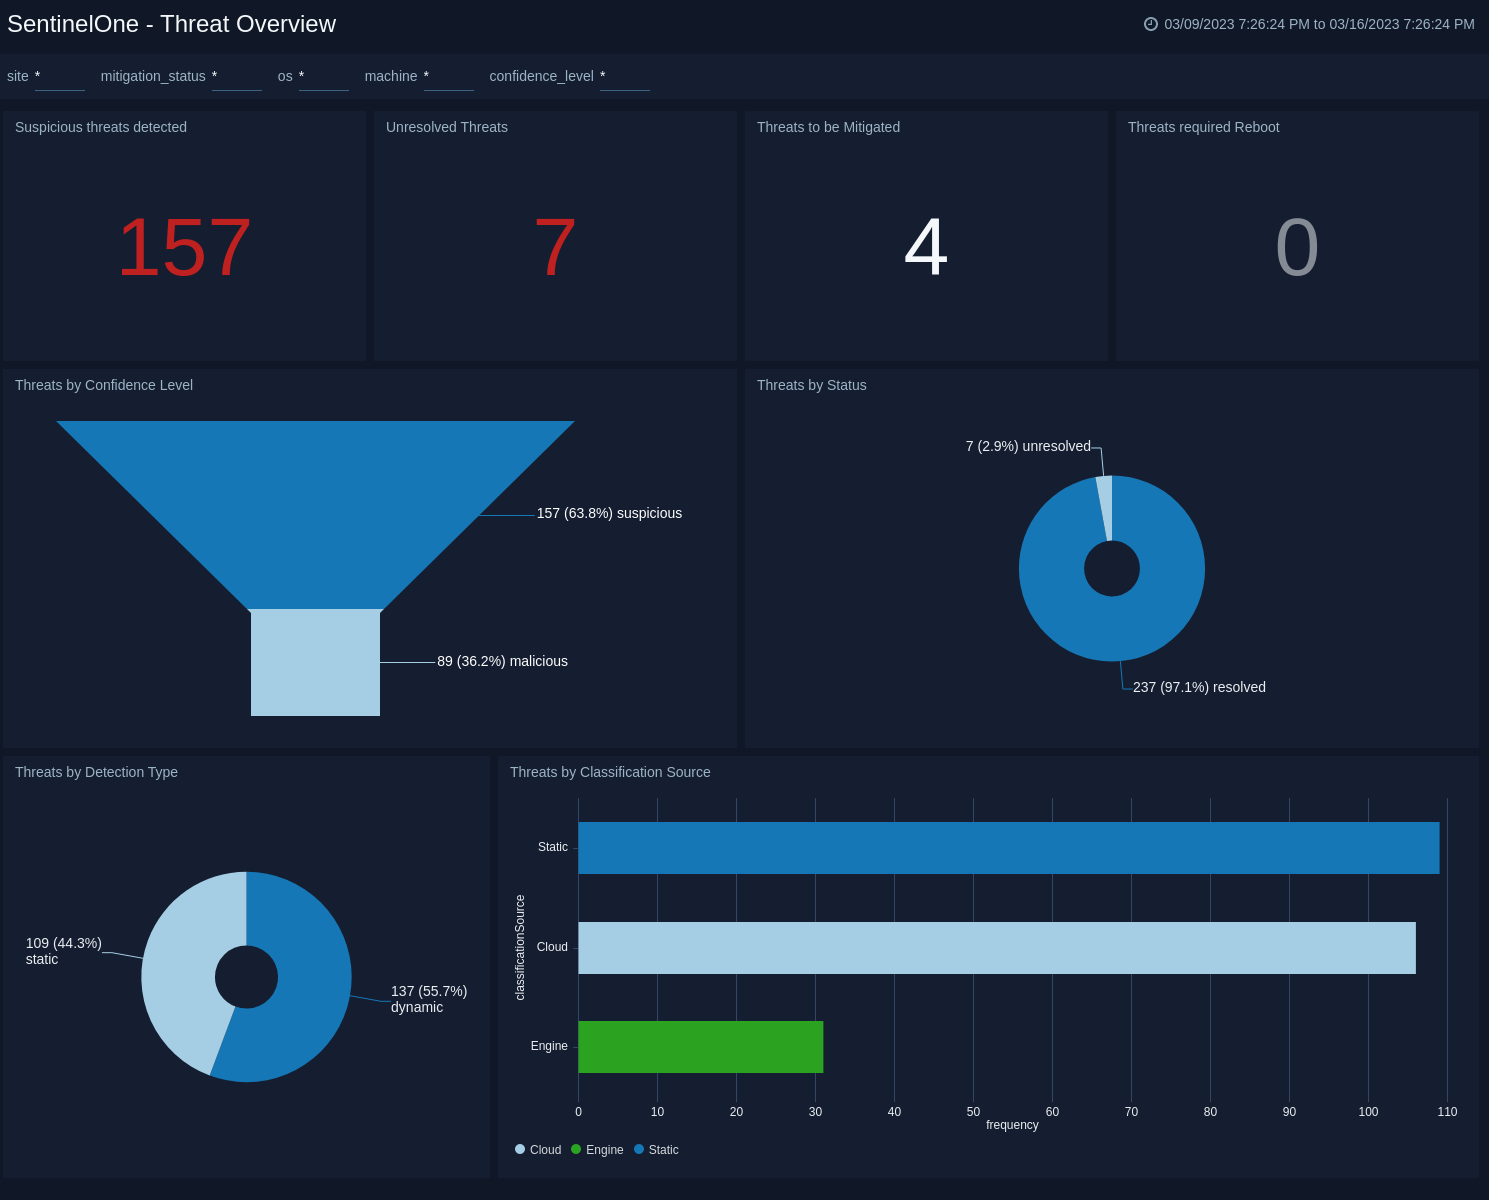
Threat Overview
The SentinelOne - Threat Overview provides a comprehensive overview of threats detected by SentinelOne, a threat intelligence and response platform. The dashboard includes widgets that display key information on unresolved threats, suspicious threats detected, threats to be mitigated, resolved threats, and threats that require a reboot. The dashboard also provides insights into the types of threats detected, their current status, and their classification source. With this dashboard, security teams can quickly identify and respond to potential security threats, minimizing the risk of security breaches and data loss.
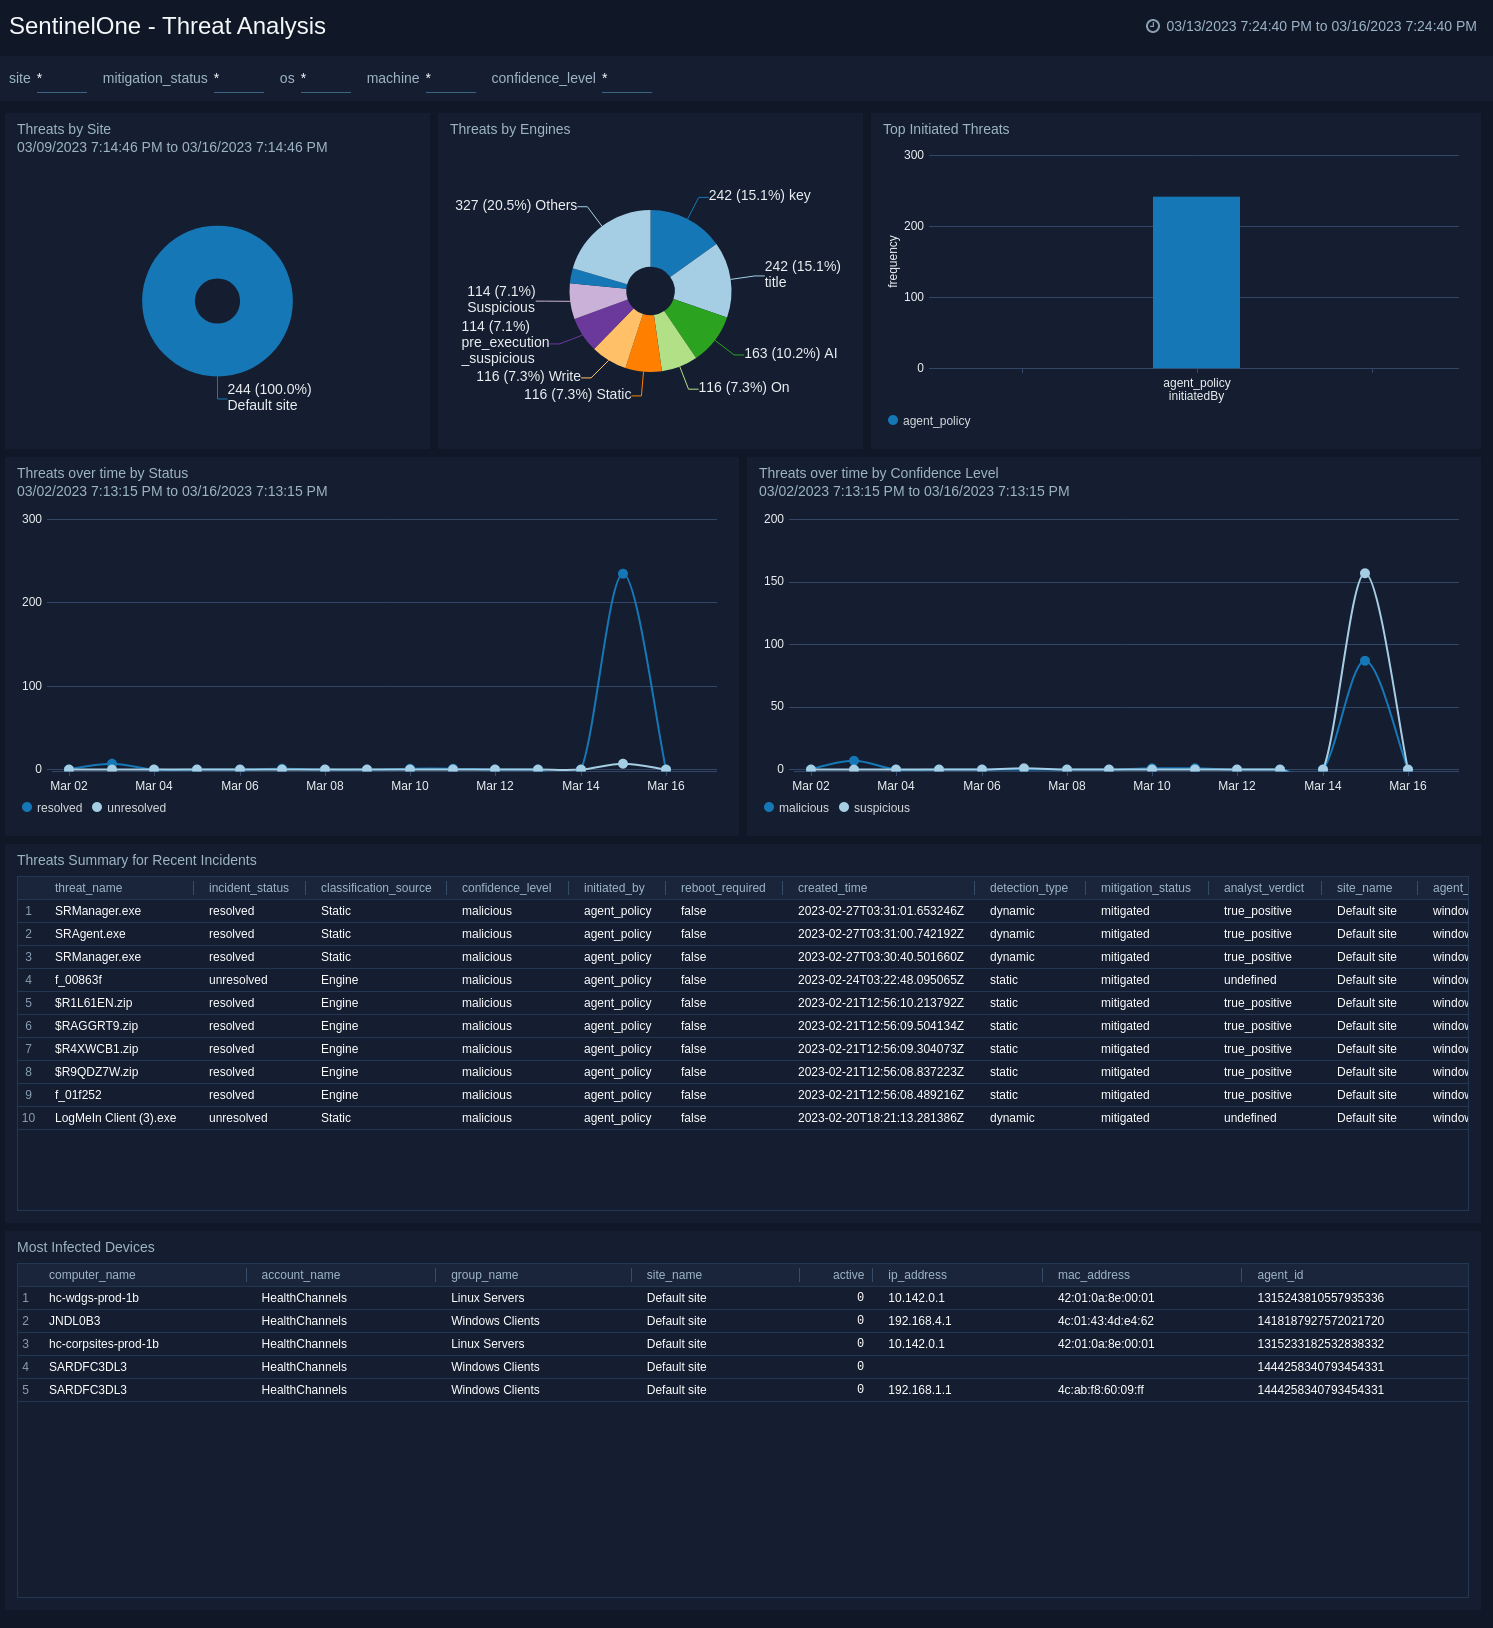
Threat Analysis
The SentinelOne - Threat Analysis provides a comprehensive view of the threat landscape and enables security teams to quickly identify and respond to potential threats. The dashboard includes widgets that display key information on the confidence level of threats detected, their location across various sites, the top initiated threats, and the engines used to detect them. The dashboard also provides insights into the status of threats over time, recent incidents, and the most infected devices.
With the information provided by this dashboard, security teams can effectively prioritize and manage their response to potential security threats. They can quickly identify the most critical threats, monitor the effectiveness of their threat detection engines, and respond to the most heavily infected devices. The "SentinelOne - Threat Analysis" is a valuable tool for any organization looking to proactively manage their cybersecurity risk.