2022 Archive

This is an archive of the 2022 Sumo Logic Service Release Notes.
December 29, 2022 (Real User Monitoring)
New - We've added a new Real User Monitoring script property, getOverriddenServiceName, that allows you to set up a service name dynamically and override the service name of a span during its creation.
You can use getOverriddenServiceName to create different services for different sub-parts of your website. For example, you could create unique service names for micro-frontends. Learn more.
December 22, 2022 (CircleCI Job Analytics)
New - You can now report CircleCI job analytics to your Sumo Logic dashboard using our new job-collector command, which sends environment, team, and service information at the job level.
Add this command to your job with the environment, team, or service custom-data values as parameters. This command will run with the rest of the job's commands for sending the job log.
Not including this command at the job level will send empty custom-data values to Sumo.
To learn more, refer to the Sumo Logic orb repo.
December 14, 2022 (Traces)
New - Trace duration breakdown chart dashboard support is now available.
On the Trace page, you can now add the trace duration breakdown chart to the dashboard. Use the Traces panel and change the chart type to "Breakdown Chart" in the dropdown of Visual settings.
December 5, 2022 (Metrics)
New - We’ve released a new chart type for metrics queries. The funnel chart is useful for visualizing the status of a process with sequential steps. For more information, see Create a Funnel Chart.
December 2, 2022 (Reliability Management)
New - AWS ELB users can now install Sumo Logic out-of-the-box SLOs and associated monitors using our new Terraform script.
This script allows you to install Sumo Logic SLOs in your specified AWS ELB directory and configure SLO alert notifications (e.g., latency limit breached, server error limit breached). Once installed, you can view and edit your SLO alerts via Terraform or from your Sumo Logic Monitors page.
To learn more about our SLOs, see Sumo Logic Reliability management.
December 2, 2022 (Manage)
Update - On November 10, we released improvements to the Account Overview page. Now, an admin for a parent org can see detailed usage of Sumo Credits for different product variables, aggregated across child orgs from the start of the contract period. Another nice enhancement: the Account Overview page now also presents Promotional Credits consumption. For more information, see Create and Manage Orgs.
December 1, 2022 (Metrics)
Update - As of December 1, 2022, metrics ingested to Sumo Logic must include the metric dimension.
If you send metrics without the metric dimension, Sumo Logic will ingest them, and set the metric dimension value to undefined. We plan to deprecate and filter these metrics at a later date.
There are benefits to including the metric dimension: it improves the structure of queries, dashboards, and monitors. In addition, the presence of the metric dimension can significantly improve query latency and monitor evaluation time.
For more information, see Mandatory metric name.
November 30, 2022 (Metrics)
New - We're pleased to announce a new chart type for metric queries. A heat map visualizes the count of data points returned by a metrics query within specified value ranges over time intervals of a specified duration. For more information, see Create a Heat Map.
November 29, 2022 (Metrics)
Update - Good news! We've increased the number of Metrics Monitors that Enterprise and Trial accounts can have, from 500 to 1,500. For more information, see Monitors.
November 28, 2022 (Metrics)
Update - We've updated the logic used to calculate input data limits for metrics queries. This new method enables higher cardinality limits for time series inputs to metric queries. For more information, see Metrics Query Error Messages.
November 22, 2022 (Apps)
Update - We are pleased to announce that the Sumo Logic Lambda Extension has been updated to support collecting telemetry data using the new AWS Lambda Telemetry API. With this update, you can collect telemetry data, including logs, metrics, and traces in JSON format directly from the Lambda execution level. The extension gives a per-invoke level view of the Lambda function and provides insights into the function and execution environment lifecycle. For more information on how to start using it, refer to our documentation.
November 21, 2022 (Alerts)
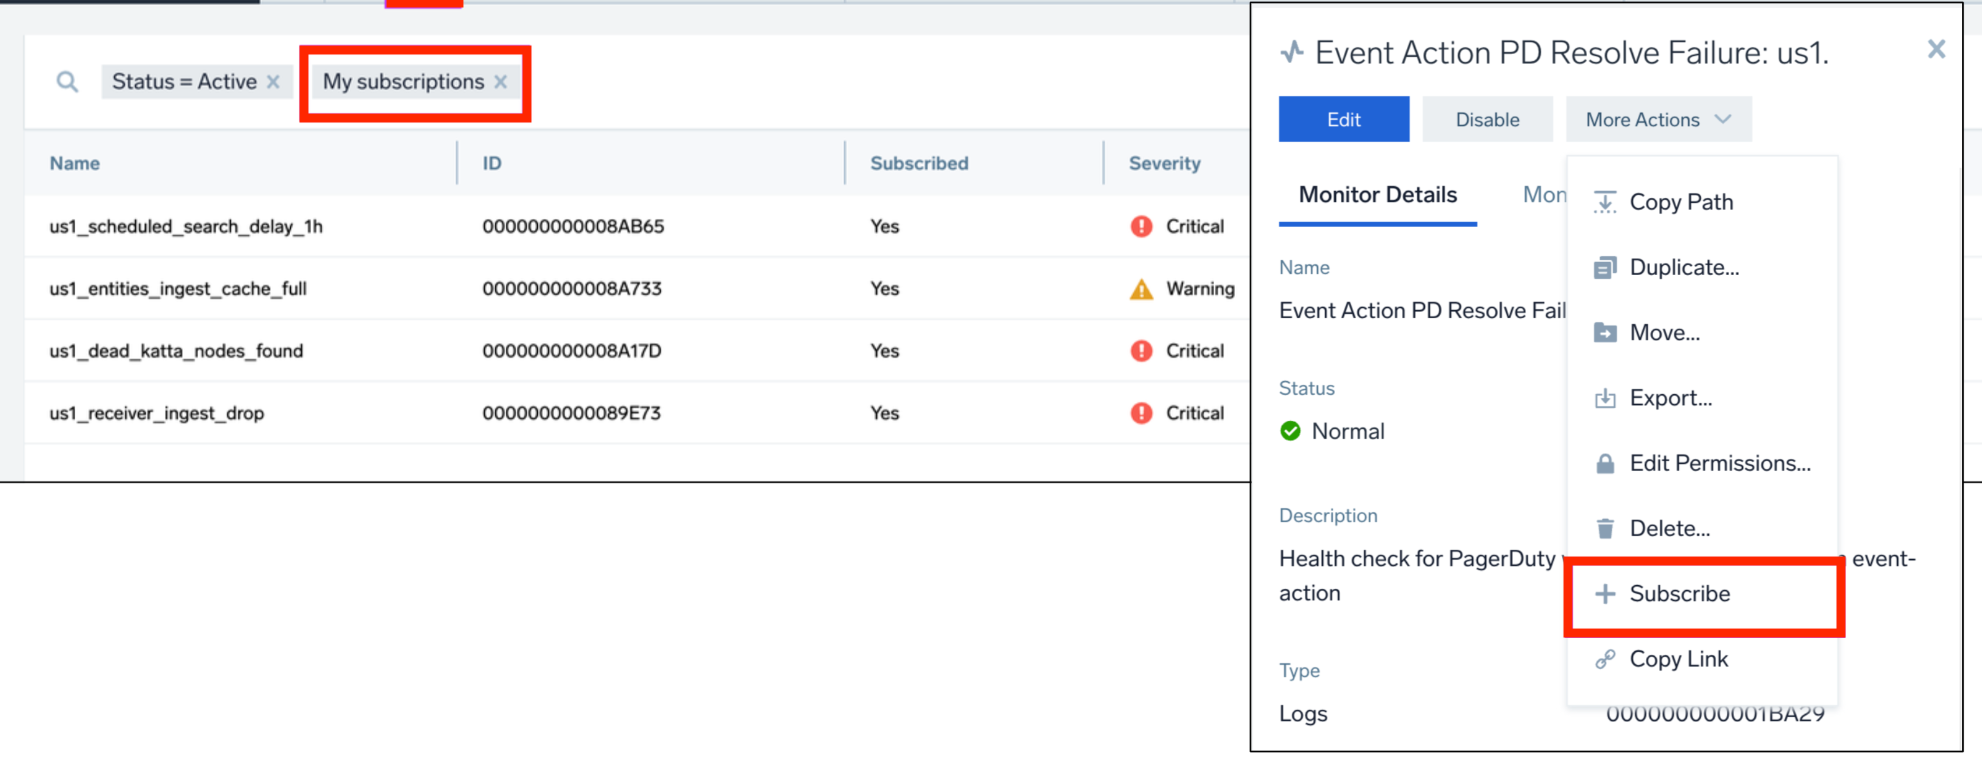
New - We’ve rolled out a feature that allows you to customize your Alert list page to display (by default) only the alerts that you care about, rather than showing all the open alerts within your organization.
You can do this by going to your Monitors page or Alerts page and subscribing to the specific monitors you'd like to follow.
With this release, we've also updated our Alert notification preferences to give you more granular control over specific monitor activity you want to follow.
November 18, 2022 (Traces)
Update - Tracing dashboards now offer native support for OpenTelemetry's deployment.environment standard tag.
OpenTelemetry deployment.environment is a helpful way of slicing APM data between environments (e.g. dev vs prod). Previously, this was supported in tracing metrics as metadata and available for custom queries and dashboards, and now it's supported in our out-of-the-box dashboards as well.
- New Explore view: APM: Environment View
- New dashboard elements
...across environmentsand...within environmentshow data sliced or filtered for recognized environments environmentadded to Entity Inspector as new entityenvironmentfilter added to all drill-down views- Application Service View and Service Application View renamed to APM: Application view and APM: Service View, respectively. Both views now have a hierarchy level with
deployment.environment.
Learn more:
November 15, 2022 (Traces)
New - We've released an OpenTelemetry Kubernetes Operator for tracing instrumentation. When you enable and install this operator, your application is instrumented automatically and traces will be sent to Sumo Logic. Learn more.
October 27, 2022 (Metrics)
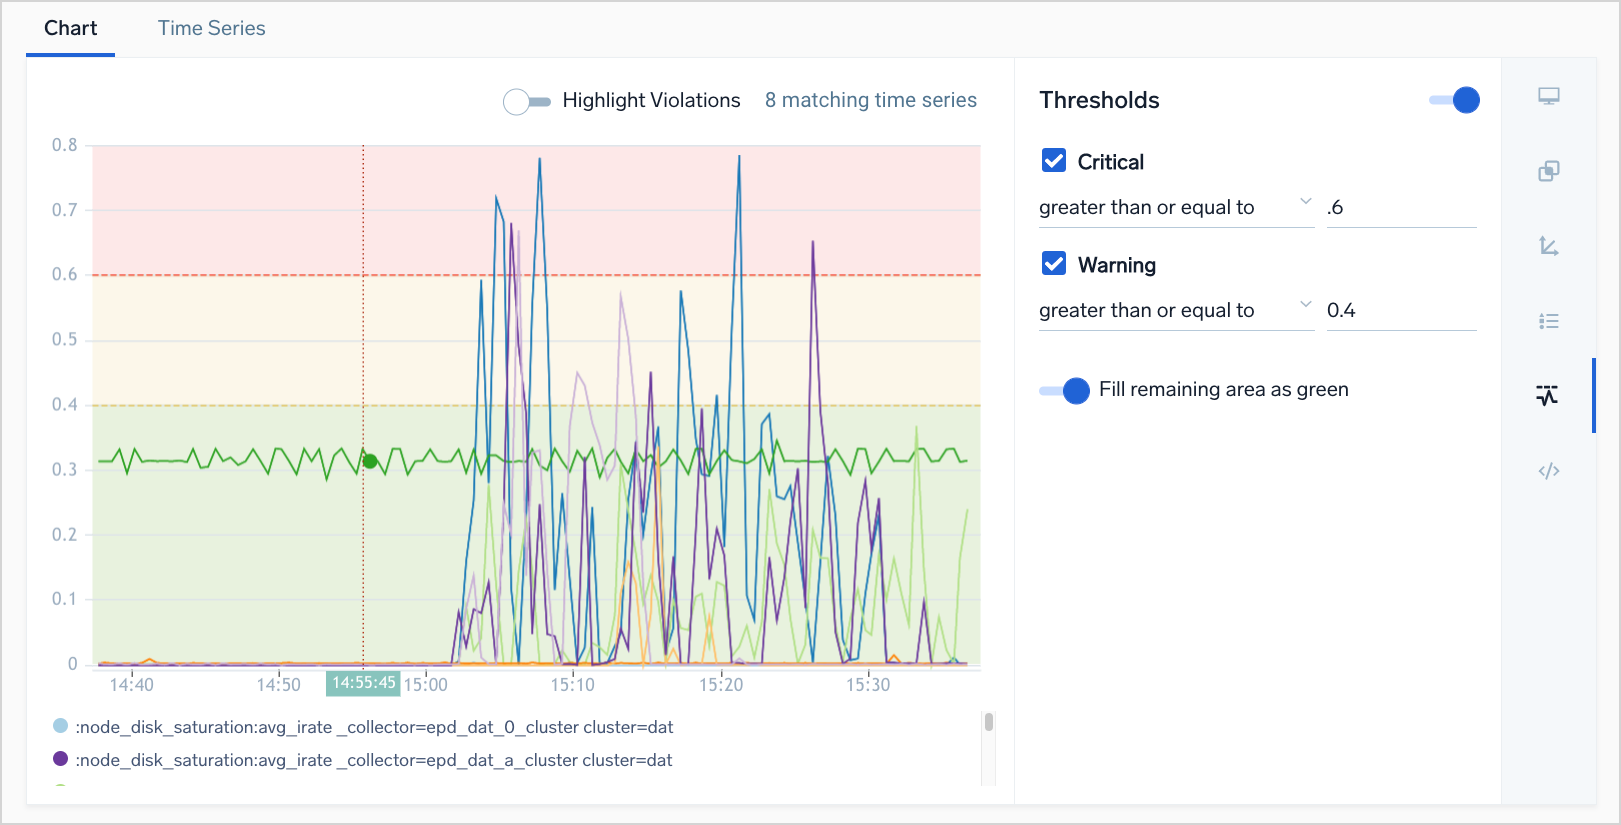
Update - We’ve enhanced the Metrics Explorer to make metric query results easier to interpret. Now, you can define Warning and Critical threshold values for query results. When you do that, your chart view will be color-coded so you can easily spot out-of-threshold behavior. For more information, see Set Warning and Critical Thresholds.
October 19, 2022 (Collection)
New - We’ve released a new Cloud-to-Cloud connector for Slack. The source uses the Slack Web API to collect channel, user, and message information from a Slack workspace. If you have a Slack Enterprise Grid license, the source also collects Security audit events across all of your Slack workspaces. For more information, see Slack Source.
October 19, 2022 (Apps)
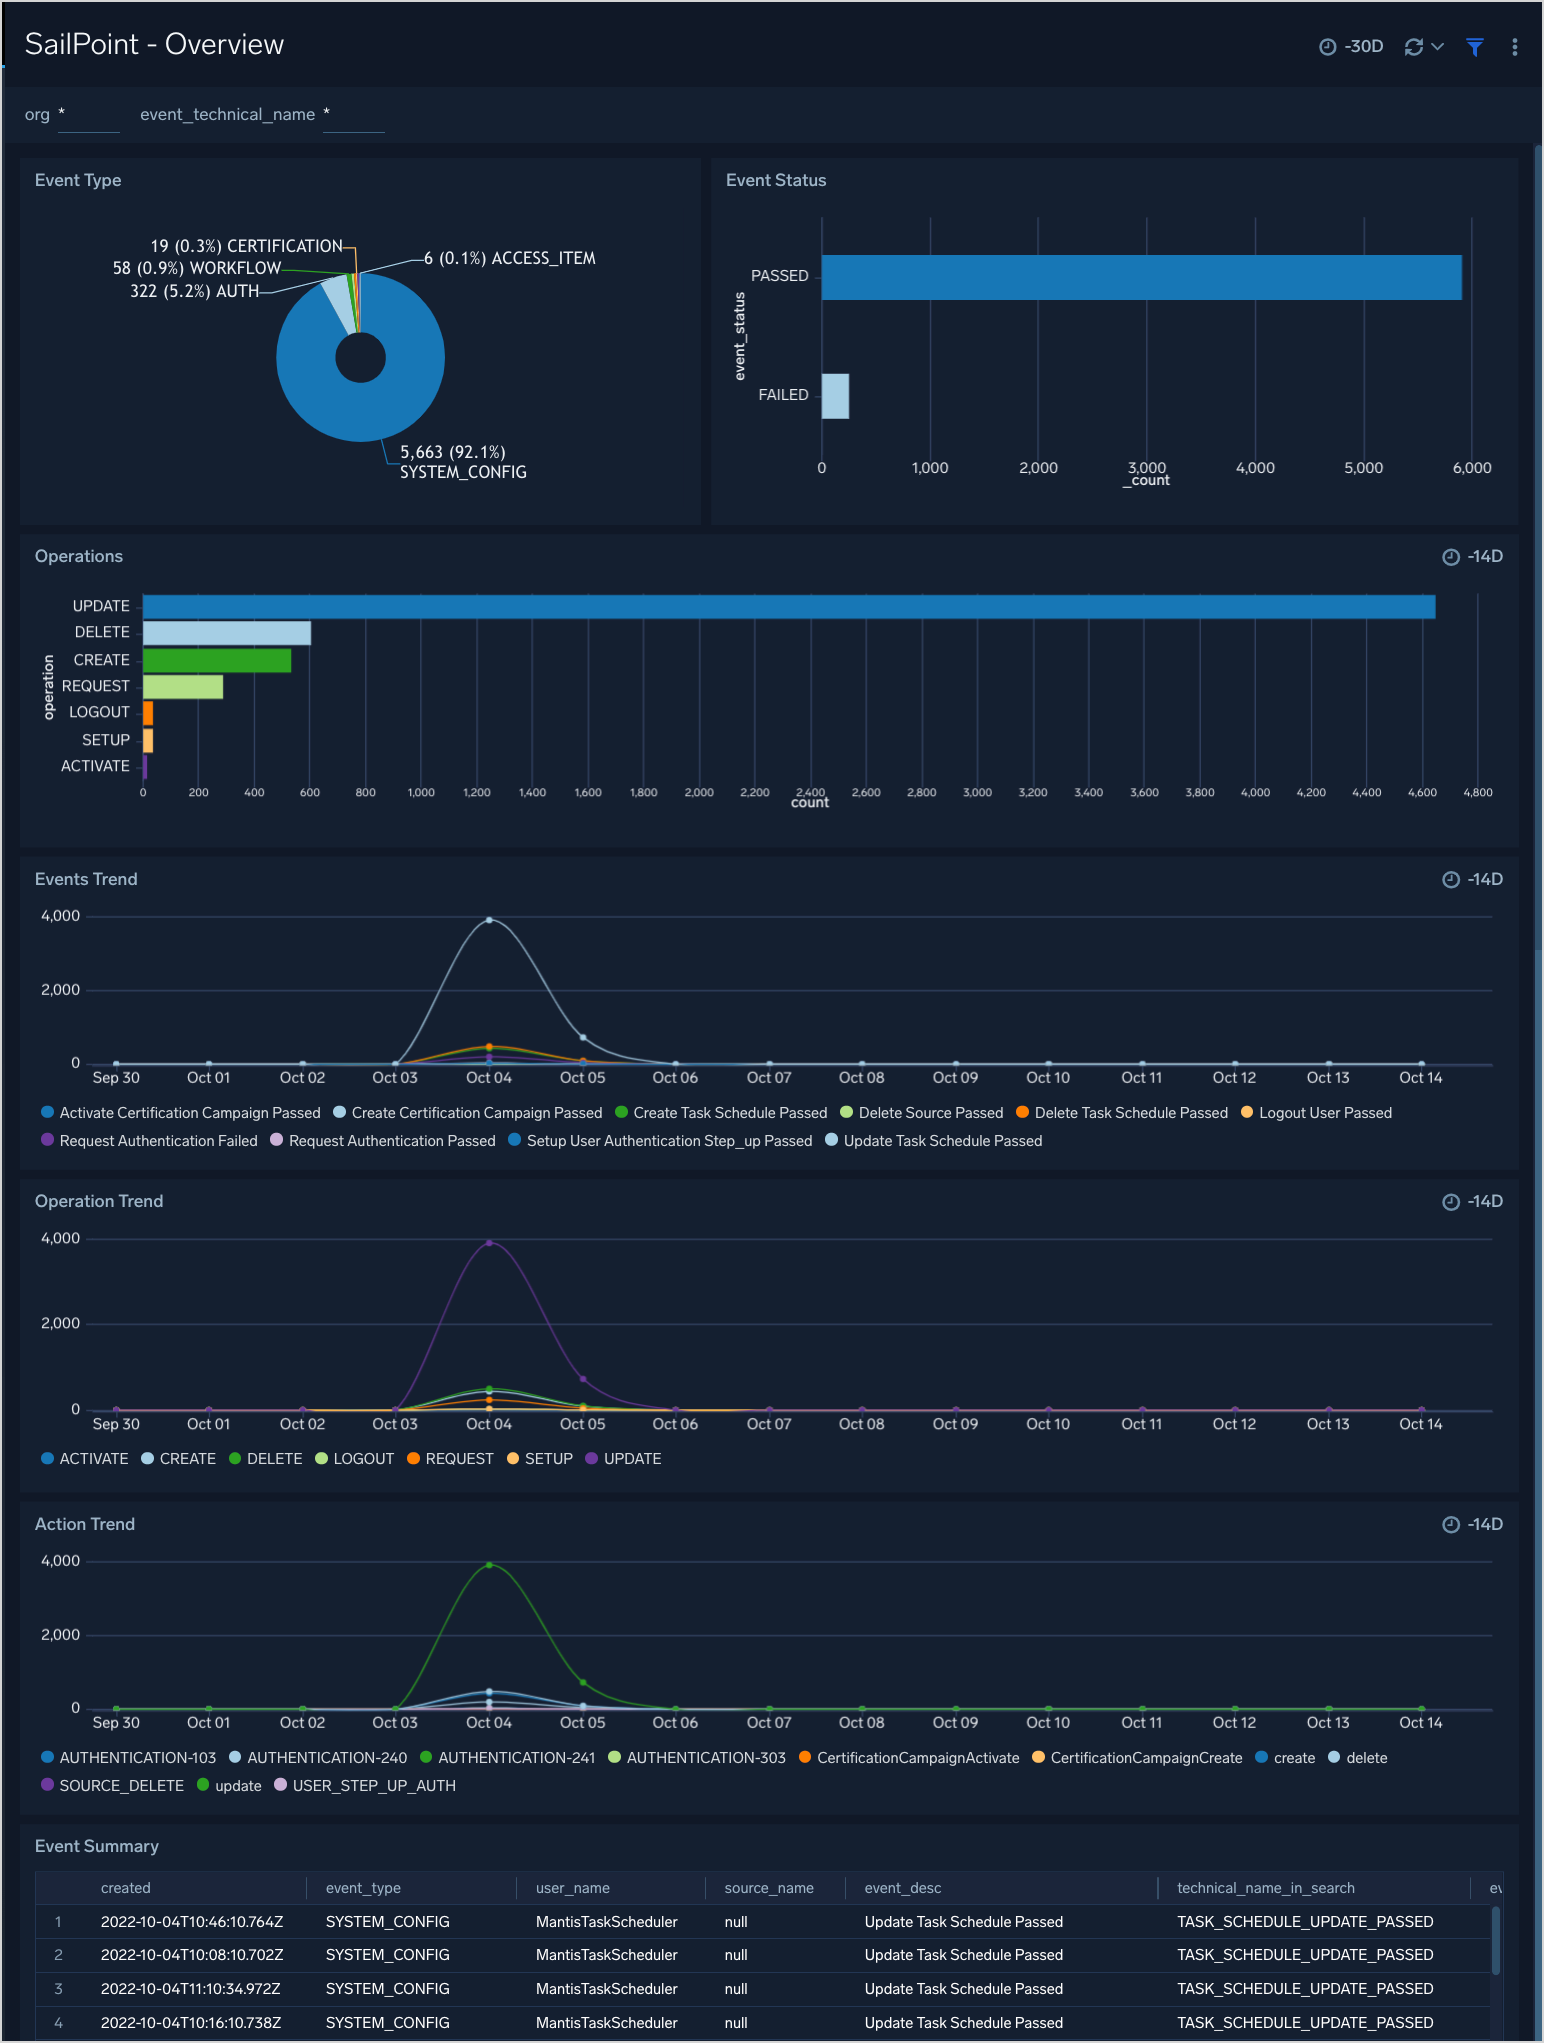
New - We are pleased to announce the availability of the Sumo Logic App for SailPoint. The Sumo Logic App for SailPoint helps you monitor the user events, actions, operations, failed logins, successful logins, and user activities to your applications through SailPoint.
October 18, 2022 (Apps)
New - We are pleased to announce the availability of the Sumo Logic App for CyberArk EPM. This new cloud-to-cloud connector uses Cyberark APIs to retrieve administrative audit events from every Set in your CyberArk environment.
October 14, 2022 (Search)
Update - We’ve made multiple updates to the Search Results Table to improve the user experience for viewing search results. The enhancements include:
- The ability to pin columns of interest.
- New setting to increase line height for messages.
- New table level options to expand and collapse messages.
- Context menu option to expand nested JSON.
October 14, 2022 (Manage)
Update - We’ve released an improvement that eases the processes of administering and monitoring Sumo Logic Orgs. To streamline the child org provisioning process, we added support for auto-provisioning Cloud SIEM instances for both enterprise and MSSP customers.
October 7, 2022 (Manage)
Update - We’ve released an improved, re-organized UI for Data Forwarding. There are now separate pages for managing different types of data forwarding destinations:
- Destinations that receive data forwarded from Sumo Logic partitions or scheduled views are still managed on the Manage Data > Logs > Data Forwarding page.
- Destinations that receive data from Installed Collectors are managed on a new page: Manage Data > Collection > Data Archiving page.
For more information, see Forward Data from Sumo Logic to S3.
October 3, 2022 (Search)
Update - Hash rules now support 256 for OpenTelemetry collectors.
September 27, 2022 (Metrics)
New - We're happy to announce two new metrics operators:
- ewma—Computes an exponentially weighted moving average on a stream of metrics. This allows you to smooth out short-term fluctuations (outliers) and display long-term trends.
- where—Allows you to filter data points by value.
September 27, 2022 (Observability)
Update - We are announcing a minor update of the AWS Observability 2.5.1. This contains changes required due to the end of support for Node.js 12.x in the AWS Lambda as announced here by AWS. As part of this update, the Node.js runtime environment for AWS Observability Lambda functions has been updated to 16.x. For more information on updating the AWS Observability to the latest version, see Update AWS Observability Stack.
September 19, 2022 (Manage)
Update - We've improved out Access Key UI to make it easy to spot Access Keys that haven't been used lately. Now the Access Keys management page displays the date and time an Access Key was last used to make a request to an API endpoint. For more information, see Access Keys.
In a future update, Sumo Logic will, by default, automatically disable Access Keys that have not been used for 30 days. Your Sumo Logic admin will be able to configure the period of time before an unused key will be disabled.
September 15, 2022 (Apps)
Update - GitHub Advanced Security dashboards are now available for the Sumo Logic App for GitHub. These new dashboards include Code Scanning Alerts, Pushes, Secret Scanning Alerts, Security and analyzes and Repository Vulnerability alerts.
September 12, 2022 (Alerts)
New - We’re happy to announce the release of Alert Grouping, which allows you to generate more than one alert from a given monitor by specifying a group condition on one or more fields. For example, rather than creating multiple monitors for each service, you could create one single monitor that notifies you when some metric (i.e., CPU utilization, error count) goes above the threshold for a given service. Learn more.
New - Configurable Resolution Window for Logs allows more quickly resolve alerts when the underlying issues are fixed. You can configure how long a monitor will wait, before resolving the alert, when the underlying issues was corrected (earlier the monitor waited one complete window before resolving). See Logs trigger types and Metrics trigger types.
New - You can now access your monitor playbook as a template variable, {{playbook}}. You can reference this template variable to customize your notification payloads similar to any other template variable. Learn more.
September 9, 2022 (Apps)
New - LambdaTest allows you to analyze your testing behavior and error trends. LambdaTest is a continuous quality testing cloud platform that helps developers and testers ship code faster. The LambdaTest platform provides secure, scalable, and insightful test orchestration for customers at different points in their DevOps (CI/CD) lifecycle.
New - we’re happy to announce the release of the Sumo Logic App for AWS Cost Explorer, which allows you to visualize, understand, and manage your AWS costs and usage over time.
With the Sumo Logic App for AWS Cost Explorer, you can use our out-of-the-box dashboards as well as filtering and grouping capabilities to dive deeper into your cost and usage data and generate custom insights. Gain a better understanding of your cost trends and see detailed information about the costs and usage associated with your top cost-accruing AWS accounts, regions, services, and operations.
Update - We are happy to announce the release of a new Explore Hierarchy for Database Application Components, together with the support of related Database Entities in Entity Inspector. This functionality allows you to organize your data in a structured hierarchy and utilize the database dashboards available out-of-the-box from App Catalog. Currently, the following Database engines are supported by this feature:
- Cassandra
- Couchbase
- Elasticsearch
- MongoDB
- MySQL
- PostgreSQL
- Redis
- SQL Server
- MariaDB
- Memcached
- Oracle
If you already use one of the above apps, you will need to reinstall it to benefit from the newly added functionality.
September 8, 2022 (Traces)
New - we're happy to share extended coverage for Real User Monitoring (RUM), our solution that provides insight into your users' end-to-end browser experience interacting with your web apps. New RUM capabilities include:
- New dashboard panels for the following metrics:
- XHR timing
- longtask delays (browser freezes)
- Core Web Vitals KPIs
- Geolocation
- Single-page app support:
- Monitoring of XHR calls and navigation/route changes
- XHR performance and availability metrics
- New specific Action names for XHR actions ("Click on [button] on [page]") and single-page app navigation/route change actions ("Route to [page]")
- New Explore tree levels for three new action types: document loads, XHR actions and route changes
- Browsers errors (e.g., unhandled errors/rejections, failed resources, console errors) are now captured automatically and populated in the
_index=sumologic_rum_errorslog index and dashboards- Browser errors ingest volume is now added to your Continuous Tiers budgets and credits consumption.
This new functionality requires RUM script in version 4 or higher (https://rum.sumologic.com/sumologic-rum-v4.js). Please ensure you are using the correct version in your pages. For automatic updates, use https://rum.sumologic.com/sumologic-rum.js.
August 30, 2022 (Metrics)
We're delighted to announce the availability of these new operators:
- stddev — Calculates the standard deviation of the metrics values that match the query.
- in — You can use this operator in a metrics query selector as shorthand for multiple OR conditions.
August 25, 2022 (Collection)
Update - We are pleased to announce that the following Cloud-to-Cloud Integration Framework sources are now available in Sumo Logic’s FedRAMP deployment:
August 17, 2022 (Search)
Update - For Enterprise Suite customers, we’ve doubled the number of Fields you can create. The per account Fields limit is now 400. The limit applies to Fields that you configure for sources or collectors and those you create using Field Extraction Rules.
August 8, 2022 (Search)
The new UI for creating and managing Scheduled Views that we described in our August 4 release note has been released.
August 5, 2022 (Apps)
New - We’re happy to announce the release of the Sumo Logic App for Host Metrics (EC2). This App allows you to collect your EC2 instance metrics using Sumo Logic Installed Collector and display them using predefined search queries and Dashboards. The App provides Dashboards to analyze EC2 instance metrics for CPU, disk, memory, and network.
Update - We are glad to update that the Sumo Logic App for MongoDB Atlas now allows you to monitor database operations and performance KPIs and provides visibility into the security posture of your clusters.
August 3, 2022 (Observability)
New - We're thrilled to announce our new Observability feature, Reliability Management, a foundational capability that helps you define, monitor and manage your modern app stacks to Service Level Objectives (SLOs). Managing SLOs is key to ensuring that modern app stacks are performing reliably for end users. SLOs also help you focus on measuring what matters for their end user’s digital experiences. As a result, they can streamline Observability by minimizing the monitoring and alert chaos that exists in many organizations. Benefits include:
- Simple experience for Site Reliability Engineers (SREs) and developers to define and monitor even their most complex SLOs
- Full-featured SLOs that can model any SRE requirement and leverage logs, metrics, and tracing telemetry
- Automation through Terraform, allowing developers and SREs to templatize, operationalize and manage SLOs as code
- SLO data available as log messages enabling customers to extend existing dashboards to feature SLO data or build proprietary dashboard experiences
See our Reliability Management docs for more information.
August 3, 2022 (Traces)
Update - we've increased data retention for Trace queries from 7 to 15 days, allowing for more time to search, filter, and diagnose recent issues. This 15-day extension comes at no additional cost. For more information, see Viewing and Investigating Traces.
August 2, 2022 (Observability)
Update - We’re happy to announce the release of our AWS Observability Solution v2.5.0, which includes.
- Enhanced dashboards for EC2 Host OS Metrics, including support for Amazon EC2 CloudWatch: now you can monitor your EC2 instances via CloudWatch and Installed Collector simultaneously and see results side-by-side.
- Support for Amazon SNS - we’ve added out-of-the-box dashboards with the most important information about messages, events, and errors illustrating SNS health and reliability.
- Enhanced dashboards for supported Amazon services - the following services were updated and revamped DynamoDB, API Gateway, RDS, EC2 Metrics, ElastiCache, and All Load Balancers.
- New CLI-based onboarding flow: now, you can roll out a comprehensive AWS monitoring with just a single CLI command by providing your AWS and Sumo credentials.
- Streamlining of Root Cause Explorer drill-downs. While you can still find your AWS anomalies in the RCE screen from the new menu and Entities panel, we have removed RCE dedicated “Events of interests” dashboards from the top-level Dashboards dropdown menu.
- Simplified TerraForm onboarding process by importing Field Extraction Rules (FERs).
- Bug fixes.
July 29, 2022
New - Our metricsfromtrace and rummetricsfromtrace metrics have a new metadata tag, deployment.environment, which is automatically created from same tag (part of OpenTelemetry specification) present in tracing data. In case the tag is not present in spans, deployment.environment is set to default. This tag can be used to build custom dashboards by environments (i.e., prod, staging, test). Support for this field in Explore views and out-of-the-box dashboards is coming soon.
July 28, 2022 (Manage)
New - The role capability we posted about on July 18—Download Search Results—is now released. This capability, which grants the permission to download log search results, is enabled for all roles. Note that if you manage role capabilities using the Sumo Logic API or Terraform, you need to add the “downloadSearchResults” capability to the capabilities list for each role that should be able to download search results.
July 22, 2022 (Apps)
New - The Sumo Logic App for AWS EC2 uses EC2 instance CloudWatch metrics & EC2 CloudTrail events and displays them using predefined dashboards. The App provides dashboards with insights into KPIs related to CPU, disk, network, EBS, Health Status Check, and events from EC2 CloudTrail.
Update - Amazon Simple Notification Service (SNS) is a pub/sub messaging and mobile notifications service for coordinating the delivery of messages to subscribing endpoints and clients.
The Sumo Logic App for Amazon SNS collects CloudTrail logs and CloudWatch metrics to provide insights into the operations and utilization of your SNS service. This includes tracking the most active topics, failures, errors, and geographical locations of SNS clients.
July 21, 2022 (Metrics)
Update - When you query high cardinality metrics, the results can be hard to read and interpret. The Metrics Explorer now offers aggregation tips—recommendations for adding an aggregation clause to high cardinality metrics queries. You can easily add the suggested clause to your query, or ignore the suggestion, as desired. For more information, see Metric Aggregation Tips.
July 18, 2022 (Manage)
Update - The week of July 25, 2022, we’ll be releasing a new role capability—Download Search Results—that grants the permission to download log search results. This capability will be enabled for all roles. If you manage role capabilities using the Sumo Logic API or Terraform, when the new capability is released, you’ll need to add the “downloadSearchResults” capability to the capabilities list for each role that should be able to download search results.
July 15, 2022 (Apps)
Update - The Sumo Logic AWS Lambda App uses the Lambda logs via CloudWatch, CloudWatch Metrics, and the CloudTrail Lambda Data Events to visualize the operational and performance trends in all the Lambda functions in your account. The preconfigured dashboards provide insights into executions, memory and duration usage by function versions or aliases, errors, billed duration, function callers, IAM users, and threat details. This app is updated from the AWS observability solution in the App Catalog. Updates include new Dashboards for Request, Error, Resource Usage, and Performance Analysis. Also, it includes a new Dashboard for analyzing Threat Intel.
New - The Sumo Logic App for AWS Network Load Balancer (that is a load balancer working on 4 layer of OSI model) is using metrics to provide insights to ensure that your network load-balancers are operating as expected, backend hosts are healthy and to quickly identify errors.
July 14, 2022 (Observability)
New - We’re pleased to announce our new in-product Kubernetes onboarding experience, which guides first-time users step by step through data collection setup (Orchestration, Infrastructure & App Data), the dashboard generation process, and alert monitors installation. To try it out, go to Sumo Logic > App Catalog > Kubernetes app > then follow the wizard steps. You can also refer to our new Kubernetes Quickstart doc, which mirrors the in-product onboarding workflow.
July 14, 2022 (Collection)
New - We’re pleased to announce the release of the GCP Metrics Source. The new source gives you visibility into Google Cloud Platform (GCP) infrastructure and managed services using an integrated Google Service account. You can collect metrics from 35 native GCP services, as well as from custom services running on GCP.
July 14, 2022 (Manage)
Update - We have renamed our default partition from “Default Continuous Partition” to “sumologic_default”. Now you can directly query the data stored in the default partition, where all data is ingested unless explicitly routed into another partition. Any APIs that reference the default partition by its previous name, “Default Continuous Partition”, should be updated to refer to “sumologic_default” instead. For more information, see Search the Default Partition.
July 13, 2022 (Manage)
Update - We have renamed our default partition from “Default Continuous Partition” to “sumologic_default”. Now you can directly query the data stored in the default partition, where all data is ingested unless explicitly routed into another partition. Any APIs that reference the default partition by its previous name, “Default Continuous Partition”, should be updated to refer to “sumologic_default” instead. For more information, see Search the Default Partition.
July 8, 2022 (Apps)
Update - The Sumo Logic App for AWS Observability Classic Load Balancer uses CW logs and metrics to give you visibility into the health of your Classic Load Balancer. Use the pre-configured dashboards to understand the latency, request and host status, threat intel, and HTTP backend codes by availability zone. This app is updated from the AWS observability solution in the App Catalog. Updates include upgrading all dashboards to Dashboards(New), additional Dashboards to analyze Request and Process Bytes, and Dashboard to monitor Threat Intel.
Update - The Sumo Logic App for Amazon ElastiCache provides visibility into key event and performance analytics that enable proactive diagnosis and response to system and environment issues. Use the preconfigured dashboards for at-a-glance analysis of event status trends, locations, successes, and failures, as well as system health and performance metrics. The dashboards also have additional performance insights for Redis clusters. This app is updated from the AWS observability solution in the App Catalog. Updates include upgrading all dashboards to Dashboards(New) and new Dashboards for Redis performance details and Command Latency.
Update - The Sumo Logic App for AWS Application Load Balancer uses CW logs and metrics to give you visibility into the health of your Application Load Balancer and target groups. Use the preconfigured dashboards to understand the latency, request and host status, threat intel, and HTTP backend codes by availability zone and target group. This app is updated from the AWS observability solution in the App Catalog. Updates include upgrading all dashboards to Dashboards(New) and new Dashboards for Response Analysis, Target Group Response Analysis, and Request and Processed Bytes.
July 8, 2022 (Metrics)
New - Care to comment? Now you can. In the Metrics Explorer, in Advanced Mode you can add comments to a metrics query and comment out portions of the query by using comment formatting. Comments are helpful for troubleshooting during query development, and also for other users who may use or edit your queries at a later date—comments you add will be visible in saved and shared queries. For more information, see Comments in Metric Queries.
Update - The eval metrics operator has been enhanced to support a _granularity option that provides the length, in milliseconds, of the bucket used for quantization, for use in metric queries.
July 8, 2022 (Observability)
New - We’re pleased to announce our new in-product Kubernetes onboarding experience, which guides first-time users step by step through data collection setup (Orchestration, Infrastructure & App Data), the dashboard generation process, and alert monitors installation. To try it out, go to Sumo Logic > App Catalog > Kubernetes app > then follow the wizard steps. You can also refer to our Kubernetes Quickstart doc, which mirrors the in-product onboarding workflow.
July 7, 2022 (Metrics)
Update - We’ve improved our zoom-in feature for metric charts. Up until now, zooming into a metric chart simply increased the size of the chart. Now, for time series charts in which the query uses automatic quantization, when you zoom in the chart presents results based on more granular data: the bucket size across which results are quantized is reduced.
July 4, 2022 (Apps)
New - The Sumo Logic AWS API Gateway App provides insights into API Gateway tasks while accepting and processing concurrent API calls throughout your infrastructure, including traffic management, CORS support, authorization, access control, throttling, monitoring, and API version management. This App was already part of the AWS observability solution and will now be available as a standalone app in the App catalog.
Update - The Sumo App for Amazon DynamoDB uses logs and metrics to provide operational insights into your DynamoDB. The App includes Dashboards that allow you to monitor key metrics, view the throttle events, errors, and latency, and help you plan the capacity of your DynamoDB instances. This App updates from the AWS observability solution in the App Catalog. Updates include upgrading all dashboards to Dashboards(New) and adding a new threat intel Dashboard to the App.
Update - The Sumo Logic Amazon RDS App dashboards provide visibility into your Amazon Relational Database Service (RDS) performance and operations. Preconfigured dashboards allow you to monitor critical metrics of your RDS cluster, including CPU, memory, storage, the network transmits and receive throughput, read and write operations, database connection count, disk queue depth, and more. Audit activity dashboards help you monitor activities performed on your RDS infrastructure. This app updates from the AWS observability solution in the App Catalog. Updates include upgrading all the dashboards to Dashboards(New). New Audit activity dashboards help you monitor activities performed on your RDS infrastructure and RDS instance-specific dashboard support for - Aurora and MySQL and Performance Insights dashboards.
Update - Sumo Logic and AWS are excited to announce an update to Sumo Logic Integrations for AWS Organizations. This solution allows joint customers of AWS and Sumo Logic to automate the integration of AWS Security Reference Architecture-compliant organizations with Sumo Logic Cloud SIEM powered by AWS.
Our updates support Security Reference Architecture (SRA)-compliant setup of:
- AWS Security Hub
- Centralized logging of AWS Network Firewall and AWS WAF
- AWS Firewall Manager
New - We are happy to announce the release of AWS Observability Installation Automation. This release enables a simplified method of deploying AWS Observability using default parameters with just one quick command requiring only Sumo Access Id and Key. This method features POSIX and PowerShell scripts to trigger the Cloud Formation template for creating a stack to enable complete visibility into your AWS account infrastructure's health and reliability.
July 4, 2022 (Alerts)
Update - We’re continuing to make alerts and monitors more customizable to give you control over how often you are notified. You can now:
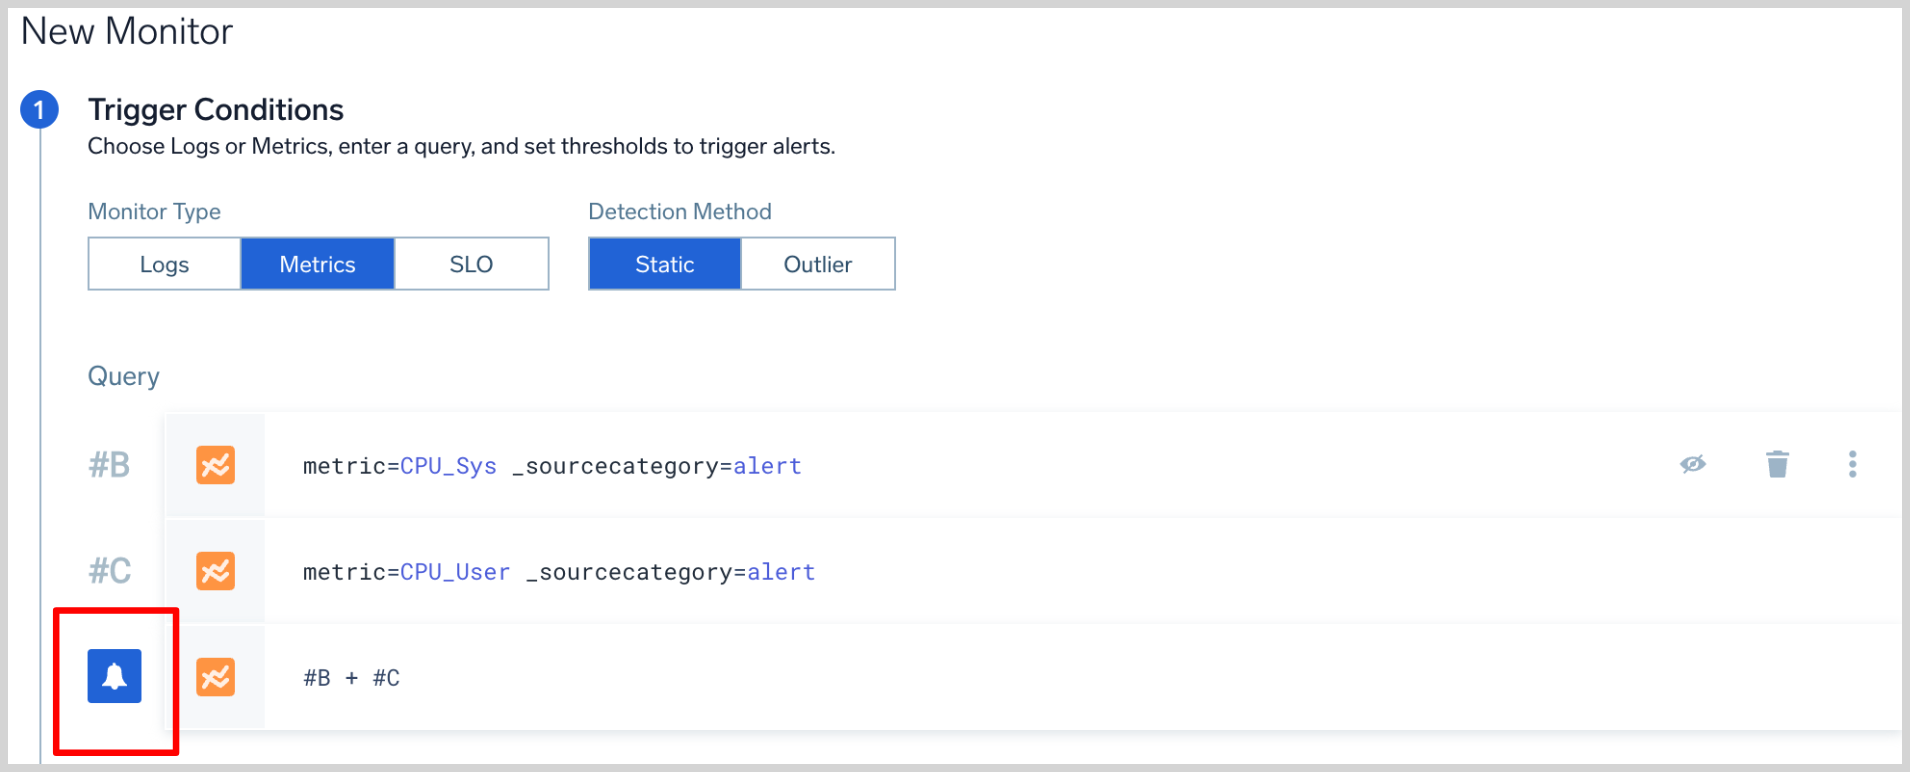
- Visually indicate Alerting Query: For Metrics monitors with multiple query rows, we now visually indicate the alerting query row with a notification bell icon.
- Improved JSON Validations for Connection Payloads: We're enforcing stricter JSON validation during creation and updating of Connections to prevent errors that could cause notification failures in the future. There are two major validations that we have started enforcing:
- If there is a trailing comma (
,) after the last"key": "value"in the JSON Payload structure, we will error out. - If there are multiple keys with the same name at the same level within a JSON payload, we will throw an error.
- If there is a trailing comma (
- Monitor Alerts/Recovery Condition changes: We no longer support Log Monitors with an Alert threshold condition of “
less than 0” or “greater or equal to 0” . This is because Log queries always result in0(when there is no data) or more (when there is data) rows, and monitors that were configured with these conditions were not firing alerts.
June 23, 2022 (Alerts)
Update - We’ve made alerts and monitors more customizable to give you control over how often you are notified. You can now:
- Customize the alert name to differentiate between multiple alerts created from the same monitor.
- Choose recovery based on “Single Data point” meeting the recovery threshold or “all data points” meeting the threshold before the alert is resolved.
June 21, 2022 (Traces)
Update - Traces can now show aggregated trace duration critical path contribution (CPC) breakdown chart summarized for all traces from the Traces query result set.
Use this chart to:
- Quickly understand intermittent duration spikes or slowdowns
- Immediately spot offending service by comparing CPC contribution by service
June 15, 2022 (Apps)
New - Gigamon ThreatINSIGHT allows you to stay a step ahead by giving your security teams more: time, data, and insight into attacker behavior. The Gigamon ThreatINSIGHT App for Sumo Logic provides dashboards and visualizes data from ThreatInsight MetaStream files, which helps in identifying potential threats enabling rapid, informed response.
New - The Gigamon HAWK app for Sumo Logic provides deep observability by collecting application context from the network. Its rich metadata attributes extraction offers a holistic picture of what’s happening in the network.
New - The Lucidum app for Sumo Logic eliminates blind spots across cloud, security, and IT operations. It gives information about assets, data sources, services, locations, risk factors, and ports.
June 14, 2022 (Metrics)
Update - We’re happy to announce a new and improved Time Series tab (previously known as the Preview Table) in the Metrics Explorer. The redesigned table is more compact and easier to read, and you can control which dimensions and data appear in the table using the checkboxes in the pane to the left of the table. When you mouse over a cell in the Time Series table, you can click a three-dot kebab icon to display a context menu that allows you to add dimensions to the query, copy dimensions and values, copy the entire time series, and more. The context menu is supported in both basic and advanced mode. You can export query results in whole or in part to a .csv file.
June 10, 2022 (Collection)
New - Our Cloud-to-Cloud Integration Framework has two new Sources, Netskope WebTx: The Netskope WebTx API integration ingests Web Transaction logs from Netskope Event Steam and Box: The Box API integration ingests events from the Get Events API. It securely stores the required authentication, scheduling, and state tracking information.
June 9, 2022 (Tracing)
Beta - Setting up Tracing instrumentation for Java, Python and NodeJS applications deployed in Kubernetes just got easier. In a few simple steps with the OpenTelemetry-Operator your application is automatically instrumented and your Traces are sent to Sumo Logic. Auto instrumentation for Java, Python and NodeJS applications deployed in Kubernetes is now in Beta.
June 8, 2022 (Apps)
New - We pleased to announce the availability of the Carbon Black Cloud App. This app analyzes alert and event data from VMware's Endpoint Standard and Enterprise EDR products and provides comprehensive visibility into the security posture of your endpoints, enabling you to determine the effects of breaches in your environment. The app provides visibility into key endpoint security data with preconfigured dashboards for alerts, threats intelligence, feeds, sensors, alerts, users, hosts, processes, IOCs, devices and network status.
June 7, 2022 (Manage)
New - Want to upgrade or change your Cloud Flex Credits Essentials plan? Good news: now you can do it yourself. If you’re a Sumo Logic admin, you can use the Manage Plan page to change your plan period from monthly to annual, or from annual to monthly. You can also increase or decrease your account ingest levels and retention settings to meet your evolving requirements. For more information, see Update a Cloud Flex Credits Account.
Effective March 2024, Cloud Flex Credits is now Sumo Logic Credits.
June 2, 2022 (Manage)
New - We are excited to announce support for Span Links is now available in Tracing. You can navigate between spans using hyperlinks in the metadata tab as well as search for spans in the trace query and span analytics areas. Span Links are part of OpenTelemetry specification and should be added on the instrumentation side. Links can point to Spans inside a single Trace or across different traces and can represent, for example, batch operations where a span is initiated by multiple initiating spans. For more information, see View and Investigate Traces.
May 27, 2022 (Metrics)
Update - We’re making some architectural changes to the Sumo Logic Metrics Engine to support on-going functionality and scalability improvements. The changes may have some impact on query language semantics for queries that use aggregation or reducer operators.
For aggregation queries, the changes are limited to the metadata used to label the metric dimension in the Preview Table in the Metrics Explorer, and in the chart legend. For queries with reducer functions–eval, filter, topk, bottomk–there may be a slight difference in how we quantize the metric data. The engine updates will be rolled out starting on June 13, 2022. For information how the updates might affect existing metrics queries, and how you can update existing queries to avoid any impact, see Metrics Engine Updates.
May 23, 2022 (Traces)
New - We're happy to announce that you can now instrument Lambda layers for Java in container-based Lambda functions and then see these Traces in Sumo Logic.
May 20, 2022 (Alerts)
Updated - We’re pleased to announce the availability of permissions for Monitors folders. This feature enables folder-level control of who can view, update, create, delete, and manage Monitors. For more information, see Grant permissions to Monitors folders.
This feature is not enabled by default. Contact Sumo Logic Support to have it enabled.
May 16, 2022 (Apps)
Update - We've improved your Sumo Logic app installation process and added guidance to make it easier to find the sources you need and get started faster with all the dashboards and pre-built queries we have waiting for you.
May 11, 2022 (Alerts)
New - The new default payloads are now available for the following connections using new variables.
- AWS Lambda
- Azure Functions
- Cloud SOAR
- Datadog
- Jira
- Microsoft Teams
- New Relic
- PagerDuty
- ServiceNow
- ServiceNow (Legacy)
- Slack
- Webhook
May 10, 2022 (Apps)
New - We are excited to announce the Sumo Logic 1Password app release. You can now monitor your 1Password account’s sign-in and item usage events. The dashboards help in providing insights into failed authentications, successful authentication, event breakdown by client applications, type, category, users, geolocation of events, outliers, and threat analysis of sign-in events. This app also helps you secure your 1Password vault access by providing insights into user actions and threat intel analysis on clients accessing items in shared vaults.
April 28, 2022 (Manage)
Update - The default web session timeout for new users has been increased from 15 minutes to 6 hours. If your currently configured session timeout is set to less than 6 hours, new users will receive the value set within the policy as the default.
Update - We Increased the timeout for new user account verification from 12 hours to 72 hours to allow for weekends and to give new users more time to see and take action on the new user welcome email.
April 26, 2022 (Collection)
New - Our Cloud-to-Cloud Integration Framework has a new Source. The Dropbox Source provides a secure endpoint to receive team events from the Get Events API.
Update - The Tenable Source now supports collecting audit logs from the Audit Log API and assets from the Asset Export API. We've also added the ability to define Processing Rules.
April 26, 2022 (Traces)
New - You can now add the results of Spans queries directly to Dashboards from the Spans analytics window. You'll use the same easy query builder to modify your panels later. You can still use Log Search to add span results to Dashboards by running queries in the _trace_spans index. The same limitations of Log Search still apply, your query scan volume should not exceed 200x of your tracing ingest.
April 17, 2022 (Apps)
Update - We’ve released an update to the Amazon S3 app. The key improvement is a new Threat Intel dashboard that provides high-level views of threats across your S3 buckets and objects. We also added a new “S3_Bucket” filter to each of the dashboards, so you can slice and dice data by S3 bucket name.
April 7, 2022 (Alerts)
New - System events for Alerts are now logged to the Sumo Logic Audit Event Index. You can use the alert system events to analyze your monitoring posture overall and answer questions like these, and more:
- How many alerts are created and resolved per day?
- Which monitors fire the most alerts?
- How long does it typically take to resolve alerts?
You can search for system events for Alerts by scoping your search like this:
_index=sumologic_system_events _sourceCategory=alerts
April 6, 2022 (Alerts)
Update - The alert history of a Monitor is now quickly accessible on a new tab of the details pane.
April 5, 2022 (Collection)
New - We're excited to announce a new milestone in innovation for Sumo Logic Observability with the Sumo Logic OpenTelemetry Distro Collector (OT Distro).
The OT Distro Collector is designed to simplify and democratize the collection of logs, metrics, traces, and metadata from modern cloud applications. With this announcement, Sumo Logic further embraces open source and establishes OpenTelemetry as its future standard to collect all machine data, breaking from the legacy model of using proprietary agents to gather critical application and infrastructure telemetry.
April 4, 2022 (Apps)
Update - We’ve updated two Sumo Logic apps for Palo Alto Networks to support PAN-OS 10:
- PCI Compliance for Palo Alto Networks 10
- Palo Alto Firewall 10 - Cloud Security Monitoring and Analytics
March 31, 2022 (Observability)
Update - The AWS Observability Solution 2.4.0 release includes a new AWS Service - Classic Elastic Load Balancer (ELB), install location selection, and sharing options with the Sumo Logic organization during installation. This update also includes updated dashboards for AWS Classic ELB Service, a new AWS ECS - Events dashboard for AWS CloudTrail, enhanced Lambda dashboard for Lambda cold start duration, and updated FERs. Update to the latest version to take advantage of these features. See the Changelog for additional details.
March 29, 2022 (Observability)
New - Our Cloud-to-Cloud Integration Framework has a new Source. The SailPoint Source provides a secure endpoint to receive Events and User Inventory data from the IdentityNow V3 API.
March 28, 2022 (Apps)
New - We are delighted to announce the release of the Sumo Logic Amazon Route 53 Resolver Security app. Use this app to monitor and analyze the DNS queries and Resolver Firewall logs for your Amazon Route 53 deployment. The preconfigured dashboards provide insight into a variety of DNS activities in your environment.
March 25, 2022 (Apps)
Update - The AWS Kinesis Firehose for Logs Source now has the option to collect undelivered logs from the backup directory.
Update - The Azure Event Hubs Source now supports Processing Rules and timestamp configuration options for logs.
March 17, 2022 (Apps)
New - We are excited to announce the release of the Sumo Logic PagerDuty V3 App. The PagerDuty V3 app collects incident messages from your PagerDuty account via a webhook, and displays incident data in pre-configured Dashboards that allow you to monitor and analyze the activity of your PagerDuty account and Services. The Sumo Logic App for PagerDuty V3 uses Webhooks V3, to provide enhanced context for alert object models.
March 15, 2022 (Traces)
We are proud to announce general availability of extended trace filtering capabilities. This allows you to search for traces by any existing and new metadata, including your custom ones without a need to add this to the configuration or knowing this upfront, before you start ingesting data. Just add any metadata tag to your spans and, as long as its cardinality within a trace is not too high, you will be able to filter by it right away in your Traces UI. See View and Investigate Traces for more information.
March 8, 2022 (Collection)
Our Cloud-to-Cloud Integration Framework has the following new Sources:
- Microsoft Azure AD Inventory Source
- MS Graph Azure AD Reporting Source
- MS Graph Identity Protection Source
March 1, 2022 (Collection)
New - If you are using Sumo Logic Cloud SOAR, you can now integrate Monitors and Scheduled Searches with Cloud SOAR via a new webhook connection. This new capability allows you to send Alerts to Cloud SOAR to further process and operate on these incidents. The result is a rich and connected experience between your data residing in Sumo Logic and the security response capabilities within Cloud SOAR.
February 24, 2022 (Search)
New - The Search Query Language has a new operator, dedup allows you to:
- Remove duplicate events containing an identical combination of values for the fields.
- Specify the number of duplicate events to keep for each value of a single field.
- Choose a combination of duplicate values among several fields.
February 18, 2022 (Security)
Update - We’ve eased the process of offboarding Sumo Logic users. Now, when you delete a user’s Sumo Logic account, you can transfer the user’s Monitors to another user, along with folders, searches, scheduled searches, scheduled views, monitors, and dashboards. For more information, see Delete a User.
February 18, 2022 (Monitors)
Update - The Monitors page has a new shortcut to quickly view triggered alerts from a Monitor. Hover your cursor over the Status column of a Monitor and click the icon to open Alert List.
February 12, 2022 (Apps)
New - We are delighted to announce the release of the Sumo Logic Couchbase App. The Couchbase app is a unified logs and metrics app that helps you monitor the availability, performance, and resource utilization of Couchbase database clusters. The preconfigured dashboards provide insight into the health of clusters, the status of the buckets, I/O of reading/writing, errors, events of Couchbase servers that help you understand your clusters.
February 11, 2022 (Manage)
Update - We’ve made an improvement to the Sumo Logic Organizations (Sumo Orgs) feature, which allows you to create, provision, and manage multiple "child" orgs from a "parent" org. Now, when you provision a child org, you can allocate credits for trace ingestion, as well as log and metric ingestion.
February 10, 2022 (Traces)
New - Number of spans per Trace has been increased by 10 times to 10000 spans per trace to better support monitoring for long running and complex transactions. Please note that new spans can increase credits consumption.
Update - Traces logs and data includes a new duration field that holds the difference between endTimestamp and startTimestamp in nanoseconds.
February 8, 2022 (Traces)
New - Announcing general availability of dashboard support for Trace Spans data index. You can now pin results of your queries on spans data directly to the Dashboard. You can add the query through the Log Search screen when running queries in _trace_spans index as long as your read volume does not exceed 200x of your tracing ingest (more info). Support for doing this directly from the Spans analytics window is coming soon.
February 4, 2022 (Apps)
New - The Sumo Logic app for Sauce Labs integrates your Sauce Labs test data with the Sumo Logic Analytics Platform to easily aggregate, visualize, and monitor all of your test data. Connect Sauce Labs data with other data sources for a comprehensive view of your development pipeline.
January 26, 2022 (Apps)
New - The SDO App now provides a Software Development Optimization - Development & Delivery Times dashboard to help you monitor development lead times and delivery lead times across the three main phases of development and delivery: Active Development, Review and Merge, and Deployment. Each section shows the phases broken down by team, service, and environment.
January 19, 2022 (Traces)
New - Traces now include Span Events that describe and contextualize the work being done in a Span by tracing and displaying that data in Trace Views. These events are optional time-stamped strings made up of a timestamp, name, and (optional) key-value pair attributes. Select a marker in the timeline or a span to review the Span Event data.
January 18, 2022 (Apps)
New - We are delighted to announce the release of the Sumo Logic MariaDB app. The MariaDB app is a unified logs and metrics app that helps you monitor the availability, performance, and resource utilization of MariaDB database clusters. Preconfigured dashboards and searches provide insight into the health of your database clusters, performance metrics, resource metrics, schema metrics, replication, error logs, slow queries, Innodb operations, failed logins, and error logs.
New - We are excited to release the Sumo Logic Nginx app. The Nginx app is a unified logs and metrics app that helps you monitor the availability, performance, health, and resource utilization of your Nginx web servers. Preconfigured dashboards and searches provide insight into connections, requests, visitor locations, visitor access types, traffic patterns, errors, web server operations, and access from known malicious sources.
New - We are delighted to release the Sumo Logic IIS 10 app. The IIS 10 app is a unified logs and metrics app that helps you monitor the availability, performance, health, and resource utilization of your IIS web servers. Preconfigured dashboards and searches provide insight into application pools, ASP.NET applications, requests, latency, visitor locations, visitor access types, traffic patterns, errors, web server operations, and access from known malicious sources.
Update - We are excited to release the additional Logs and Metrics dashboards added for the Sumo Logic Oracle app. The Oracle app is a unified logs and metrics app that helps you monitor the availability, performance, and resource utilization of Oracle database clusters. Preconfigured dashboards and searches provide insight into the health of your database clusters, parallel executions, resource utilization, response time, tablespaces, throughput, wait for class/events, listeners, audit logs, and security.
Update - We are pleased to announce the availability of additional Logs and Metrics dashboards added for the Sumo Logic Nginx Ingress app. The Nginx Ingress app is a unified logs and metrics app that helps you monitor the availability, performance, health, and resource utilization of your Nginx Ingress web servers. Preconfigured dashboards and searches provide insight into connections, requests, ingress controller metrics, visitor locations, visitor access types, traffic patterns, errors, web server operations, and access from known malicious sources.
Update - We are delighted to release the additional Logs and Metrics dashboards added for the Sumo Logic Squid Proxy app. The Squid Proxy app is a unified logs and metrics app that helps you monitor activity in Squid Proxy. The preconfigured dashboards provide insight into served and denied requests; performance metrics; IP domain DNS statistics; traffic details; HTTP response codes; URLs experiencing redirects, client errors, and server errors; and quality of service data that helps you understand your users’ experience.
January 18, 2022 (Alerts)
New - You now have the ability to configure how often a dashboard is refreshed by clicking the dropdown arrow next to the refresh icon.